. 2024 May 13:15:1278197.
doi: 10.3389/fimmu.2024.1278197. eCollection 2024.

Studying the cellular basis of small bowel enteropathy using high-parameter flow cytometry in mouse models of primary antibody deficiency

Affiliations

Studying the cellular basis of small bowel enteropathy using high-parameter flow cytometry in mouse models of primary antibody deficiency

Ahmed D Mohammed et al. Front Immunol. .

Abstract

Background: Primary immunodeficiencies are heritable defects in immune system function. Antibody deficiency is the most common form of primary immunodeficiency in humans, can be caused by abnormalities in both the development and activation of B cells, and may result from B-cell-intrinsic defects or defective responses by other cells relevant to humoral immunity. Inflammatory gastrointestinal complications are commonly observed in antibody-deficient patients, but the underlying immune mechanisms driving this are largely undefined.

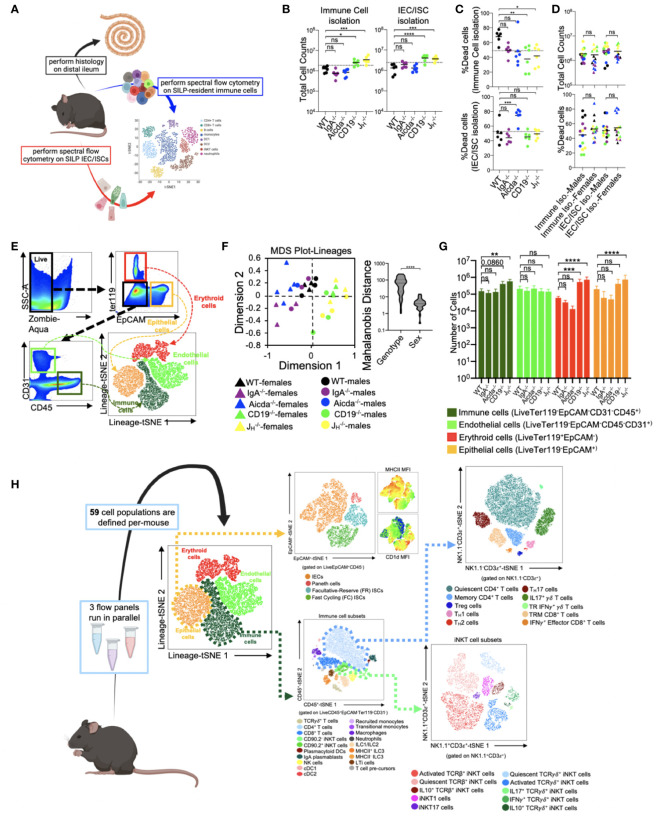
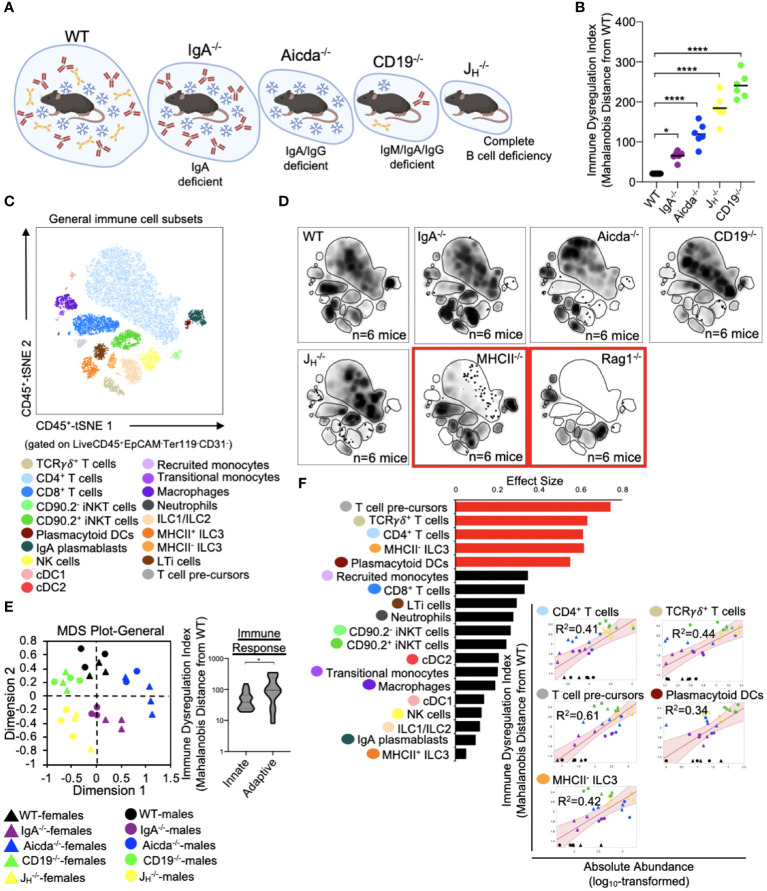
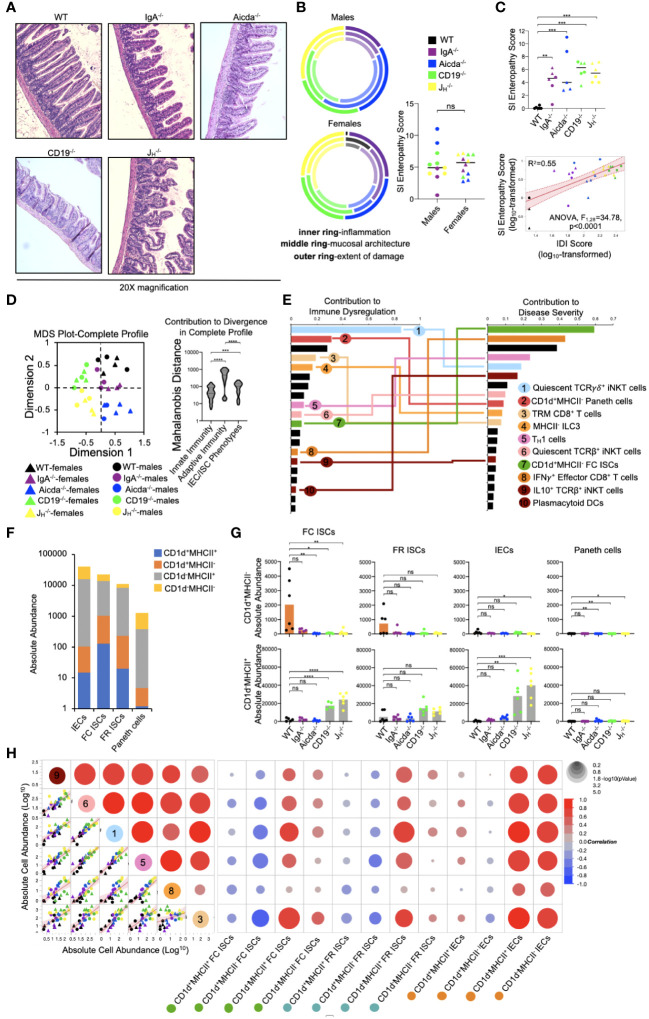
Methods: In this study, several mouse strains reflecting a spectrum of primary antibody deficiency (IgA-/-, Aicda-/-, CD19-/- and JH -/-) were used to generate a functional small-bowel-specific cellular atlas using a novel high-parameter flow cytometry approach that allows for the enumeration of 59 unique cell subsets. Using this cellular atlas, we generated a direct and quantifiable estimate of immune dysregulation. This estimate was then used to identify specific immune factors most predictive of the severity of inflammatory disease of the small bowel (small bowel enteropathy).

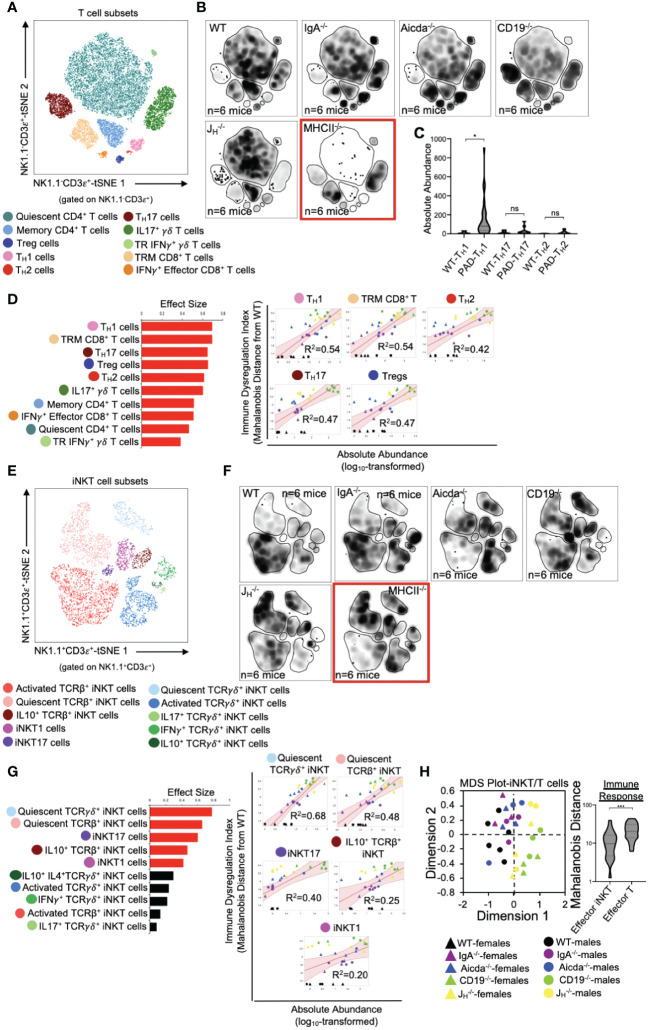
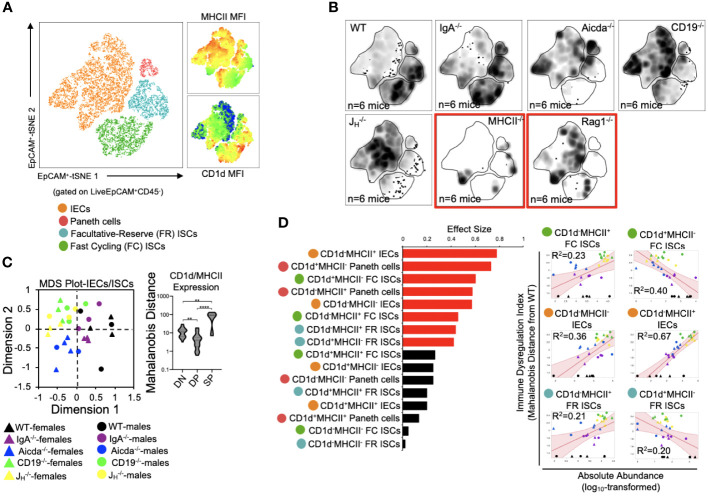
Results: Results from our experiments indicate that the severity of primary antibody deficiency positively correlates with the degree of immune dysregulation that can be expected to develop in an individual. In the SI of mice, immune dysregulation is primarily explained by defective homeostatic responses in T cell and invariant natural killer-like T (iNKT) cell subsets. These defects are strongly correlated with abnormalities in the balance between protein (MHCII-mediated) versus lipid (CD1d-mediated) antigen presentation by intestinal epithelial cells (IECs) and intestinal stem cells (ISCs), respectively.

Conclusions: Multivariate statistical approaches can be used to obtain quantifiable estimates of immune dysregulation based on high-parameter flow cytometry readouts of immune function. Using one such estimate, we reveal a previously unrecognized tradeoff between iNKT cell activation and type 1 immunity that underlies disease in the small bowel. The balance between protein/lipid antigen presentation by ISCs may play a crucial role in regulating this balance and thereby suppressing inflammatory disease in the small bowel.

Keywords: high-dimensional flow cytometry; humoral immunity; immune dysregulation; primary antibody deficiency; small intestine.


Conflict of interest statement

The authors declare that the research was conducted in the absence of any commercial or financial relationships that could be construed as a potential conflict of interest.

Figures

Figure 1
Figure 1
Development of a cellular atlas of the murine small bowel using high-parameter flow cytometry. (A) A schematic summarizing our experiment design is shown. (B) The total cell counts that are obtained using our two cell isolation strategies are shown. (C) Cell viability reflected as the percentage of dead cells is shown. (D) The distributions of total cell count and cell viability are plotted by sex for each isolation strategy. (E) A representative gating strategy used to enumerate live cells and four major cell lineages is provided. (F) An MDS plot illustrating effect of genotype (marker colors) and sex (marker shapes) on the abundance of lineage+ cells is shown. (G) The absolute abundance of lineage+ cells are shown across genotypes. (H) An atlas of 59 cellular phenotypes that can be discriminated using our SI-customized high-parameter flow cytometry approach is provided. (B, C, G) Dunnett’s Test (“all vs. WT”), ns=p>0.05, *=p<0.05, **=p<0.01, ***=p<0.001, ****=p<0.0001. (D, F) Unpaired Student’s t-test, ns=p>0.05, ****=p<0.0001. (A, H) Mouse figures created with Biorender (Biorender.com).
Figure 2
Figure 2
PAD-induced immune dysregulation is primarily associated with defects in T cell homeostasis in the small bowel. (A) PAD phenotypes and anticipated degree of immune dysregulation (size of circles) expected in mouse strains utilized in this study. Figure created with Biorender (Biorender.com). (B) The degree of immune dysregulation (i.e. divergence in immune phenotype from the WT condition) among mouse strains is shown. Dunnett’s Test (“all vs. WT”), *=p<0.05, ****=p<0.0001. (C) A representative tSNE map of cellular subsets identified using our general immunophenotyping panel is shown. (D) Density tSNE plots highlighting differences in cellular distributions among genotypes are shown (each plot is generated from concatenated events from six mice per genotype). T and B cell deficient RAG1-/- and CD4-deficient MHCII-/- mice are provided as gating controls. (E) An MDS plot illustrating immunophenotypic variation among mouse strains (left), and the relative contribution of innate versus adaptive immune responses in driving immune dysregulation (right) are shown. Mann-Whitney U test, *=p<0.05. (F) The results of response screening analysis of immune phenotypes that significantly correlate (denoted by red bars) with the degree of immune dysregulation are shown. Significance reflects results of FDR-corrected p-values from multiple linear regression analysis of all 19 general immune cell subsets.
Figure 3
Figure 3
PAD-induced immune dysregulation is associated with enhanced type I immunity and diminished iNKT cell responsiveness. (A) A representative tSNE map of identifiable conventional T cell subsets is shown. (B) Density tSNE plots highlighting differences in absolute T cell subset abundances are shown (each plot is generated from concatenated events from six mice per genotype). CD4-deficient MHCII-/- mice are provided only as gating controls. (C) Statistical comparisons of the absolute abundance of TH1, TH17, and TH2 cell between WT and PAD mice are shown. Kruskal-Wallis test, *=p<0.05, ns=p>0.05. (D) The results of response screening analysis of T cell phenotypes that significantly correlate (denoted by red bars (left panel)) with the degree of immune dysregulation are shown. Significance reflects results of FDR-corrected p-values from multiple linear regression analysis of all 10 T cell subsets (top 5 most significant correlations shown (right panel)). (E) A representative tSNE map of identifiable iNKT cell subsets is shown. (F) Density tSNE plots highlighting differences in absolute iNKT cell subset abundances are shown (each plot is generated from concatenated events from six mice). CD4-deficient MHCII-/- mice are provided only as gating controls. (G) The results of response screening analysis of iNKT cell phenotypes that significantly correlate (denoted by red bars (left panel)) with the degree of immune dysregulation are shown. Significance reflects results of FDR-corrected p-values from multiple linear regression analysis of all 10 iNKT cell subsets (top 5 most significant correlations shown (right panel)). (H) An MDS plot illustrating immunophenotypic variation among mouse strains based on T and iNKT cell phenotypes (left), and the relative contribution of effector T cell and effector iNKT cell responses in driving immune dysregulation (right) are shown. Mann-Whitney U test, ***=p<0.001. Significant correlations (FDR-corrected p-values <0.05) between T cell and iNKT cell subsets with immune dysregulation are shown.
Figure 4
Figure 4
PAD-induced immune dysregulation is associated with aberrant antigen presentation by ISCs and IECs. (A) A representative tSNE map of identifiable ISC and IEC subsets is shown. Four lineages (IEC, Paneth cells, FC ISCs, and FR ISCs) were subsequently gated based on their expression of MHCII and CD1d antigen presenting molecules. Heatmaps of MHCII and CD1d expression are provided to orient the reader to major shifts in the abundance of antigen-presenting IECs and ISCs shown in 4B. (B) Density tSNE plots highlighting differences in absolute IEC/ISC subset abundances are shown (each plot is generated from concatenated events from six mice). T and B cell deficient RAG1-/- and CD4-deficient MHCII-/- mice are provided as gating controls. (C) An MDS plot illustrating immunophenotypic variation among mouse strains based on IEC and ISC antigen-presenting phenotypes (left), and the relative contribution of differences in the absolute abundances of double-negative (CD1d-MHCII-)(DN), double-positive (CD1d+MHCII+)(DP), and single-positive (CD1d+MHCII- or CD1d-MHCII+)(SP) cell subsets in driving immune dysregulation (right) are shown. Kruskal-Wallis test, **=p<0.01, ****=p<0.0001. (D) The results of response screening analysis of immune phenotypes that significantly correlate (denoted by red bars) with the degree of immune dysregulation are shown. Significance reflects results of FDR-corrected p-values from multiple linear regression analysis of all 16 IEC/ISC subsets analyzed.
Figure 5
Figure 5
PAD-driven SI enteropathy is associated with defects in CD1d-mediated regulation of homeostatic iNKT cell responses in the small intestine. (A) Representative H&E images (20X magnification) of distal ileal sections from PAD mouse models are shown. (B) Radial plots are provided to show similarity between genders in each disease parameter. Cumulative enteropathy scores are compared between males and females. Student’s t-test, ns=p>0.05. (C) The severity of small bowel enteropathy among mouse strains is shown (upper plot). Dunnett’s Test (“all vs. WT”), **=p<0.01, ***=p<0.001. A regression analysis of relationship between immune dysregulation and disease severity is shown. ANOVA. (D) An MDS plot reflecting divergence among individuals based on their cumulative immunophenotypes is shown (left) and the relative effects of cumulative innate immune responses, adaptive immune responses, or IEC/ISC antigen presentation in driving immune dysregulation are compared (right). Kruskal-Wallis test, ***=p<0.001, ****=p<0.0001. (E) Results of predictive screening analysis of immune phenotypes that best predict IDI and disease severity scores among mouse strains are shown. The top 20 significant discriminators for each outcome (IDI or disease) are plotted with overlapping cellular phenotypes highlighted by connecting lines. “Contribution” reflects the contribution of each variable to variance among mouse strains in IDI or disease severity. (F) Stacked barplots showing the absolute abundance of antigen presenting phenotypes in IEC/ISC subsets are shown. (G) The absolute abundance of single positive cells (CD1d+MHCII- or CD1d-MHCII+) among the four IEC/ISC subsets is shown. Dunnett’s Test or Tukey’s test (“all vs. WT”), ns=p>0.05, *=p<0.05, **=p<0.01, ***=p<0.001, ****=p<0.0001. (H) A correlation matrix summarizing results of multiple linear regression analysis of relationships between IEC/ISC antigen presentation phenotypes and T cell/iNKT cell subsets identified in (E) is shown.

Update of

References

    1. Picard C, Bobby Gaspar H, Al-Herz W, Bousfiha A, Casanova JL, Chatila T, et al. . International union of immunological societies: 2017 primary immunodeficiency diseases committee report on inborn errors of immunity. J Clin Immunol. (2018) 38:96–128. doi: 10.1007/s10875-017-0464-9 - DOI - PMC - PubMed
    1. Durandy A, Kracker S, Fischer A. Primary antibody deficiencies. Nat Rev Immunol. (2013) 13:519–33. doi: 10.1038/nri3466 - DOI - PubMed
    1. Bonilla FA, Khan DA, Ballas ZK, Chinen J, Frank MM, Hsu JT, et al. . Practice parameter for the diagnosis and management of primary immunodeficiency. J Allergy Clin Immunol. (2015) 136:1186–1205.e1181-1178. doi: 10.1016/j.jaci.2015.04.049 - DOI - PubMed
    1. Smith T, Cunningham-Rundles C. Primary B-cell immunodeficiencies. Hum Immunol. (2019) 80:351–62. doi: 10.1016/j.humimm.2018.10.015 - DOI - PMC - PubMed
    1. Agarwal S, Cunningham-Rundles C. Gastrointestinal manifestations and complications of primary immunodeficiency disorders. Immunol Allergy Clin North Am. (2019) 39:81–94. doi: 10.1016/j.iac.2018.08.006 - DOI - PMC - PubMed