

Spatiotemporal Observation of Monosodium Urate Crystals Deposition in Synovial Organoids Using Label-Free Stimulated Raman Scattering
- PMID: 38803506
- PMCID: PMC11128648
- DOI: 10.34133/research.0373
Spatiotemporal Observation of Monosodium Urate Crystals Deposition in Synovial Organoids Using Label-Free Stimulated Raman Scattering
Abstract
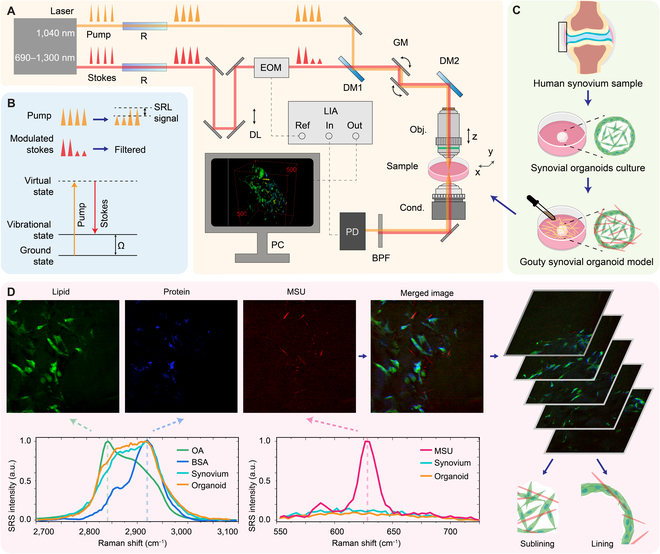
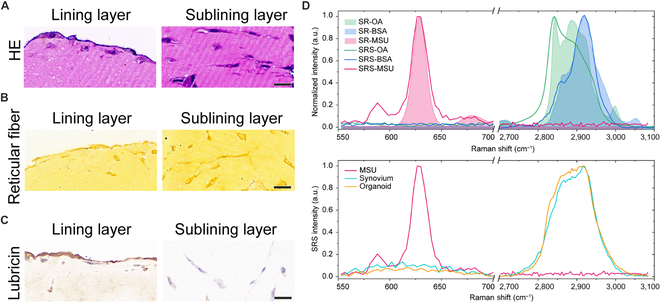
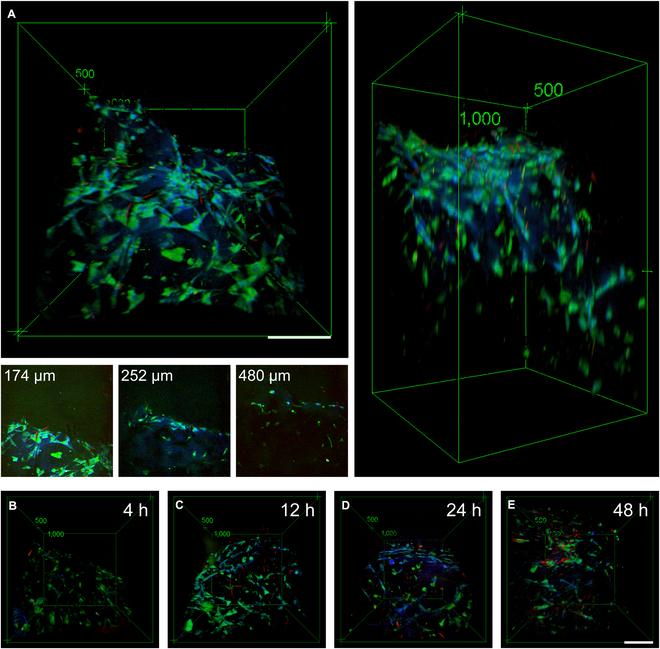
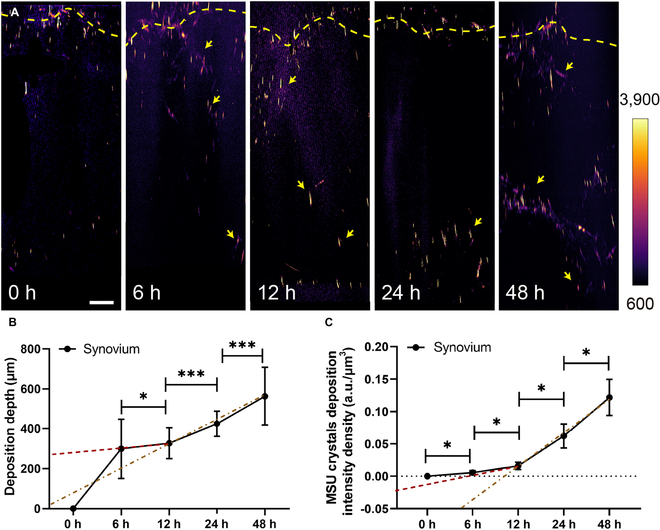
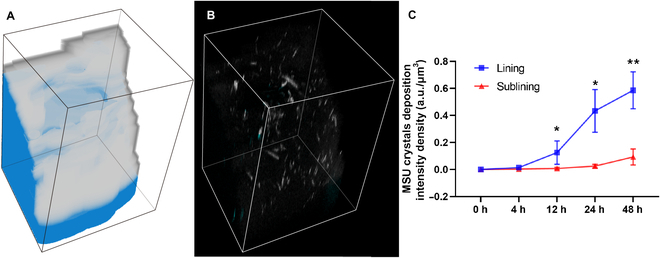
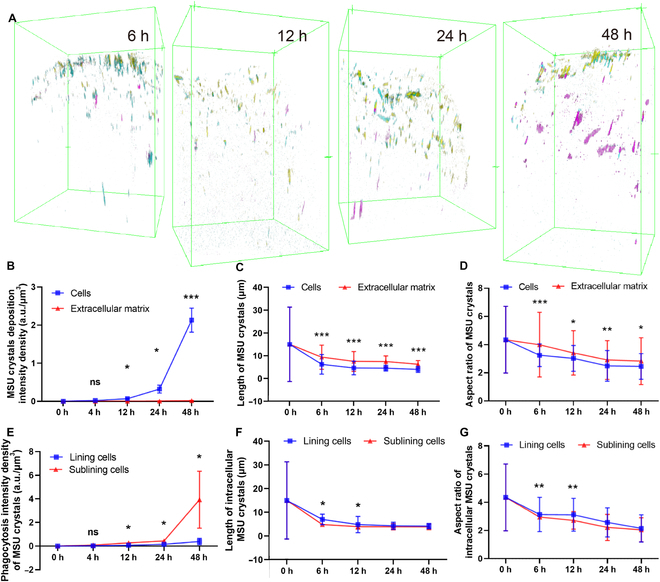
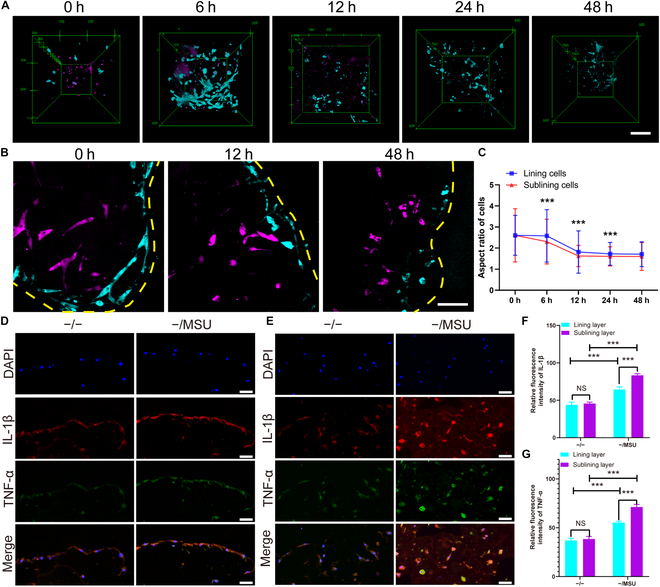
Gout, a common form of arthritis, is characterized by the deposition of monosodium urate (MSU) crystals in joints. MSU deposition in synovial tissues would initiate arthritis flares and recurrence, causing irreversible joint damage. However, the dynamic deposition of MSU crystals in tissues lacks experimental observation. In this study, we used chemical-specific, label-free stimulated Raman scattering (SRS) microscopy to investigate the spatiotemporal deposition and morphological characteristics of MSU crystals in human synovial organoids. Our findings revealed a critical 12-h window for MSU deposition in the lining layer of gouty synovium. Moreover, distinctive inflammatory reactions of the lining and sublining synovial layers in gout using SRS microscopy were further verified by immunofluorescence. Importantly, we identified a crucial proinflammatory role of sublining fibroblast-like synoviocytes, indicating a need for targeted medication treatment on these cells. Our work contributes to the fundamental understanding of MSU-based diseases and offers valuable insights for the future development of targeted gout therapies.
Copyright © 2024 Yaxin Chen et al.
Conflict of interest statement
Competing interests: The authors declare that there is no conflict of interest regarding the publication of this article.
Figures
Similar articles
-
Osteoarthritis synovium as a nidus for monosodium urate crystal deposition inducing severe gout studied by label-free stimulated Raman scattering combined with synovial organoids.MedComm (2020). 2025 Jan 5;6(1):e70040. doi: 10.1002/mco2.70040. eCollection 2025 Jan. MedComm (2020). 2025. PMID: 39764563 Free PMC article.
-
Highly specific and label-free histological identification of microcrystals in fresh human gout tissues with stimulated Raman scattering.Theranostics. 2021 Jan 1;11(7):3074-3088. doi: 10.7150/thno.53755. eCollection 2021. Theranostics. 2021. PMID: 33537075 Free PMC article.
-
Case with long-standing gout showing various ultrasonographic features caused by monosodium urate monohydrate crystal deposition.Mod Rheumatol Case Rep. 2020 Jan;4(1):110-115. doi: 10.1080/24725625.2019.1662987. Epub 2019 Sep 16. Mod Rheumatol Case Rep. 2020. PMID: 33086974
-
Recent Insights Into the Role of Macrophages in Acute Gout.Front Immunol. 2022 Jul 8;13:955806. doi: 10.3389/fimmu.2022.955806. eCollection 2022. Front Immunol. 2022. PMID: 35874765 Free PMC article. Review.
-
Urate Crystals; Beyond Joints.Front Med (Lausanne). 2021 Jun 4;8:649505. doi: 10.3389/fmed.2021.649505. eCollection 2021. Front Med (Lausanne). 2021. PMID: 34150794 Free PMC article. Review.
Cited by
-
Osteoarthritis synovium as a nidus for monosodium urate crystal deposition inducing severe gout studied by label-free stimulated Raman scattering combined with synovial organoids.MedComm (2020). 2025 Jan 5;6(1):e70040. doi: 10.1002/mco2.70040. eCollection 2025 Jan. MedComm (2020). 2025. PMID: 39764563 Free PMC article.
-
Synovial organoids: From fundamental construction to groundbreaking applications in arthritic disorders.J Orthop Translat. 2025 Jul 16;54:26-36. doi: 10.1016/j.jot.2025.07.004. eCollection 2025 Sep. J Orthop Translat. 2025. PMID: 40703569 Free PMC article. Review.
References
-
- Chen Z, Wang W, Hua Y. Metabolic regulation of immune response and tissue remodeling in gouty arthritis (review). Crit Rev Eukaryot Gene Expr. 2023;33(5):1–16. - PubMed
-
- Zamudio-Cuevas Y, Martinez-Flores K, Fernandez-Torres J, Loissell-Baltazar YA, Medina-Luna D, Lopez-Macay A, Camacho-Galindo J, Hernandez-Diaz C, Santamaria-Olmedo MG, Lopez-Villegas EO, et al. . Monosodium urate crystals induce oxidative stress in human synoviocytes. Arthritis Res Ther. 2016;18(1):117. - PMC - PubMed
-
- Tao H, Mo Y, Liu W, Wang H. A review on gout: Looking back and looking ahead. Int Immunopharmacol. 2023;117:109977. - PubMed
-
- Dalbeth N, Choi HK, Joosten LAB, Khanna PP, Matsuo H, Perez-Ruiz F, Stamp LK. Gout. Nat Rev Dis Primers. 2019;5(1):69. - PubMed
LinkOut - more resources
Full Text Sources
