. 2024 May 22;2024(3):hoae028.
doi: 10.1093/hropen/hoae028. eCollection 2024.

Effects of chemical in vitro activation versus fragmentation on human ovarian tissue and follicle growth in culture

Affiliations

Effects of chemical in vitro activation versus fragmentation on human ovarian tissue and follicle growth in culture

Jie Hao et al. Hum Reprod Open. .

Abstract

Study question: What is the effect of the chemical in vitro activation (cIVA) protocol compared with fragmentation only (Frag, also known as mechanical IVA) on gene expression, follicle activation and growth in human ovarian tissue in vitro?

Summary answer: Although histological assessment shows that cIVA significantly increases follicle survival and growth compared to Frag, both protocols stimulate extensive and nearly identical transcriptomic changes in cultured tissue compared to freshly collected ovarian tissue, including marked changes in energy metabolism and inflammatory responses.

What is known already: Treatments based on cIVA of the phosphatase and tensin homolog (PTEN)-phosphatidylinositol 3-kinase (PI3K) pathway in ovarian tissue followed by auto-transplantation have been administered to patients with refractory premature ovarian insufficiency (POI) and resulted in live births. However, comparable effects with mere tissue fragmentation have been shown, questioning the added value of chemical stimulation that could potentially activate oncogenic responses.

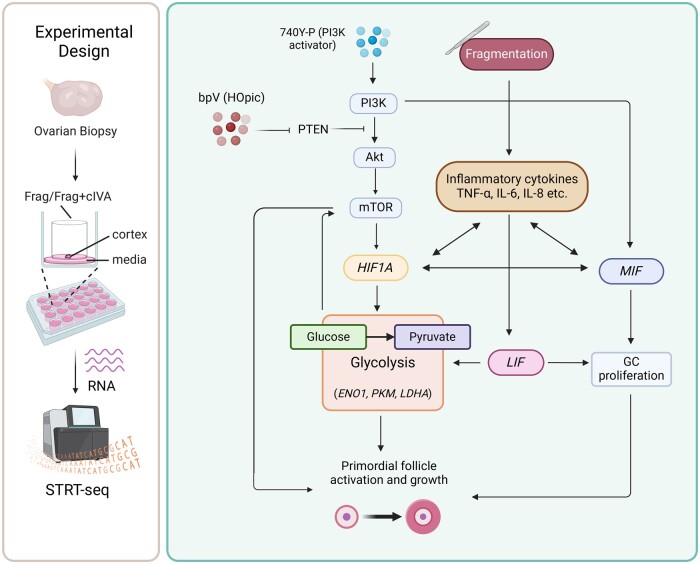
Study design size duration: Fifty-nine ovarian cortical biopsies were obtained from consenting women undergoing elective caesarean section (C-section). The samples were fragmented for culture studies. Half of the fragments were exposed to bpV (HOpic)+740Y-P (Frag+cIVA group) during the first 24 h of culture, while the other half were cultured with medium only (Frag group). Subsequently, both groups were cultured with medium only for an additional 6 days. Tissue and media samples were collected for histological, transcriptomic, steroid hormone, and cytokine/chemokine analyses at various time points.

Participants/materials setting methods: Effects on follicles were evaluated by counting and scoring serial sections stained with hematoxylin and eosin before and after the 7-day culture. Follicle function was assessed by quantification of steroids by ultra-performance liquid chromatography tandem-mass spectrometry at different time points. Cytokines and chemokines were measured by multiplex assay. Transcriptomic effects were measured by RNA-sequencing (RNA-seq) of the tissue after the initial 24-h culture. Selected differentially expressed genes (DEGs) were validated by quantitative PCR and immunofluorescence in cultured ovarian tissue as well as in KGN cell (human ovarian granulosa-like tumor cell line) culture experiments.

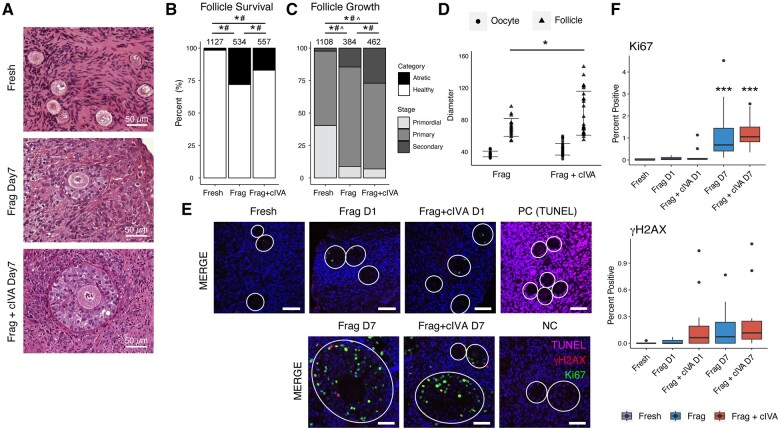
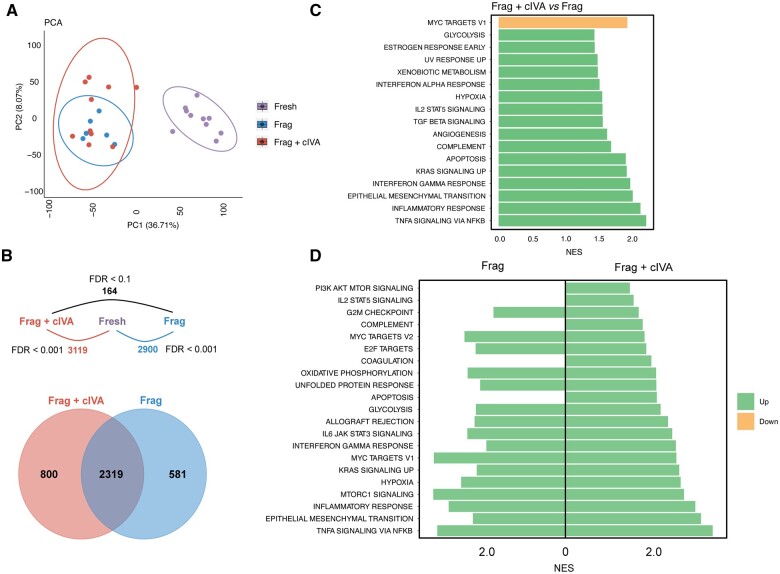
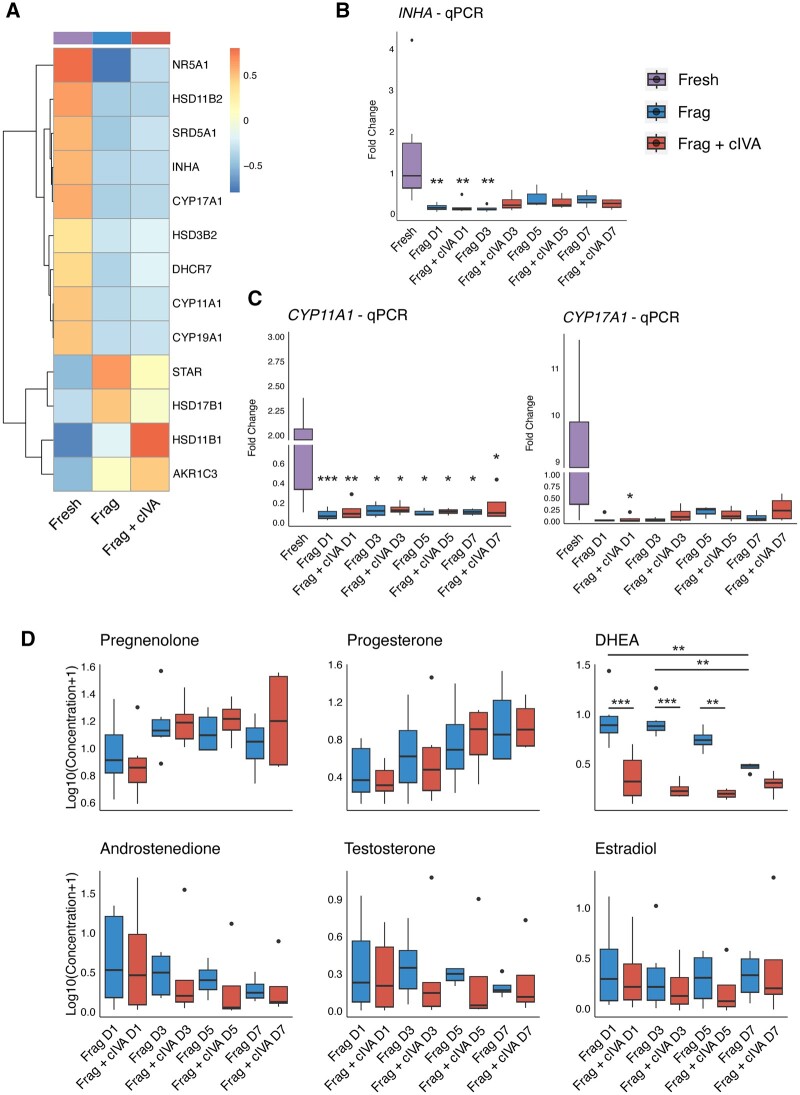
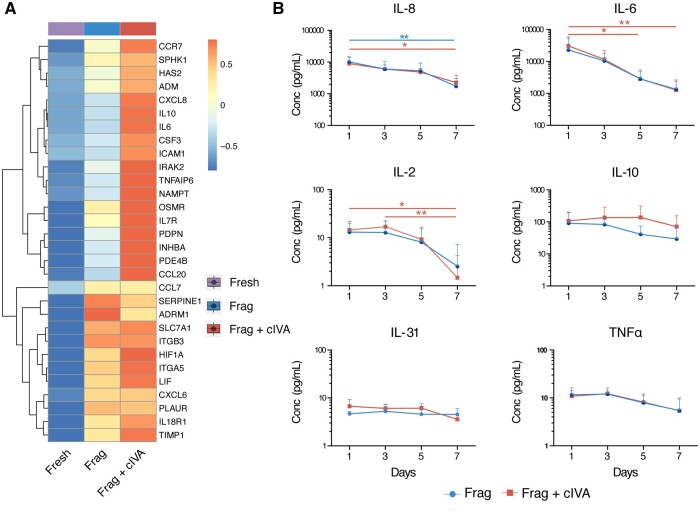
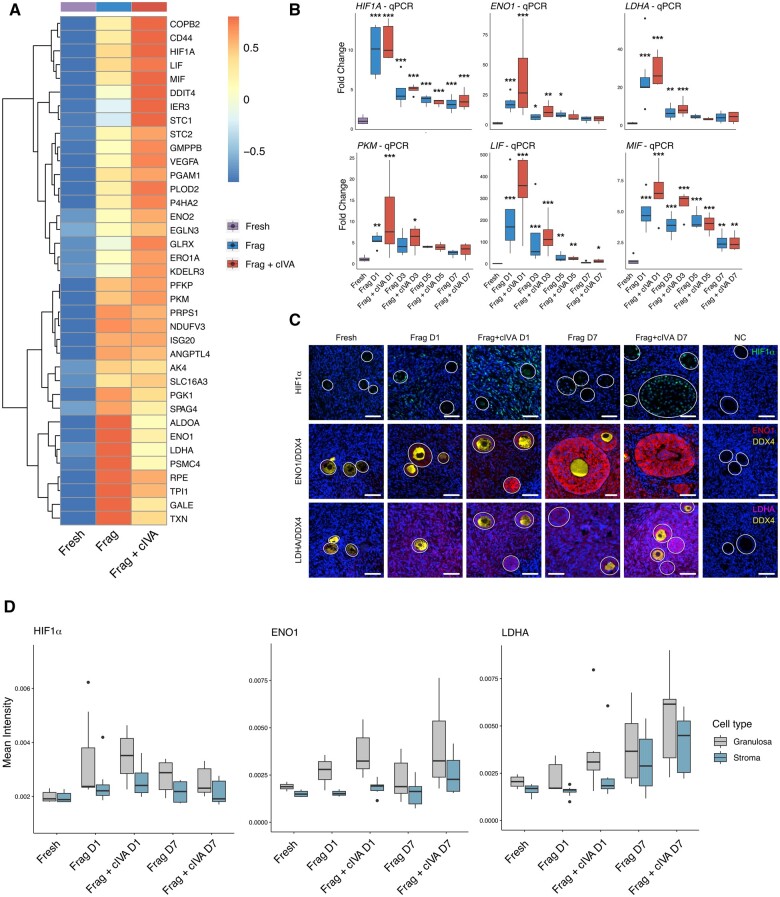
Main results and the role of chance: Compared to the Frag group, the Frag+cIVA group exhibited a significantly higher follicle survival rate, increased numbers of secondary follicles, and larger follicle sizes. Additionally, the tissue in the Frag+cIVA group produced less dehydroepiandrosterone compared to Frag. Cytokine measurement showed a strong inflammatory response at the start of the culture in both groups. The RNA-seq data revealed modest differences between the Frag+cIVA and Frag groups, with only 164 DEGs identified using a relaxed cut-off of false discovery rate (FDR) <0.1. Apart from the expected PI3K-protein kinase B (Akt) pathway, cIVA also regulated pathways related to hypoxia, cytokines, and inflammation. In comparison to freshly collected ovarian tissue, gene expression in general was markedly affected in both the Frag+cIVA and Frag groups, with a total of 3119 and 2900 DEGs identified (FDR < 0.001), respectively. The top enriched gene sets in both groups included several pathways known to modulate follicle growth such as mammalian target of rapamycin (mTOR)C1 signaling. Significant changes compared to fresh tissue were also observed in the expression of genes encoding for steroidogenesis enzymes and classical granulosa cell markers in both groups. Intriguingly, we discovered a profound upregulation of genes related to glycolysis and its upstream regulator in both Frag and Frag+cIVA groups, and these changes were further boosted by the cIVA treatment. Cell culture experiments confirmed glycolysis-related genes as direct targets of the cIVA drugs. In conclusion, cIVA enhances follicle growth, as expected, but the mechanisms may be more complex than PI3K-Akt-mTOR alone, and the impact on function and quality of the follicles after the culture period remains an open question.

Large scale data: Data were deposited in the GEO data base, accession number GSE234765. The code for sequencing analysis can be found in https://github.com/tialiv/IVA_project.

Limitations reasons for caution: Similar to the published IVA protocols, the first steps in our study were performed in an in vitro culture model where the ovarian tissue was isolated from the regulation of hypothalamic-pituitary-ovarian axis. Further in vivo experiments will be needed, for example in xeno-transplantation models, to explore the long-term impacts of the discovered effects. The tissue collected from patients undergoing C-section may not be comparable to tissue of patients with POI.

Wider implications of the findings: The general impact of fragmentation and short (24 h) in vitro culture on gene expression in ovarian tissue far exceeded the effects of cIVA. Yet, follicle growth was stimulated by cIVA, which may suggest effects on specific cell populations that may be diluted in bulk RNA-seq. Nevertheless, we confirmed the impact of cIVA on glycolysis using a cell culture model, suggesting impacts on cellular signaling beyond the PI3K pathway. The profound changes in inflammation and glycolysis following fragmentation and culture could contribute to follicle activation and loss in ovarian tissue culture, as well as in clinical applications, such as fertility preservation by ovarian tissue auto-transplantation.

Study funding/competing interests: This study was funded by research grants from European Union's Horizon 2020 Research and Innovation Programme (Project ERIN No. 952516, FREIA No. 825100), Swedish Research Council VR (2020-02132), StratRegen funding from Karolinska Institutet, KI-China Scholarship Council (CSC) Programme and the Natural Science Foundation of Hunan (2022JJ40782). International Iberian Nanotechnology Laboratory Research was funded by the European Union's H2020 Project Sinfonia (857253) and SbDToolBox (NORTE-01-0145-FEDER-000047), supported by Norte Portugal Regional Operational Programme (NORTE 2020), under the PORTUGAL 2020 Partnership Agreement, through the European Regional Development Fund. No competing interests are declared.

Keywords: fertility preservation; follicle development; gene expression; ovary; primary ovarian insufficiency.


Conflict of interest statement

The authors have no relevant financial or non-financial interests to disclose.

Figures

Figure 1.
Figure 1.
Follicle survival and growth in human ovarian cortex cultured with and without chemical in vitro activation at different time points. Ovarian cortical tissue fragments from 33 women were cultured for a total of 7 days with half of the samples treated with cIVA protocol during the first 24 h. (A) Representative histological images of follicles in fresh, Frag, and Frag+cIVA group after 7-day culture. Scale bars 50 µm. (B) Follicle survival and (C) growth in fresh, Frag, and Frag+cIVA groups at the end of the 7-day culture (*P < 0.05, # P < 0.05, ^ P < 0.05 fresh versus Frag versus Frag+cIVA, chi-square test with Bonferroni’s correction). The total number of follicles is indicated above the bars. In Figure 1B, the asterisk (*) represents statistics for atretic follicles while the hashtag (#) indicates statistics for healthy follicles. In Figure 1C, the asterisk (*) represents statistics for secondary follicles, hashtag (#) for primary, and circumflex (^) for primordial. (D) Comparison of the diameter of the oocyte from the secondary follicle and follicle diameters (*P < 0.05, Student’s t-test) in the Frag and Frag+cIVA groups after 7-day culture. (E) Detection of DNA damage and proliferation by TUNEL and immunofluorescence staining of γH2AX and Ki67 in fresh tissue and in Frag and Frag+cIVA groups on Days 1 and 7 of culture. Dark blue indicates DAPI; green Ki67; red γH2AX; and magenta TUNEL. Scale bars 50 µm. Follicles are indicated with white circles. Images were processed using OMERO.figure and are presented under the same scale of brightness and contrast. (F) Quantification of the percentage of cells positive for Ki67 and γH2AX staining in fresh, Frag, and Frag+cIVA group on fresh, Day 1, and Day 7 samples. Statistics were performed using two-way ANOVA with interaction and Tukey’s correction after log2 transformation in RStudio. Asterisks represent the comparison between groups. *P < 0.05, ***P < 0.001. cIVA, chemical in vitro activation; Frag, fragmentation; NC, negative control; PC, positive control; TUNEL, terminal deoxynucleotidyl transferase dUTP nick end labeling.
Figure 2.
Figure 2.
Overview of transcriptomic changes in human ovarian cortex cultured with or without chemical in vitro activation. Ovarian cortical tissue fragments from 11 women were cultured for a total of 24 h with half of the samples treated with the cIVA protocol. The fragments were collected for transcriptomic profiling by RNA-seq. (A) PCA of the RNA-seq data using all expressed genes. (B) Number of DEGs between the different comparisons, and a Venn diagram showing the overlap in genes altered in culture in the Frag+cIVA and Frag groups compared to the fresh samples. The used FDR cut-off to determine DEGs is indicated. (C) Barplot displaying selected significantly enriched hallmark gene sets from GSEA analysis using all expressed genes in Frag versus Frag+cIVA comparison (FDR < 0.1). (D) Barplot showing selected significantly enriched hallmark gene sets from GSEA analysis using significant DEGs in Frag versus fresh and Frag+cIVA versus fresh comparisons (FDR<0.1). The normalized enrichment score (NES) is presented on the x-axis. cIVA, chemical in vitro activation; DEGs, differentially expressed genes; FDR, false discovery rate; Frag, fragmentation; GSEA, gene set enrichment analysis; NES, normalized enrichment score; PCA, principal component analysis.
Figure 3.
Figure 3.
Changes in steroidogenesis during human ovarian cortical tissue culture in fragmentation and fragmentation+chemical in vitro activation groups. Ovarian cortical tissue fragments from 15 women were cultured for a total of 7 days with half of the samples exposed to the cIVA protocol. Fragments and culture media were collected for analyses on Days 1, 3, 5, and 7. (A) Clustered heatmap of average expression of steroidogenesis-related genes at 24 h in the RNA-seq data. Data were normalized with DESeq2 normalization and scaled to obtain mean equal to 0 and SD equal to 1. Color bar above the heatmap represents the group. (B) Results of INHA and (C) CYP11A1 and CYP17A1 expression by quantitative PCR in fresh, Day 1, Day 3, Day 5, and Day 7-cultured tissue, normalized to the housekeeping gene RPL22. (D) Log10-transformed levels of pregnenolone, progesterone, DHEA, androstenedione, testosterone, and estradiol during the 7-day culture. Results are presented as boxplots where the box represents the interquartile range, the horizontal line denotes the median, whiskers mark the non-outlier range, and outliers are depicted as dots. Statistics were performed using two-way ANOVA with interaction and Tukey’s post hoc correction after data was log2- (qPCR) and log10-transformed (steroids) in RStudio. Asterisks represent the comparison between fresh and each culture group. *P < 0.05, **P < 0.01, ***P < 0.001. cIVA, chemical in vitro activation; CYP11A1, cytochrome P450 family 11 subfamily A member 1; CYP17A1, cytochrome P450 family 17 subfamily A member 1; DHEA, dehydroepiandrosterone; Frag, fragmentation; INHA, inhibin subunit alpha; qPCR, quantitative PCR; RPL22, ribosomal protein L22.
Figure 4.
Figure 4.
Changes of cytokines and chemokines during human ovarian cortical tissue culture in fragmentation and fragmentation+chemical in vitro activation groups. (A) Clustered heatmap of average expression of inflammatory response-related genes at 24 h in the RNA-seq data. Data was normalized with DESeq2 normalization and scaled to obtain mean equal to 0 and SD equal to 1. Color bar above the heatmap represents the group (n = 11). (B) Ovarian cortical tissue fragments from three women were cultured for a total of 7 days with half of the samples exposed to the cIVA protocol. Concentrations of IL-8, IL-6, IL-31, IL-2, IL-10, and TNFα were measured in culture media collected on Days 1, 3, 5, and 7 of culture, shown as average (+SD). Statistics were performed using two-way ANOVA with interaction and Tukey’s post hoc correction in RStudio. No significant differences were observed between Frag+cIVA and Frag at any time point. Blue line represents statistical comparison within the Frag group while red represents the Frag+cIVA group. Blue dot represents the Frag group and red square represents the Frag+cIVA group. *P < 0.05, **P < 0.01. cIVA, chemical in vitro activation; Conc, concentration; Frag, fragmentation; TNFα, tumor necrosis factor alpha.
Figure 5.
Figure 5.
Upregulation of glycolysis-related genes in human ovarian tissue during in vitro culture. Ovarian cortical tissue from 11 women was cultured for 24 h for RNA-seq, and from 15 women for 7 days for validation experiments by qPCR and immunostainings. (A) Clustered heatmap of average expression of glycolysis-related genes at 24 h in the RNA-seq data. Data was normalized with DESeq2 normalization and scaled to obtain mean equal to 0 and SD equal to 1. Color bar above the heatmap represents the group. (B) qPCR results of HIF1A, ENO1, LDHA, PKM, LIF, and MIF, normalized to RPL22, on Day 1, Day 3, Day 5, Day 7 of culture and in freshly collected tissues. (C) Immunostaining of DDX4, HIF1α, LDHA, and ENO1 in fresh, Day 1, and Day 7 of Frag and Frag+cIVA groups. Isotype control (IgG) was used as the negative control. Dark blue represents DAPI signal; green indicates HIF1α; red ENO1; yellow DDX4; and magenta LDHA. Scale bars 50 µm. All figures are presented under the same scale of brightness and contrast. Figures were processed using OMERO.figure. (D) Quantification of immunofluorescence intensity of HIF1α, ENO1, and LDHA in granulosa and stroma cells. Gray indicates signals in granulosa cells while blue represents signals in stroma. Results are presented as boxplots where the box represents the interquartile range, the line denotes the median, whiskers mark the non-outlier range, and outliers are depicted as dots. Statistics were performed using two-way ANOVA with interaction and Tukey’s post hoc correction after data was log2-transformed in RStudio. *P < 0.05, **P < 0.01, ***P < 0.001. cIVA, chemical in vitro activation; DDX4, DEAD-box helicase 4; ENO1, alpha-enolase; Frag, fragmentation; HIF1A/HIF1α, hypoxia inducible factor 1 subunit alpha; LDHA, lactate dehydrogenase A; LIF, leukemia inhibitory factor; MIF, macrophage migration inhibitory factor; NC, negative control; PKM, pyruvate kinase M1/2; qPCR, quantitative PCR; RPL22, ribosomal protein L22.
Figure 6.
Figure 6.
Working model of putative pathways involved in mediating effects of fragmentation and fragmentation+chemical in vitro activation on cultured human ovarian tissue. Fragmentation of tissue promotes the production of inflammatory cytokines, MIF, LIF, and glycolysis-related genes ENO1, PKM, and LDHA, contributing to primordial follicle activation. In the context of Frag+cIVA, activation of PI3K–Akt–mTOR signaling results in the upregulation of the downstream targets that include HIF1A, MIF, and LIF, which enhance the expression of glycolysis-related genes and granulosa cells proliferation. These mechanisms contribute to the growth activation of primordial follicles in culture. Akt, protein kinase B; bpV (HOpic), bisperoxovanadium (HOpic); cIVA, chemical in vitro activation; ENO1, alpha-enolase; Frag, fragmentation; HIF1A, hypoxia inducible factor 1 subunit alpha; GC, granulosa cells; LDHA, lactate dehydrogenase A; LIF, leukemia inhibitory factor; MIF, macrophage migration inhibitory factor; mTOR, mammalian target of rapamycin; PI3K, phosphoinositide 3 kinase; PTEN, phosphatase and tensin homolog; STRT-seq, single-cell tagged reverse transcription sequencing; TNF-α, tumor necrosis factor alpha.

References

    1. Adhikari D, Gorre N, Risal S, Zhao Z, Zhang H, Shen Y, Liu K. The safe use of a PTEN inhibitor for the activation of dormant mouse primordial follicles and generation of fertilizable eggs. PLoS One 2012;7:e39034. - PMC - PubMed
    1. Adhikari D, Liu K. Molecular mechanisms underlying the activation of mammalian primordial follicles. Endocr Rev 2009;30:438–464. - PubMed
    1. Aittomäki K, Herva R, Stenman UH, Juntunen K, Ylöstalo P, Hovatta O, la CAd Clinical features of primary ovarian failure caused by a point mutation in the follicle-stimulating hormone receptor gene. J Clin Endocrinol Metab 1996;81:3722–3726. - PubMed
    1. Andersen CL, Jensen JL, Ørntoft TF. Normalization of real-time quantitative reverse transcription-PCR data: a model-based variance estimation approach to identify genes suited for normalization, applied to bladder and colon cancer data sets. Cancer Res 2004;64:5245–5250. - PubMed
    1. Benigni F, Atsumi T, Calandra T, Metz C, Echtenacher B, Peng T, Bucala R. The proinflammatory mediator macrophage migration inhibitory factor induces glucose catabolism in muscle. J Clin Invest 2000;106:1291–1300. - PMC - PubMed