. 2024 Jun 1;17(6):dmm050574.
doi: 10.1242/dmm.050574. Epub 2024 Jul 2.

ATP1A3 regulates protein synthesis for mitochondrial stability under heat stress

Affiliations

ATP1A3 regulates protein synthesis for mitochondrial stability under heat stress

Fumihiko Fujii et al. Dis Model Mech. .

Abstract

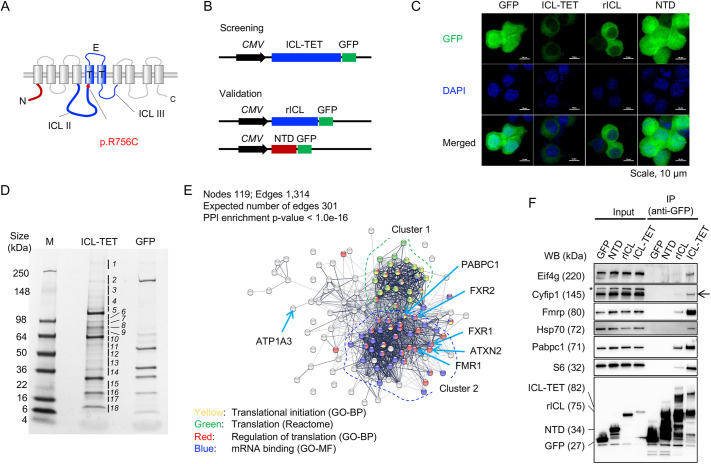
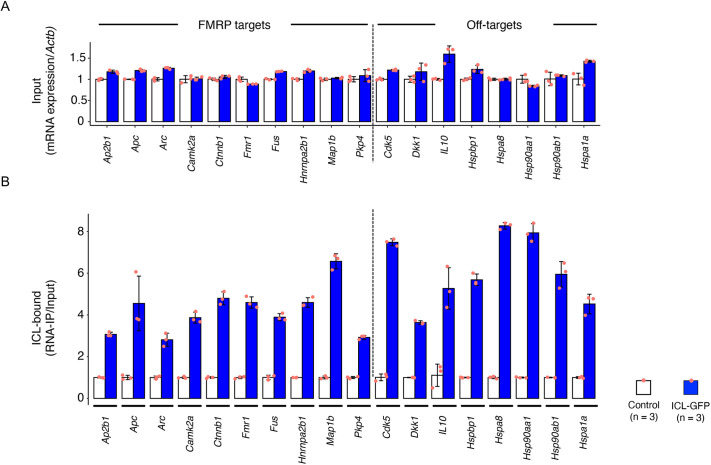
Pathogenic variants in ATP1A3, the gene encoding the α3 subunit of the Na+/K+-ATPase, cause alternating hemiplegia of childhood (AHC) and related disorders. Impairments in Na+/K+-ATPase activity are associated with the clinical phenotype. However, it remains unclear whether additional mechanisms are involved in the exaggerated symptoms under stressed conditions in patients with AHC. We herein report that the intracellular loop (ICL) of ATP1A3 interacted with RNA-binding proteins, such as Eif4g (encoded by Eif4g1), Pabpc1 and Fmrp (encoded by Fmr1), in mouse Neuro2a cells. Both the siRNA-mediated depletion of Atp1a3 and ectopic expression of the p.R756C variant of human ATP1A3-ICL in Neuro2a cells resulted in excessive phosphorylation of ribosomal protein S6 (encoded by Rps6) and increased susceptibility to heat stress. In agreement with these findings, induced pluripotent stem cells (iPSCs) from a patient with the p.R756C variant were more vulnerable to heat stress than control iPSCs. Neurons established from the patient-derived iPSCs showed lower calcium influxes in responses to stimulation with ATP than those in control iPSCs. These data indicate that inefficient protein synthesis contributes to the progressive and deteriorating phenotypes in patients with the p.R756C variant among a variety of ATP1A3-related disorders.

Keywords: Alternating hemiplegia of childhood; Heat stress; Induced pluripotent stem cells (iPSCs); Interaction; Mitochondria; Na+/K+-ATPase α3 subunit (ATP1A3); Protein synthesis.


Conflict of interest statement

Competing interests The authors declare no competing or financial interests.

Figures

Fig. 1.
Fig. 1.
The intracellular loop of ATP1A3 interacts with regulators of cap-dependent translation. (A) Location of the functional domains and the R756C mutation in ATP1A3. The N-terminal domain (NTD, red), the second and the third intracellular loops (ICL II and III), transmembrane domains (‘T’, columns) and extracellular loop (‘E’) are shown in the schematic. Blue lines indicate the ICL-T-E-T (TET) region expressed in Neuro2a cells (used for proteomic screening). The thick blue line represents the refined ICL II domain (rICL; used for validation study). (B) Design of the plasmid expressing the ICL-TET-GFP (top), rICL-GFP (middle) and NTD-GFP (bottom) fusion proteins. ICL-TET-GFP was used for the initial proteomic study (screening) and the plasmids expressing rICL-GFP and NTD-GFP were used for the validation study. (C) Confocal microscopy image of Neuro2a cells expressing GFP, ICL-TET-GFP, rICL-GFP and NTD-GFP. (D) Coomassie Brilliant Blue staining of proteins co-immunoprecipitated with GFP and ICL-TET-GFP in Neuro2a cells. The indicated protein bands (1-18) were subjected to mass spectrometry. M, marker. (E) Interaction network for ATP1A3 (ICL-TET-GFP)-binding proteins. Gray and colored nodes represent the ICL-TET-GFP-binding proteins identified in this study. Clusters 1 and 2 (green and blue dashed lines) were enriched in distinctive categories of protein functions according to the Gene Ontology (GO), Reactome and KEGG databases. PPI, protein-protein interaction. (F) Western blotting (WB) for proteins co-immunoprecipitated with GFP, NTD-GFP rICL-GFP or ICL-TET-GFP. Asterisks, non-specific bands; arrow, CYFIP1 signal (145 kDa). Immunofluorescence images and western blots are representative of three independent experiments.
Fig. 2.
Fig. 2.
The intracellular loop of ATP1A3 forms a non-selective ribonucleoprotein complex. (A) Quantitative PCR for RNAs extracted from Neuro2a cells expressing either GFP (white) or ICL-TET-GFP (blue). (B) Quantitative PCR of the RNA-immunoprecipitated samples. Anti-GFP (clone #RQ2) bead-bound RNAs were subjected to the analysis. For panels A and B, ten genes were selected from the known targets of FMRP for translational regulation, and eight off-target genes were chosen (reference). Data are shown as the mean±s.d. Dots indicate individual data (n=3 for each group). Actb was used as the internal control. The quantitative results were adjusted for the expression level of each gene (input, panel A). mRNA levels detected by RNA immunoprecipitation were normalized to total mRNA expression levels (RNA-IP/input), and the mean RNA-IP/input value for GFP-bound RNAs was set to 1 (white bars, panel B). Blue bars indicate enrichment of ICL-TET-GFP-bound RNAs.
Fig. 3.
Fig. 3.
siRNA-mediated silencing of Atp1a3 in Neuro2a cells impairs the expression of multiple proteins and cell proliferation. (A) Relative mRNA expression of Atp1a3 to Actb (internal control) in Neuro2a cells. **P<0.01 (three independent experiments, two-tailed paired t-test). Bars show mean values. (B,C) Western blotting (WB) for the indicated proteins. Neuro2a cells were treated with control siRNA (lanes 1-4) or siAtp1a3 (lanes 5-8). Lanes represent four independent replicates. (D) Quantification of protein levels shown in B,C. Dots indicate intensities for individual protein bands in arbitrary units (AU). NS, not significant; *P<0.05; **P<0.01 (control versus siAtp1a3; Wilcoxon's rank sum test). (E) Cell cycle analysis by flow cytometry. Panels show representative plots for the fluorescence intensity of 7-AAD (x-axis) and FITC-labeled BrdU (y-axis). Live cells in the G0/G1, S and G2/M phases (rectangles) and dead cells in the sub-G1 phase (polygons) were gate selected. (F) Schematic of heat treatment (42°C for 5 min) and the time point of the analysis (6 h after heat treatment). (G) Box-dot plots show the percentages of Neuro2a cells in the indicated fractions (sub-G1, G0/G1, S and G2/M phases). The data are summarized for each group with (+) or without (−) heat treatment. *P<0.05 (Tukey's HSD test). Boxes in D,G show the interquartile range, whiskers show the the range of minimum to maximum values, and the median is marked with a line.
Fig. 4.
Fig. 4.
Susceptibility to heat stress and mitochondrial vulnerability of Atp1a3-depleted Neuro2a cells. (A) MTS assays for control (gray) and siAtp1a3-treated (red) Neuro2a cells before and after heat stress (42°C for 0.5-2 h). *P<0.05; **P<0.01 (two-way ANOVA). (B) Flow cytometry analysis of Neuro2a cells with JC-1 staining. The relative populations of energized (red) and depolarized (green) mitochondria are shown. (C) Quantitative JC-1 staining data at each time point after heat treatment. The mean±s.d. values are plotted on a line. *P<0.05; **P<0.01; ***P<0.001 (Tukey's HSD test). (D) Immunofluorescence analysis of control and siAtp1a3-treated cells. Arrowheads point to cells with aggregates of Parkin (encoded by Prkn) conjugated to EGFP (green) colocalizing with Tom20 (encoded by Tomm20, red) signals (red). (E) Quantification of cells positive for mitochondrial parkin localization, as shown in D. ***P<0.001 (Wilcoxon's rank sum test). Boxes in A,E show the interquartile range, whiskers show the range of minimum to maximum values, and the median is marked with a line. In B,D,E: No Tx, no treatment; CCCP+, carbonyl cyanide m-chlorophenyl hydrazone treatment; Heat, heat treatment at 42°C for 5 min. Treatments are shown above each panel.
Fig. 5.
Fig. 5.
Heat vulnerability of Neuro2a cells expressing the pathogenic variant p.R756C. (A) Neuro2a cells were mock transfected (no DNA) or transfected with plasmids expressing tdTomato-tagged wild-type (WT) ATP1A3 or p.R756C variant ATP1A3 and heat treated at 42°C for 5 min. Lysates were collected just before heat treatment (0 h) 1, 3 and 6 h after heat treatment and subjected to western blotting. Both tdTomato-tagged human ATP1A3 and endogenous mouse Atp1a3 were detected using an anti-ATP1A3 antibody. Images are representative of three independent experiments. (B) Cell cycle analysis of Neuro2a cells expressing WT and p.R756C variant-ATP1A3. Gated areas indicate cells in the G0/G1, S and G2/M phases (rectangles) and those in the sub-G1 phase (polygons). (C) Box-dot plots show the percentages of Neuro2a cells in the indicated fractions (sub-G1, G0/G1, S and G2/M phases). The data are summarized for each group with (+) or without (−) heat treatment. Boxes show the interquartile range, whiskers show the range of minimum to maximum values, and the median is marked with a line. *P<0.05; **P<0.01; ***P<0.001 (Tukey's HSD test).
Fig. 6.
Fig. 6.
Susceptibility of patient-derived undifferentiated iPSCs to heat stress. (A) Schematic of heat stress (42°C for 5 min) and time points of data acquisition (0-6 h) for iPSCs. (B) Western blotting of iPSCs from a healthy control (HC) and a patient with the p.R756C variant in ATP1A3. The time points of the analysis are indicated above each lane. (C) Quantification of relative ATP1A3 protein levels over time. Mean±s.d. values are plotted on a line. Individual data are shown as dots. ***P<0.001 (two-way ANOVA). (D) Cell cycle analysis of iPSCs from the HC and patient with the p.R756C variant of ATP1A3. Rectangles indicate iPSCs in the sub-G1, G0/G1, S and G2/M phases before (−) and after (+) heat treatment. The incorporated signals of 7AAD (x-axis) and FITC-labelled BrdU (y-axis) are shown. (E) Box-dot plots show the percentages of Neuro2a cells in the indicated fractions (sub-G1, G0/G1, S and G2/M phases; n=3 for each group). The data are summarized for each group with (+) or without (−) heat treatment. Boxes show the interquartile range, whiskers show the range of minimum to maximum values, and the median is marked with a line. *P<0.05; **P<0.01; ***P<0.001 (Tukey's HSD test).
Fig. 7.
Fig. 7.
Morphological and functional analyses of monolayer neurons differentiated from iPSCs. (A) Immunofluorescence of monolayer neurons from healthy control (HC) and patient (PT) iPSCs with the p.R756C variant in ATP1A3. Confocal images show immunolabelled proteins in multicolor channels. Images are representative of three independent experiments. (B) Box-dot plots show the quantitative results for the number of neurites per cell (soma). MAP2 signals were used for the morphological analysis. ***P<0.001 (Wilcoxon's rank sum test). (C) Fluo-4 images before (0 s) and 30-120 s after stimulation with 100 µM ATP of monolayer neurons from HC and PT iPSCs. The color scale indicates low-to-high amplitudes of increased calcium ion levels in neurons. Images are representative of three independent experiments. (D) Quantification of the results shown in C (n=8 regions of interest in each group). Box-dot plots show the levels of peak amplitude after stimulation in arbitrary units (AU) (left), duration from peak to 50% Fluo-4 signal (T1/2, middle) and oscillating frequency of Fluo-4 signals under basal conditions (right). ***P<0.001 (Wilcoxon's rank sum test). Boxes in B,D show the interquartile range, whiskers show the range of minimum to maximum values, and the median is marked with a line.
Fig. 8.
Fig. 8.
A theoretical model for ATP1A3-related vulnerability to heat stress. ATP1A3 supports efficient RNA translation and the expression of heat shock proteins (HSPs) after heat treatment. The pathogenic variant of ATP1A3 (p.R756C) impairs these processes, leading to the restricted expression of Hsp70 and other molecular chaperones. The insufficient expression of HSPs cannot sustain mitochondrial inner membrane potential (ΔΨm) and the expression levels of ATP1A3. The feed-forward loop represents the high-risk condition of patients with ATP1A3-related diseases for exaggeration and deterioration under stress conditions.

Similar articles

Cited by

References

    1. Akamine, S., Okuzono, S., Yamamoto, H., Setoyama, D., Sagata, N., Ohgidani, M., Kato, T. A., Ishitani, T., Kato, H., Masuda, K.et al. (2020). GNAO1 organizes the cytoskeletal remodeling and firing of developing neurons. FASEB J. 34, 16601-16621. 10.1096/fj.202001113R - DOI - PubMed
    1. Arystarkhova, E., Haq, I. U., Luebbert, T., Mochel, F., Saunders-Pullman, R., Bressman, S. B., Feschenko, P., Salazar, C., Cook, J. F., Demarest, S.et al. (2019). Factors in the disease severity of ATP1A3 mutations: Impairment, misfolding, and allele competition. Neurobiol. Dis. 132, 104577. 10.1016/j.nbd.2019.104577 - DOI - PMC - PubMed
    1. Arystarkhova, E., Ozelius, L. J., Brashear, A. and Sweadner, K. J. (2021). Misfolding, altered membrane distributions, and the unfolded protein response contribute to pathogenicity differences in Na,K-ATPase ATP1A3 mutations. J. Biol. Chem. 296, 100019. 10.1074/jbc.RA120.015271 - DOI - PMC - PubMed
    1. Arystarkhova, E., Toustrup-Jensen, M. S., Holm, R., Ko, J. K., Lee, K. E., Feschenko, P., Ozelius, L. J., Brashear, A., Vilsen, B. and Sweadner, K. J. (2023). Temperature instability of a mutation at a multidomain junction in Na,K-ATPase isoform ATP1A3 (p.Arg756His) produces a fever-induced neurological syndrome. J. Biol. Chem. 299, 102758. 10.1016/j.jbc.2022.102758 - DOI - PMC - PubMed
    1. Barwe, S. P., Anilkumar, G., Moon, S. Y., Zheng, Y., Whitelegge, J. P., Rajasekaran, S. A. and Rajasekaran, A. K. (2005). Novel role for Na,K-ATPase in phosphatidylinositol 3-kinase signaling and suppression of cell motility. Mol. Biol. Cell 16, 1082-1094. 10.1091/mbc.e04-05-0427 - DOI - PMC - PubMed

LinkOut - more resources