

Construction of an immune-related prognostic model and potential drugs screening for esophageal cancer based on bioinformatics analyses and network pharmacology
- PMID: 38804848
- PMCID: PMC11131936
- DOI: 10.1002/iid3.1266
Construction of an immune-related prognostic model and potential drugs screening for esophageal cancer based on bioinformatics analyses and network pharmacology
Abstract
Background: Esophageal cancer (ESCA) is a highly invasive malignant tumor with poor prognosis. This study aimed to discover a generalized and high-sensitivity immune prognostic signature that could stratify ESCA patients and predict their overall survival, and to discover potential therapeutic drugs by the connectivity map.
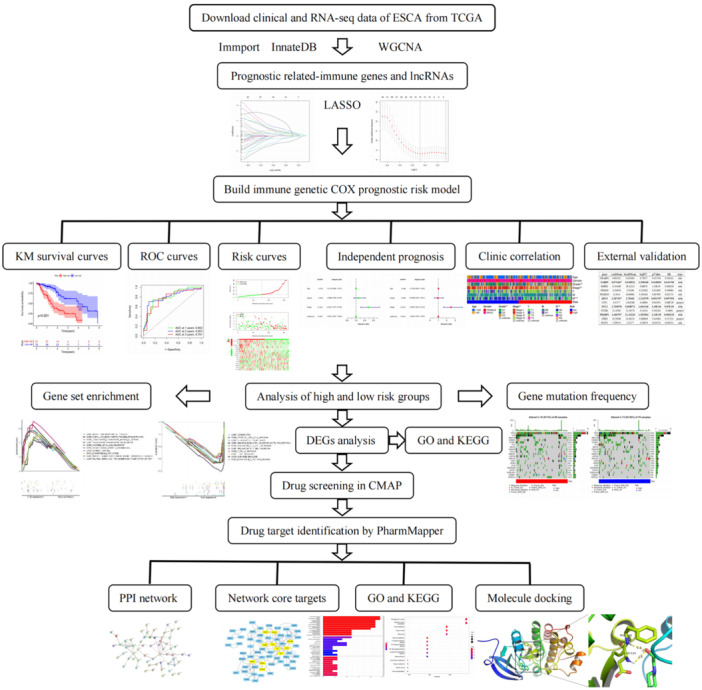
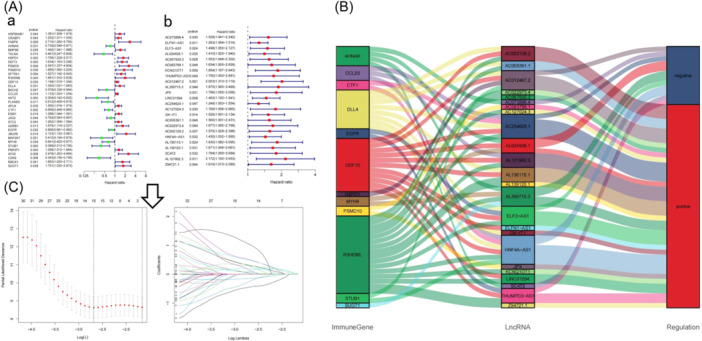
Methods: The key gene modules significantly related to clinical traits (survival time and state) of ESCA patients were selected by weighted gene coexpression network analysis (WCGNA), then the univariate and least absolute shrinkage and selection operator (LASSO) Cox regression analyses were used to construct a 15-immune-related gene prognostic signature.
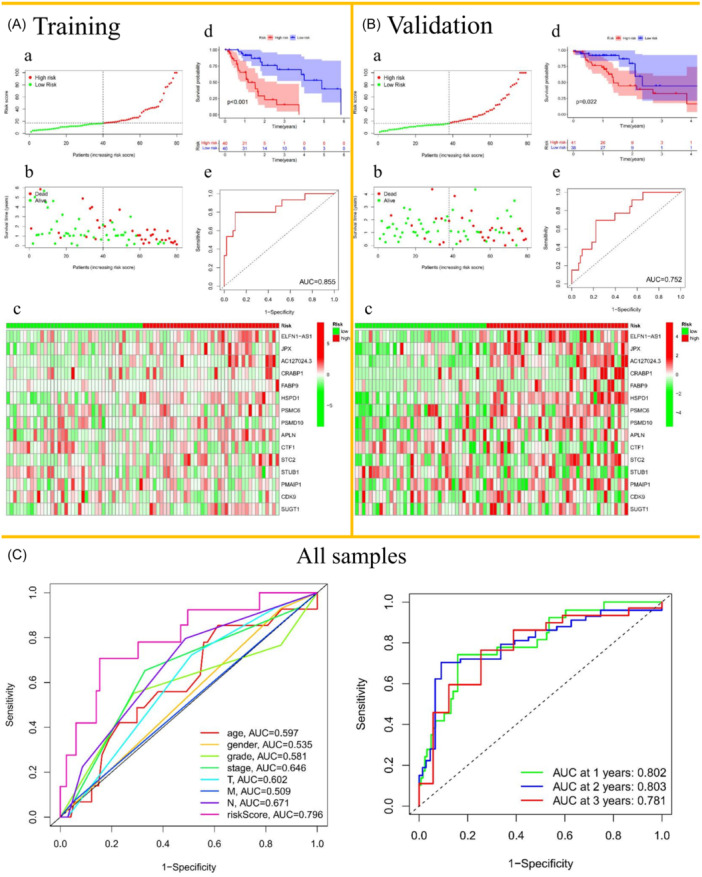
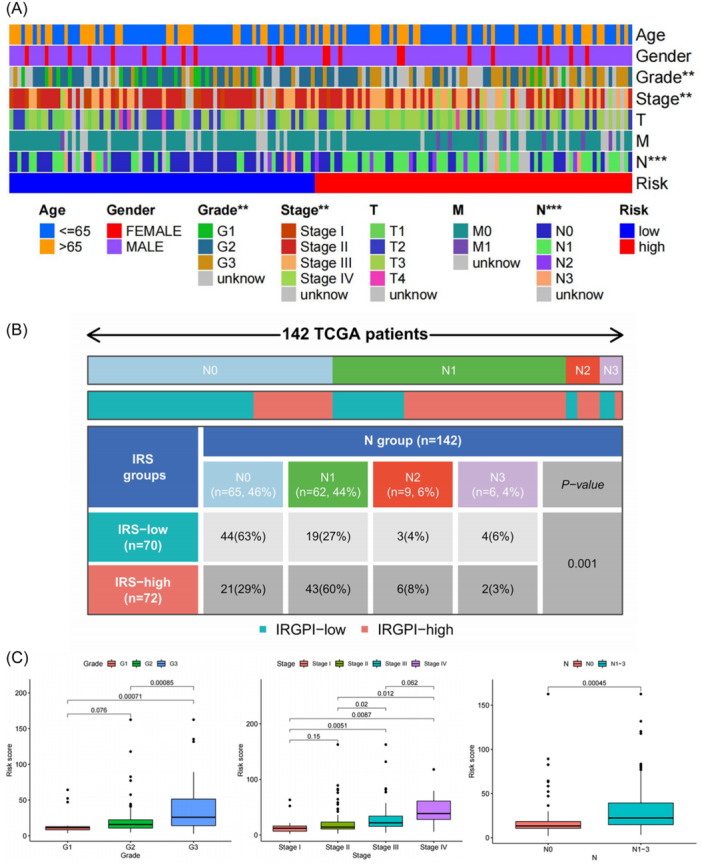
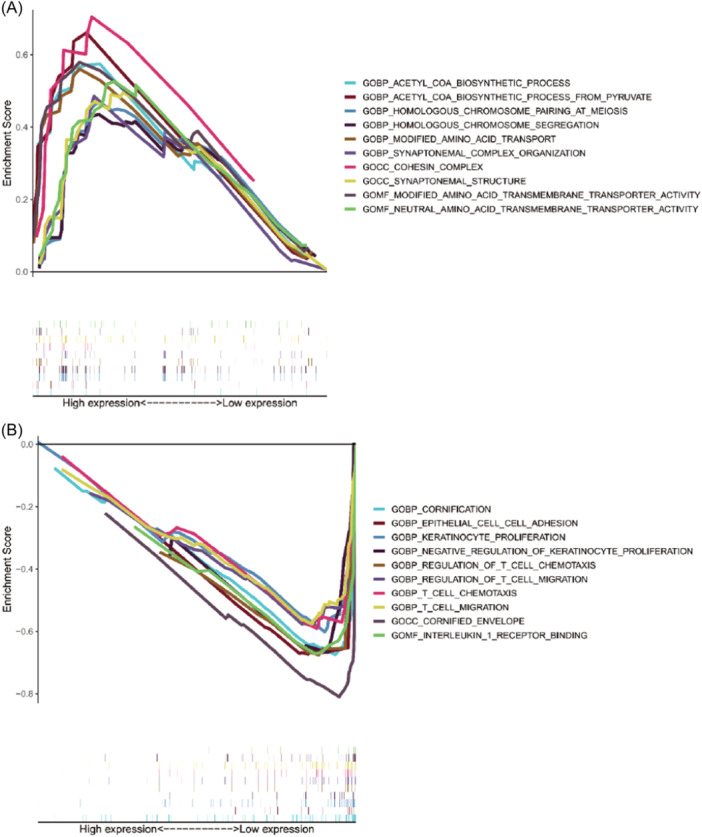
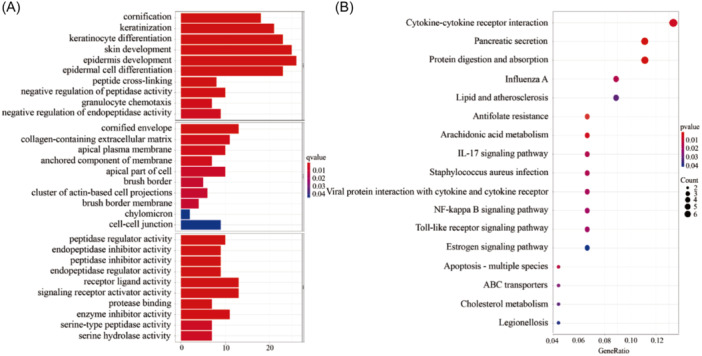
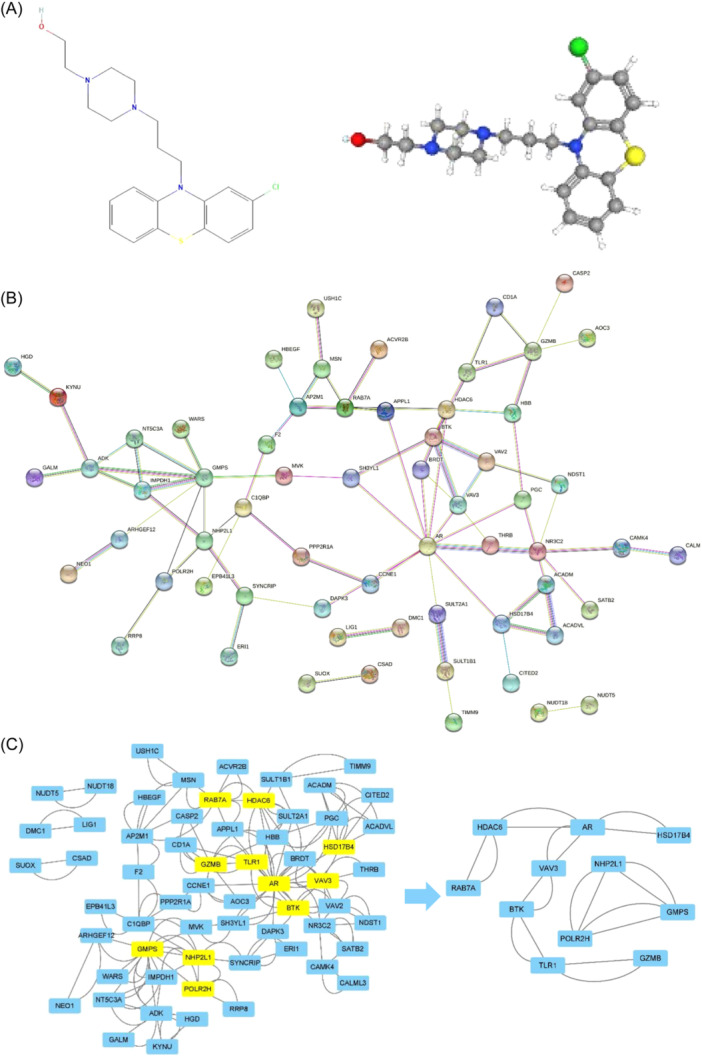
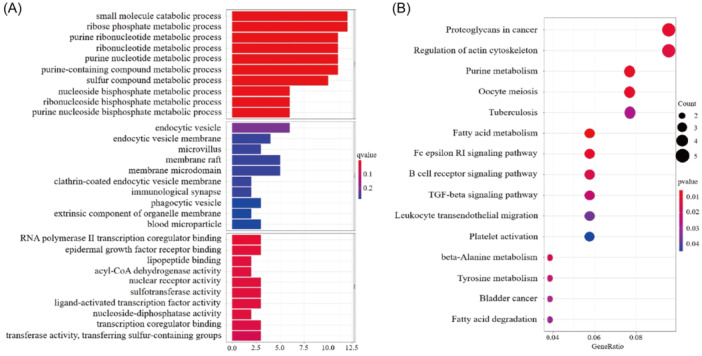
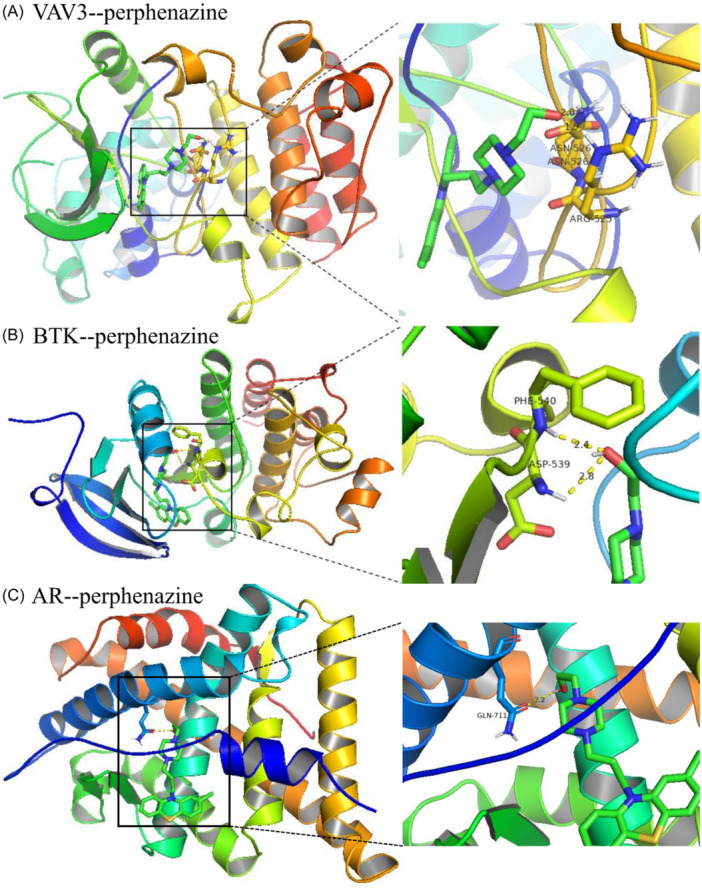
Results: The immune-related risk model was related to clinical and pathologic factors and remained an effective independent prognostic factor. Enrichment analyses revealed that the differentially expressed genes (DEGs) of the high- and low-risk groups were associated with tumor cell proliferation and immune mechanisms. Based on the gathered data, a small molecule drug named perphenazine (PPZ) was elected. The pharmacological analysis indicates that PPZ could help in adjuvant therapy of ESCA through regulation of metabolic process and cellular proliferation, enhancement of immunologic functions, and inhibition of inflammatory reactions. Furthermore, molecular docking was performed to explore and verify the PPZ-core target interactions.
Conclusion: We succeed in structuring the immune-related prognostic model, which could be used to distinguish and predict patients' survival outcome, and screening a small molecule drug named PPZ. Prospective studies also are needed to further validate its analytical accuracy for estimating prognoses and confirm the potential use of PPZ for treating ESCA.
Keywords: esophageal cancer; immune‐related gene; long noncoding RNA; network pharmacology; perphenazine; prognostic model.
© 2024 The Authors. Immunity, Inflammation and Disease published by John Wiley & Sons Ltd.
Conflict of interest statement
The authors declare no conflict of interest.
Figures
Similar articles
-
Integrated bioinformatics analysis to decipher molecular mechanism of compound Kushen injection for esophageal cancer by combining WGCNA with network pharmacology.Sci Rep. 2020 Jul 29;10(1):12745. doi: 10.1038/s41598-020-69708-2. Sci Rep. 2020. PMID: 32728182 Free PMC article.
-
Integrated Analysis of Hub Genes and Pathways In Esophageal Carcinoma Based on NCBI's Gene Expression Omnibus (GEO) Database: A Bioinformatics Analysis.Med Sci Monit. 2020 Aug 5;26:e923934. doi: 10.12659/MSM.923934. Med Sci Monit. 2020. PMID: 32756534 Free PMC article.
-
Novel drug candidates for treating esophageal carcinoma: A study on differentially expressed genes, using connectivity mapping and molecular docking.Int J Oncol. 2019 Jan;54(1):152-166. doi: 10.3892/ijo.2018.4618. Epub 2018 Nov 2. Int J Oncol. 2019. PMID: 30387840 Free PMC article.
-
Prognostic signature analysis and survival prediction of esophageal cancer based on N6-methyladenosine associated lncRNAs.Brief Funct Genomics. 2024 May 15;23(3):239-248. doi: 10.1093/bfgp/elad028. Brief Funct Genomics. 2024. PMID: 37465899
-
Identification of DNA-Repair-Related Five-Gene Signature to Predict Prognosis in Patients with Esophageal Cancer.Pathol Oncol Res. 2021 Mar 30;27:596899. doi: 10.3389/pore.2021.596899. eCollection 2021. Pathol Oncol Res. 2021. PMID: 34257547 Free PMC article.
References
-
- Pfister SM, Reyes‐Múgica M, Chan JKC, et al. A summary of the inaugural WHO classification of pediatric tumors: transitioning from the optical into the molecular era. Cancer Discov. 2022;12(2):331‐355. 10.1158/2159-8290.CD-21-1094 - DOI - PMC - PubMed
Publication types
MeSH terms
Substances
Grants and funding
LinkOut - more resources
Full Text Sources
Medical
