. 2025 Feb;48(1):101-122.
doi: 10.1007/s13402-024-00958-2. Epub 2024 May 28.

OrganoIDNet: a deep learning tool for identification of therapeutic effects in PDAC organoid-PBMC co-cultures from time-resolved imaging data

Affiliations

OrganoIDNet: a deep learning tool for identification of therapeutic effects in PDAC organoid-PBMC co-cultures from time-resolved imaging data

Nathalia Ferreira et al. Cell Oncol (Dordr). 2025 Feb.

Abstract

Purpose: Pancreatic Ductal Adenocarcinoma (PDAC) remains a challenging disease due to its complex biology and aggressive behavior with an urgent need for efficient therapeutic strategies. To assess therapy response, pre-clinical PDAC organoid-based models in combination with accurate real-time monitoring are required.

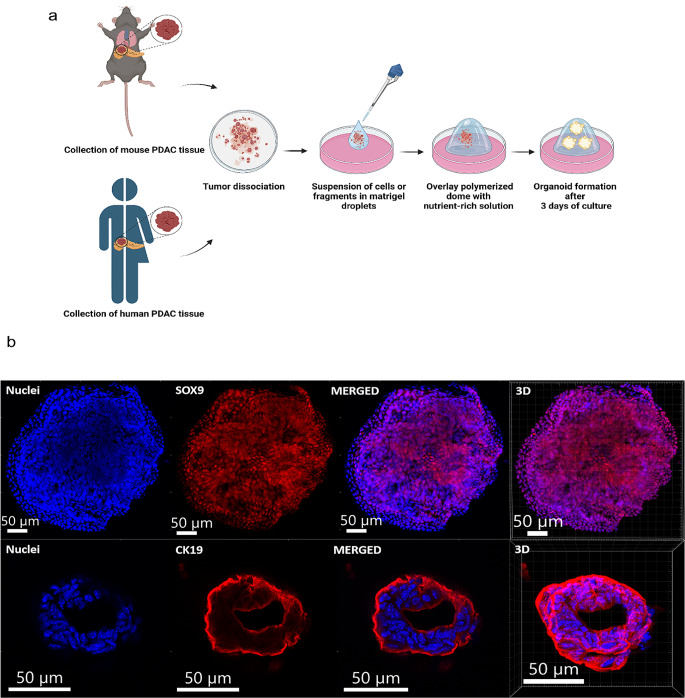
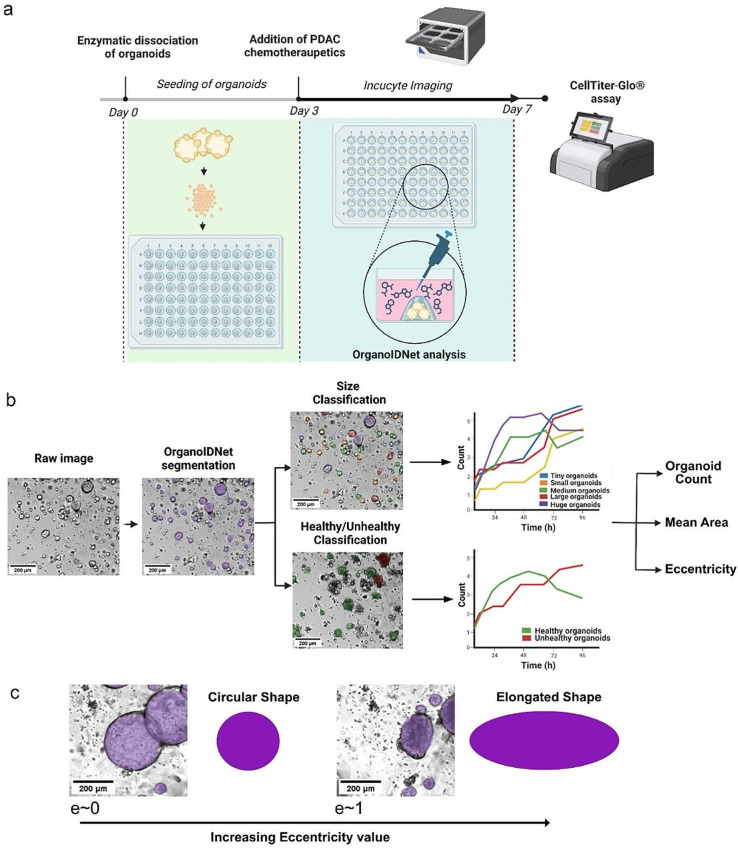
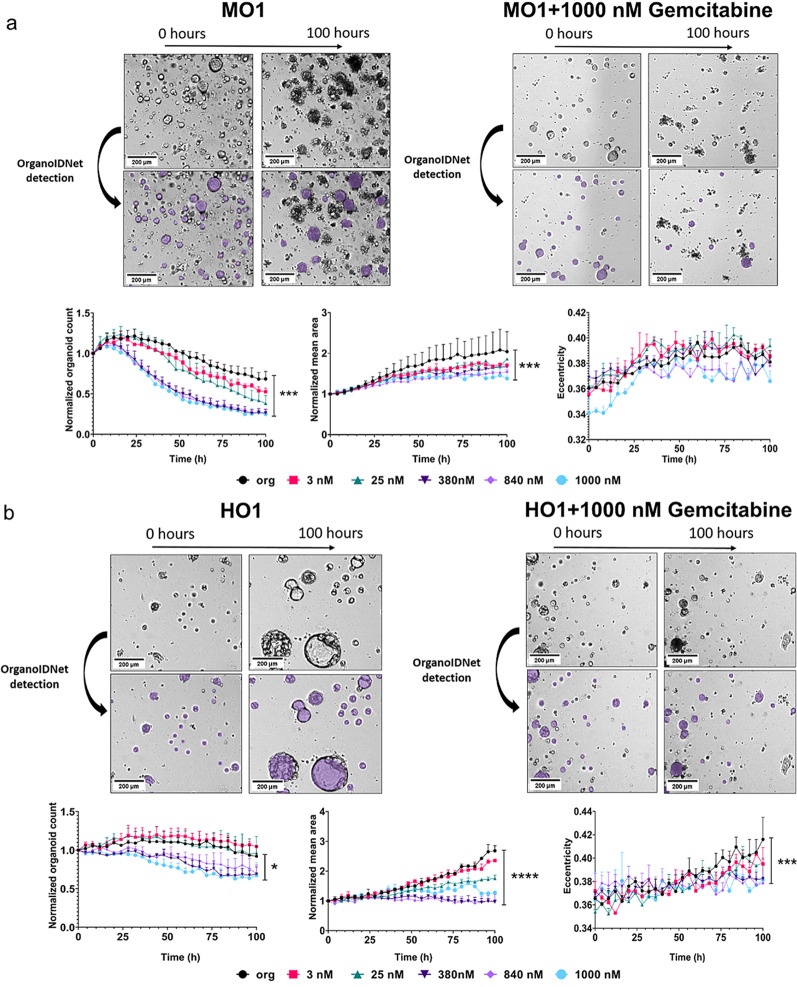
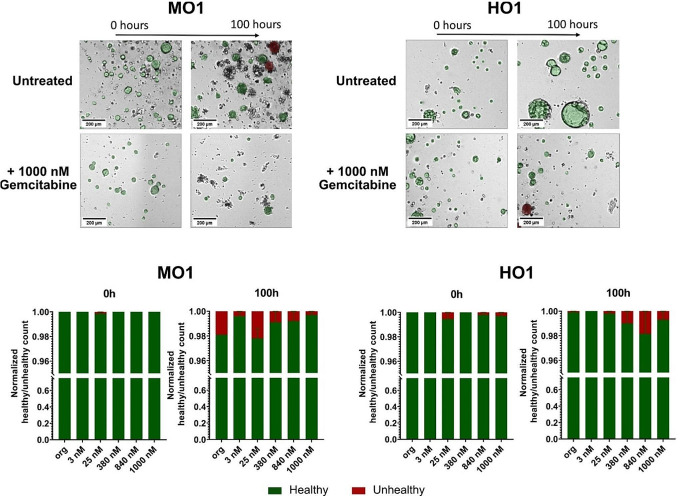
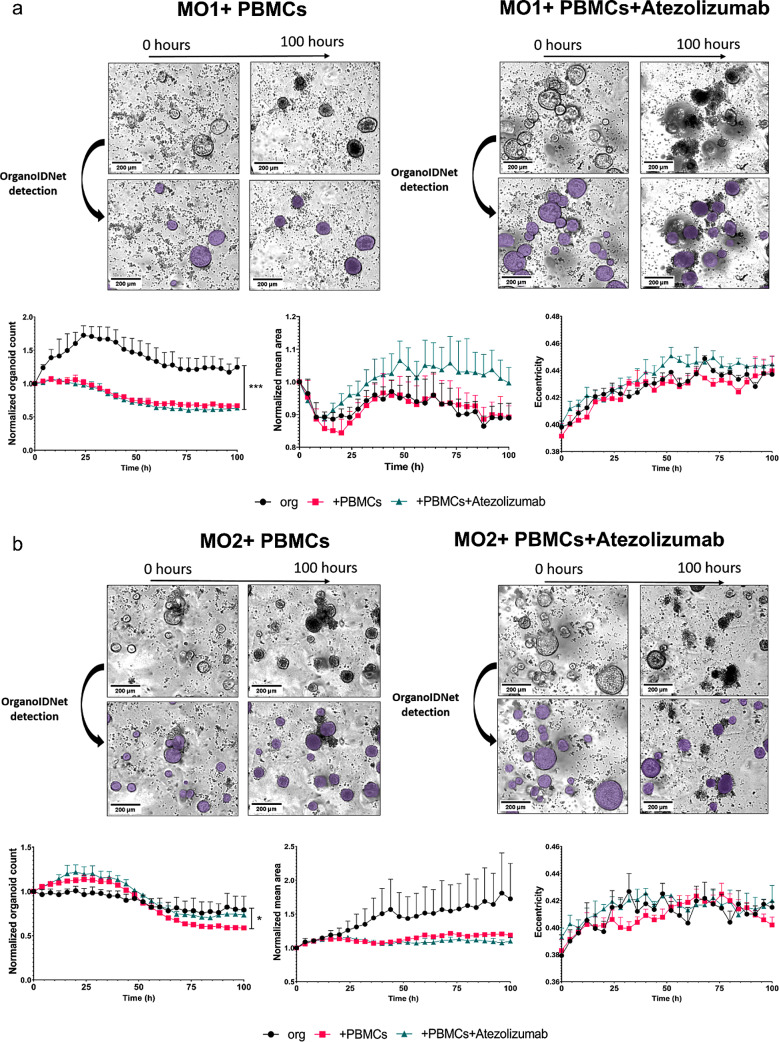
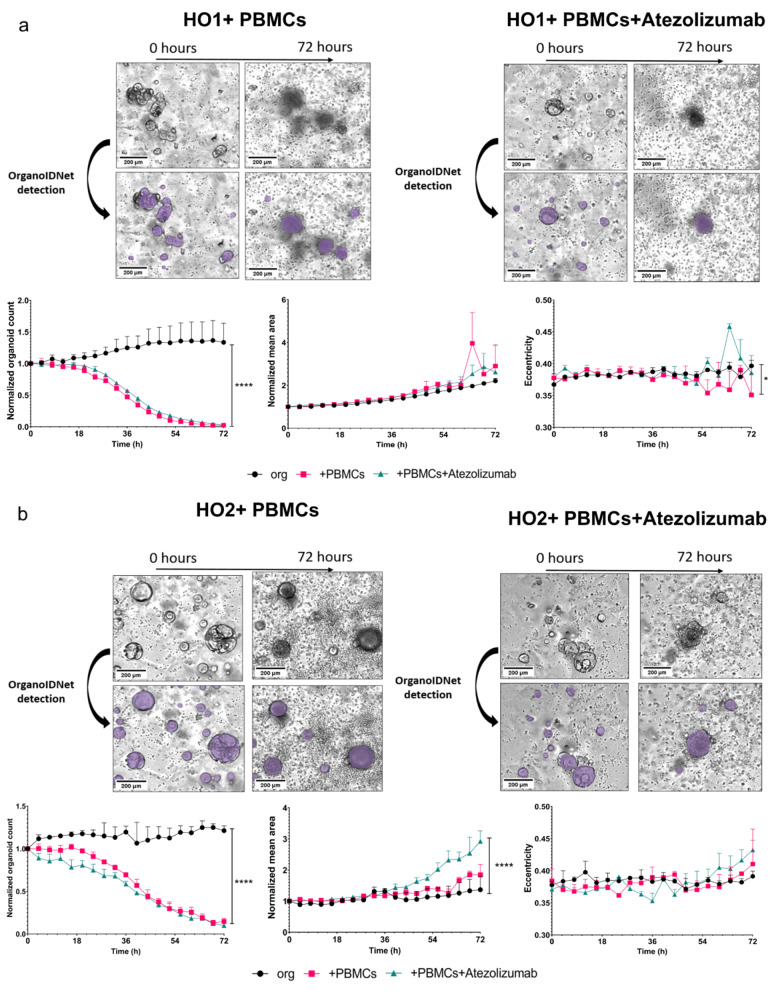
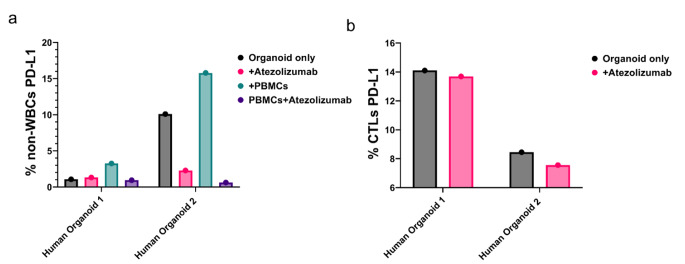
Methods: We established stable live-imaging organoid/peripheral blood mononuclear cells (PBMCs) co-cultures and introduced OrganoIDNet, a deep-learning-based algorithm, capable of analyzing bright-field images of murine and human patient-derived PDAC organoids acquired with live-cell imaging. We investigated the response to the chemotherapy gemcitabine in PDAC organoids and the PD-L1 inhibitor Atezolizumab, cultured with or without HLA-matched PBMCs over time. Results obtained with OrganoIDNet were validated with the endpoint proliferation assay CellTiter-Glo.

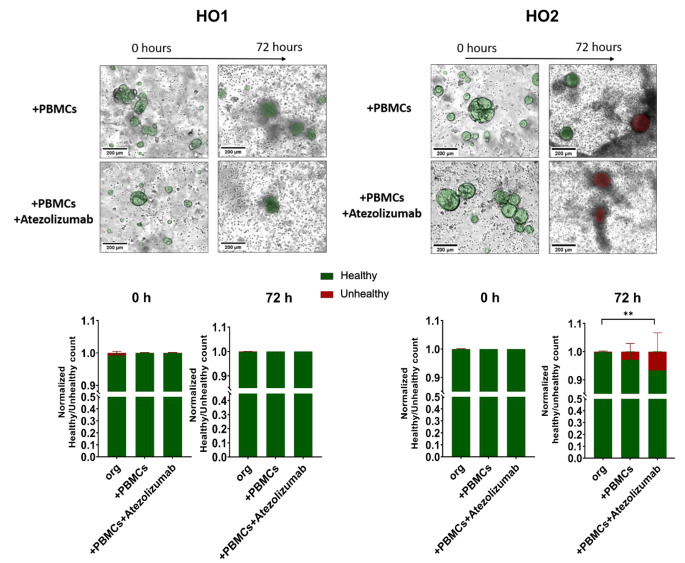
Results: Live cell imaging in combination with OrganoIDNet accurately detected size-specific drug responses of organoids to gemcitabine over time, showing that large organoids were more prone to cytotoxic effects. This approach also allowed distinguishing between healthy and unhealthy status and measuring eccentricity as organoids' reaction to therapy. Furthermore, imaging of a new organoids/PBMCs sandwich-based co-culture enabled longitudinal analysis of organoid responses to Atezolizumab, showing an increased potency of PBMCs tumor-killing in an organoid-individual manner when Atezolizumab was added.

Conclusion: Optimized PDAC organoid imaging analyzed by OrganoIDNet represents a platform capable of accurately detecting organoid responses to standard PDAC chemotherapy over time. Moreover, organoid/immune cell co-cultures allow monitoring of organoid responses to immunotherapy, offering dynamic insights into treatment behavior within a co-culture setting with PBMCs. This setup holds promise for real-time assessment of immunotherapeutic effects in individual patient-derived PDAC organoids.

Keywords: Artificial intelligence; Co-cultures; Gemcitabine; Immunotherapy; Organoids; PDAC.


Conflict of interest statement

Declarations. Competing interests: The authors declare no competing interests.

Figures

Fig. 1
Fig. 1
Workflow of the establishment of organoids and validation of KPC-derived mouse PDAC organoids (a) Schematic overview of the generation of murine and human PDAC organoids (created with BioRender.com). (b) Immunofluorescence images of KPC-tumor derived mouse organoids (MO) stained for SOX9 (upper panel, red) and CK19 (lower panel, red) expression. Nuclei are shown by Hoechst staining in blue. Scale bars: 50 µM
Fig. 2
Fig. 2
Organoid analysis platform for assessing real-time PDAC response to chemotherapeutics (a) Establishment of a protocol for assessing PDAC organoid response to treatment with gemcitabine using OrganoIDNet on live cell imaging data and cell viability endpoint assay by CellTilter-Glo©. (b) OrganoIDNet analysis includes the segmentation of individual organoids from raw images and subsequent classification. This differentiates the organoids based on both size categories (from Tiny to Huge organoids) and pixel intensity, which allows distinction between healthy and unhealthy organoids. Organoids that exhibit a mean intensity value below the threshold of 50 are categorized as unhealthy. Counts of different size organoids and healthy/unhealthy ratio were thus assessed over time. (c) Eccentricity measures of organoids’ reaction to therapy with values between zero (defining a perfect circular shape) and one (defining an elongated shape). All the plots were normalized to the initial conditions. Scale bar: 200 µM. Images were created using BioRender.com
Fig. 3
Fig. 3
OrganoIDNet analysis reveals gemcitabine-induced toxicity in PDAC organoids. (a) Comparison between untreated (left) and treated mouse PDAC organoids (right). Upper panel: representative images of MO1; Lower panel: OrganoIDNet quantification of the number, average area, and eccentricity of organoids over time in response to different concentrations of gemcitabine. (b) Comparison between untreated (left) and treated human organoids (right). Upper panel: representative images of HO1; Following 100 h of incubation with 1000 nM gemcitabine both murine and human organoid cultures show less detectable organoids and a substantial amount of cell debris (right). Lower panel: OrganoIDNet quantification of the number, average area, and eccentricity of organoids over time in response to different concentrations of gemcitabine. All parameters were normalized to initial time and data are presented as mean ± SEM of two biological samples, with two technical replicates each. * p < 0.05, ** p < 0.01, *** p < 0.001, **** p < 0.0001 (Two-way ANOVA followed by Dunnett’s comparisons). Scale bars: 200 µM
Fig. 4
Fig. 4
OrganoIDNet analysis shows no effect of gemcitabine on murine and human organoid health status. Representative images (upper panel) of healthy (green) and unhealthy (red) organoids in the mouse (left) and human (right) model in response to 1000 nM gemcitabine (lower panel) in comparison to untreated organoids, using the darkness parameter, which indicates the health status of the organoid. Following 100 h of incubation with 1000 nM gemcitabine both murine and human organoid cultures show less detectable organoids and a substantial amount of cell debris. Lower panel: Quantification of healthy (green) and unhealthy (red) organoids is shown in response to different concentrations of gemcitabine. All parameters were normalized to counts at initial time and data are presented as mean ± SEM of two biological samples, with two technical replicates each. Scale bars: 200 µM
Fig. 5
Fig. 5
Size-dependent response of PDAC organoids to gemcitabine treatment and validation of OrganoIDNet by CellTiter-Glo. (a) OrganoIDNet effectively clustered PDAC organoids based on size, here “Huge” and “Tiny”, and stimulation with 1000 nM gemcitabine specifically targeted the Huge mouse (MO, left) and human (HO, right) PDAC organoids. Raw data were normalized by the respective baseline control. (b) CellTiter-Glo assay was conducted following a 100 h treatment of organoids with gemcitabine at different concentrations (3 nM to 1000 nM). Viability of organoids was quantified as optical density (OD) from ATP levels for each condition normalized to untreated mouse or human organoids (left). For comparison, the right graph shows the organoid count calculated by OrganoIDNet at the same time point in response to gemcitabine. Counts in (a) were normalized to initial time points and data are presented as mean ± SEM of two biological samples, with two technical replicates each. Statistical significance is indicated as follows: * p < 0.05, ** p < 0.01, *** p < 0.001, **** p < 0.0001 (Two-way ANOVA followed by Dunnett’s comparisons for (a); One-way ANOVA followed by Dunnett’s comparisons test in (b))
Fig. 6
Fig. 6
Methodological overview for evaluating the impact of Atezolizumab on organoid/ PBMC co-cultures (a) Schematic representation of PBMC pre-activation in the presence of LymphoGrow Medium or anti-CD28/CD3 antibody for mouse and human PBMCs, respectively, to facilitate PBMC activation. PBMC activation was confirmed by live-cell imaging using the Incucyte system by demonstration of aggregation of PBMCs (red arrows). (b) Schematic illustration showing the sandwich protocol that facilitates the direct interaction between PBMCs and PDAC organoids, while ensuring a stable Z-position for imaging with the Incucyte. On day 3, pre-stimulated PBMCs and fully-grown PDAC organoids were co-cultured and subjected to Atezolizumab stimulation. Incucyte images were captured over 3–4 days and analyzed using the OrganoIDNet algorithm. Organoid viability was assessed at the end of the experiment using a luminescent CellTiter-Glo assay. (c) Representative bright-field images depicting the patient-derived organoid cytotoxicity elicited by stimulated human PBMCs (marked by red arrows) from days 3–7. Scale bars: 200 µM
Fig. 7
Fig. 7
Decreased count of murine organoids in organoid/PBMC co-cultures. Representative Incucyte images and quantification of counts, area, and eccentricity by applying OrganoIDNet of MO1 (a) and MO2 (b) co-cultured with PBMCs alone or with the addition of Atezolizumab, compared to organoid-only conditions over a 100 h observation period. All parameters were normalized to the initial time point, and the data are presented as mean ± SEM of three technical replicates. * p < 0.05, ** p < 0.01, *** p < 0.001 (Two-way ANOVA followed by Dunnett’s comparisons). Scale bars: 200 µM
Fig. 8
Fig. 8
Distinct response of individual human organoids to PBMC co-cultures with Atezolizumab treatment. Representative Incucyte images and quantification of counts, area, and eccentricity applying OrganoIDNet of HO1 (a) and HO2 (b), co-cultured with PBMCs alone or with the addition of Atezolizumab, compared to organoid-only conditions as controls over a 72 h observation period. All parameters were standardized to the initial time point, and the findings are presented as mean ± SEM of three technical replicates. Statistical significance is denoted as follows: * p < 0.05, **** p < 0.0001 (Two-way ANOVA followed by Dunnett’s comparisons). Scale bars: 200 µM
Fig. 9
Fig. 9
Distinct response of mouse organoid/PBMC co-cultures to Atezolizumab treatment. Representative images and quantification of unhealthy (red) and healthy (green) organoids by applying OrganoIDNet for MO1 (left panel) and for MO2 (right panel) in co-cultures with PBMCs alone or with the addition of Atezolizumab (at 0 h in comparison to 100 h). Counts were normalized to the initial time point, and the data are presented as mean ± SEM of three technical replicates (lower panel). Statistical significance is indicated as follows: * p < 0.05 (Two-way ANOVA followed by Dunnett’s comparisons)
Fig. 10
Fig. 10
Distinct response of human organoid/PBMC co-cultures to Atezolizumab treatment. Representative images and quantification of unhealthy (red) and healthy (green) organoids by applying OrganoIDNet for HO1 (left panel) and for HO2 (right panel) in co-cultures with PBMCs alone or with the addition of Atezolizumab. All parameters were standardized to the initial time point, and the findings are presented as mean ± SEM of three technical replicates. Statistical significance is indicated as follows: ** p < 0.01; Scale bars: 200 µM
Fig. 11
Fig. 11
CellTiter-Glo viability assay does not reflect OrganoIDNet results of co-coltures. Mean OD is shown after a 100 h (murine) or 72 h (human) co-cultivation of individual murine (MO1 and MO2) and human (HO1 and HO2) PDAC organoids with their respective pre-activated mouse and human PBMCs (+ PBMCs) or with the addition of Atezolizumab (+ PBMCs + Atezolizumab). Findings are presented as mean ± SEM of two technical replicates
Fig. 12
Fig. 12
Atezolizumab efficacy may be dependent on PD-L1 expression of organoids. Baseline PD-L1 was higher in HO2 and Atezolizumab decreased the levels of PD-L1 expression in human PDAC organoids and in human CTLs cells. (a) At endpoint of the organoid/PBMCs co-cultures (72 h), PD-L1 expression levels were evaluated from non-white blood cells (%non-WBCs) (left graph) which represented the tumor cells from HO1 and HO2 alone (organoid only and + Atezolizumab conditions) and from the co-cultures (+ PBMCs and + PBMCs + Atezolizumab). (b) Cells from the PBMCs were gated to identify the cytotoxic T lymphocytes (CTLs), and percentage of PD-L1 expressing cells (%CTLs PD-L1) was quantified from the co-cultures (+ PBMCs and + PBMCs + Atezolizumab conditions). Findings are presented as mean ± SEM of two biological replicates

References

    1. J.X. Hu, C.F. Zhao, W.B. Chen, Q.C. Liu, Q.W. Li, Y.Y. Lin et al., Pancreatic cancer: a review of epidemiology, trend, and risk factors. World J. Gastroenterol. 27(27), 4298–4321 (2021) - PMC - PubMed
    1. A. Adamska, A. Domenichini, M. Falasca, Pancreatic ductal adenocarcinoma: current and evolving therapies. Int. J. Mol. Sci. 18(7), 1338 (2017) - PMC - PubMed
    1. R.L. Siegel, K.D. Miller, A. Jemal, Cancer statistics, 2018. CA Cancer J Clin. 2018;68(1):7–30 - PubMed
    1. A.K. Witkiewicz, E.A. McMillan, U. Balaji, G. Baek, W.C. Lin, J. Mansour et al., Whole-exome sequencing of pancreatic cancer defines genetic diversity and therapeutic targets. Nat. Commun. 6, 6744 (2015) - PMC - PubMed
    1. E.S. Christenson, E. Jaffee, N.S. Azad, Current and emerging therapies for patients with advanced pancreatic ductal adenocarcinoma: a bright future. Lancet Oncol. 21(3), e135–e145 (2020) - PMC - PubMed

MeSH terms