. 2024 May 31;38(10):e23703.
doi: 10.1096/fj.202400358RR.

Transport activity regulates mitochondrial bioenergetics and biogenesis in renal tubules

Affiliations

Transport activity regulates mitochondrial bioenergetics and biogenesis in renal tubules

Chih-Jen Cheng et al. FASEB J. .

Abstract

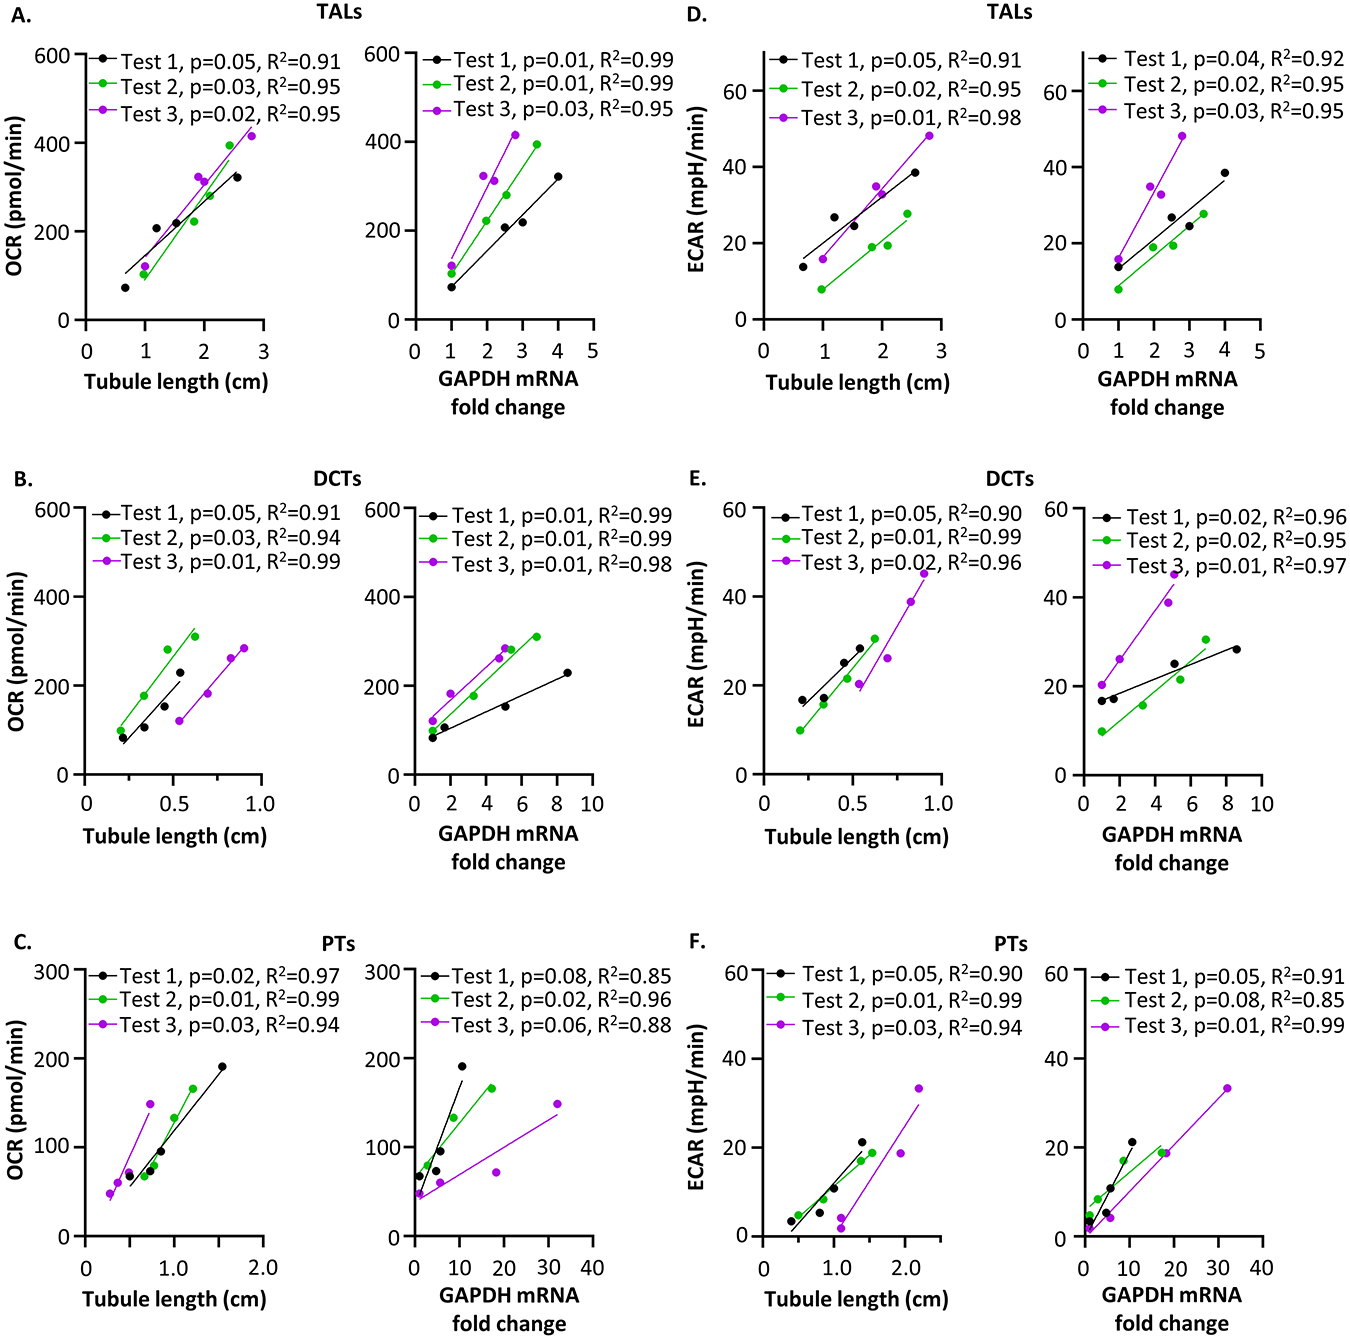
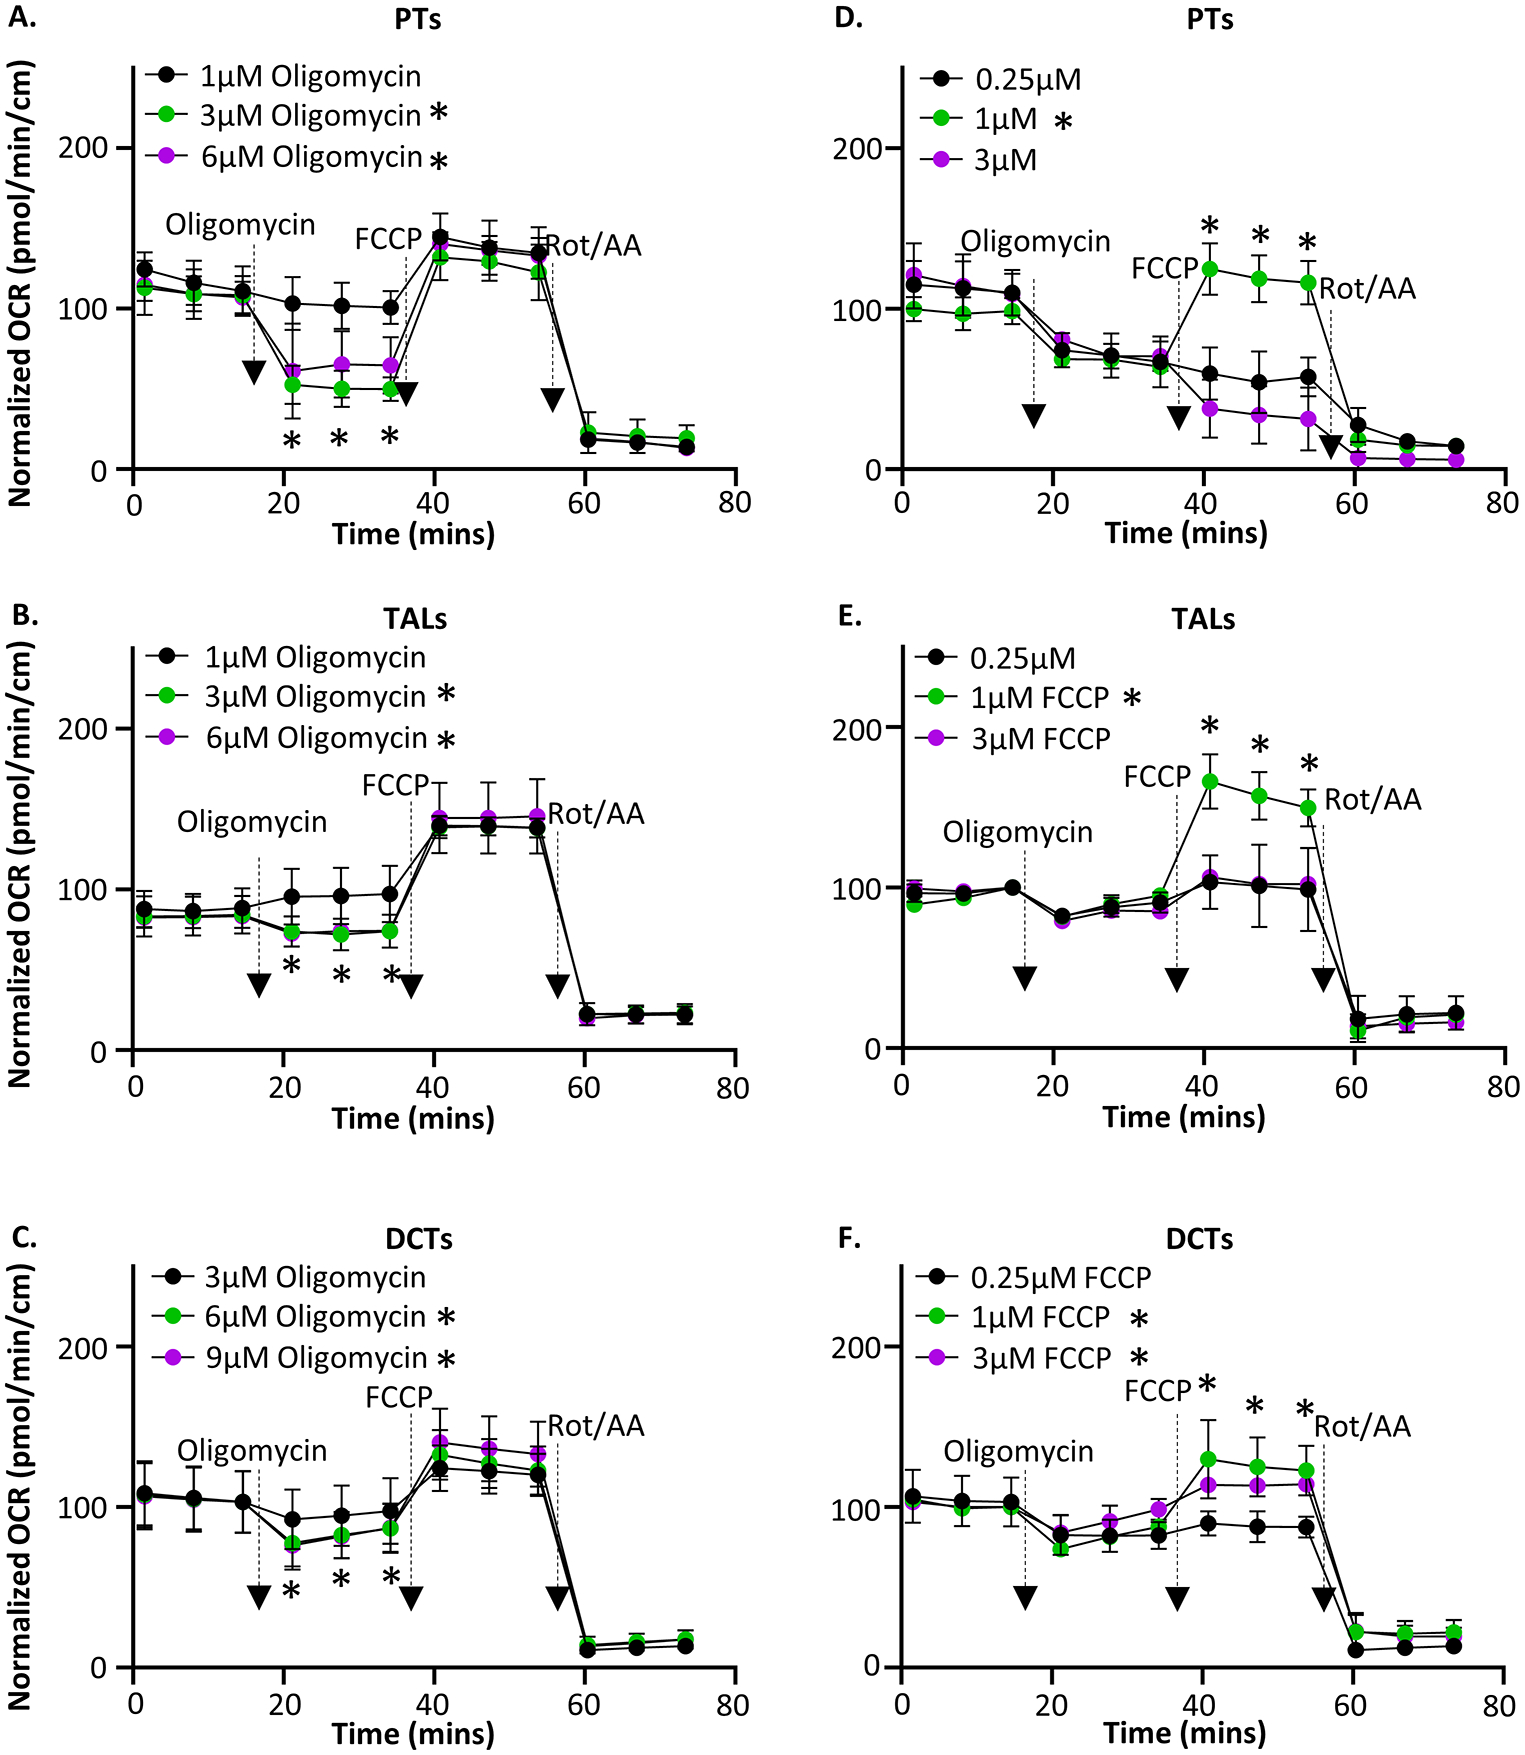
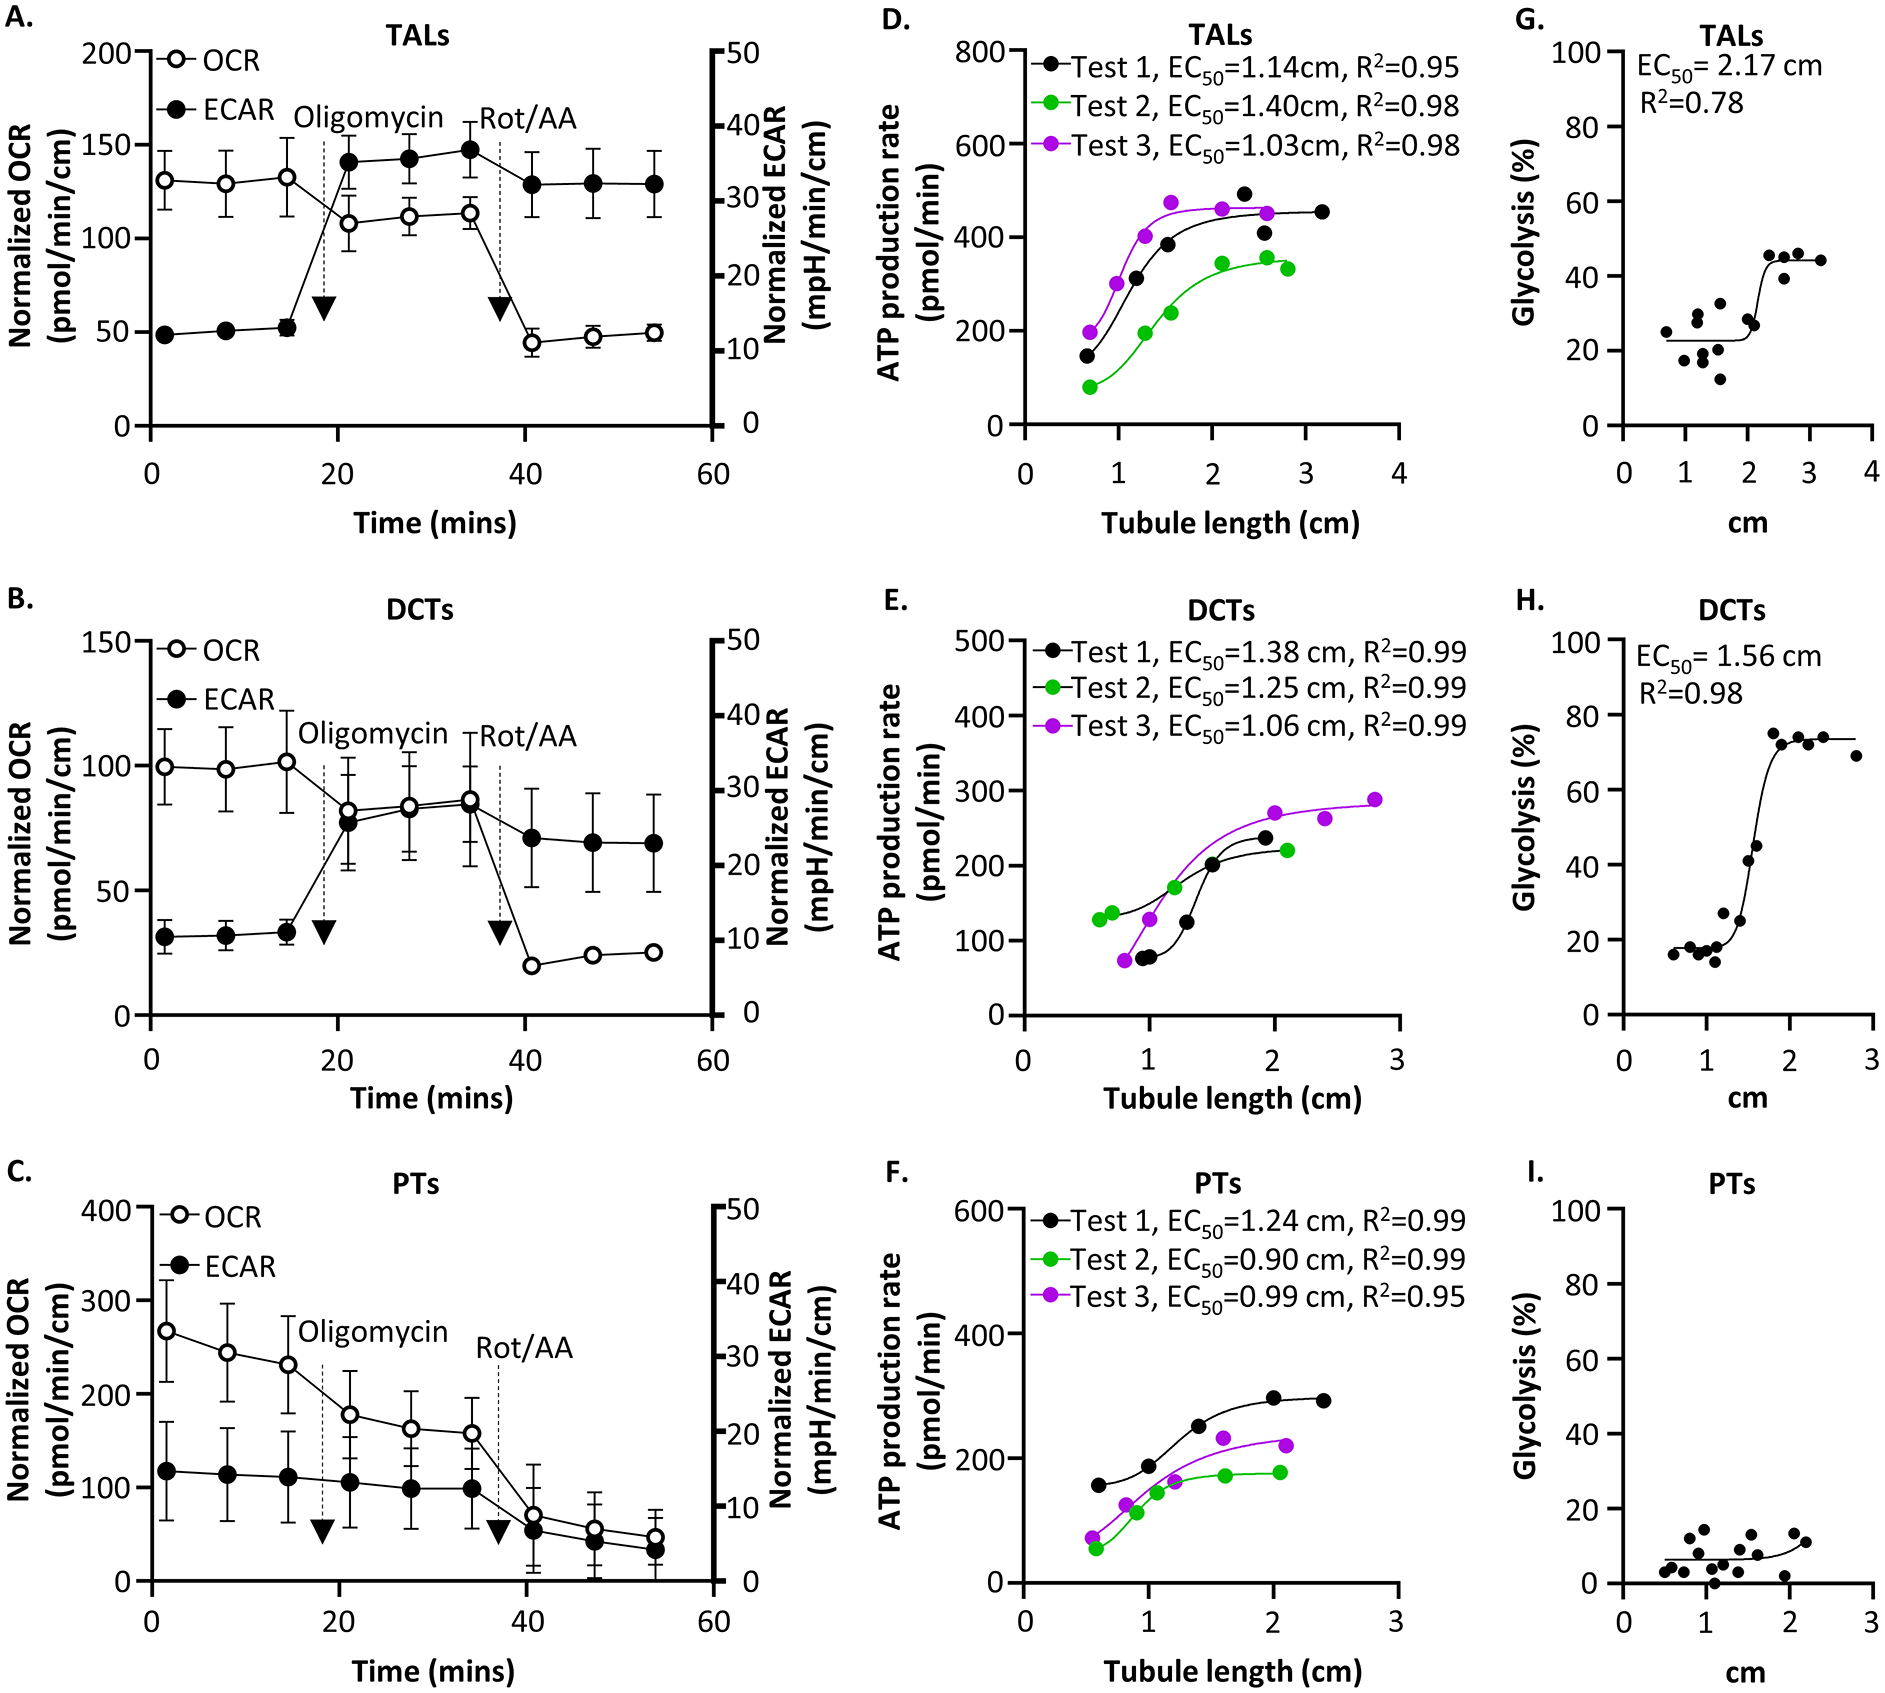
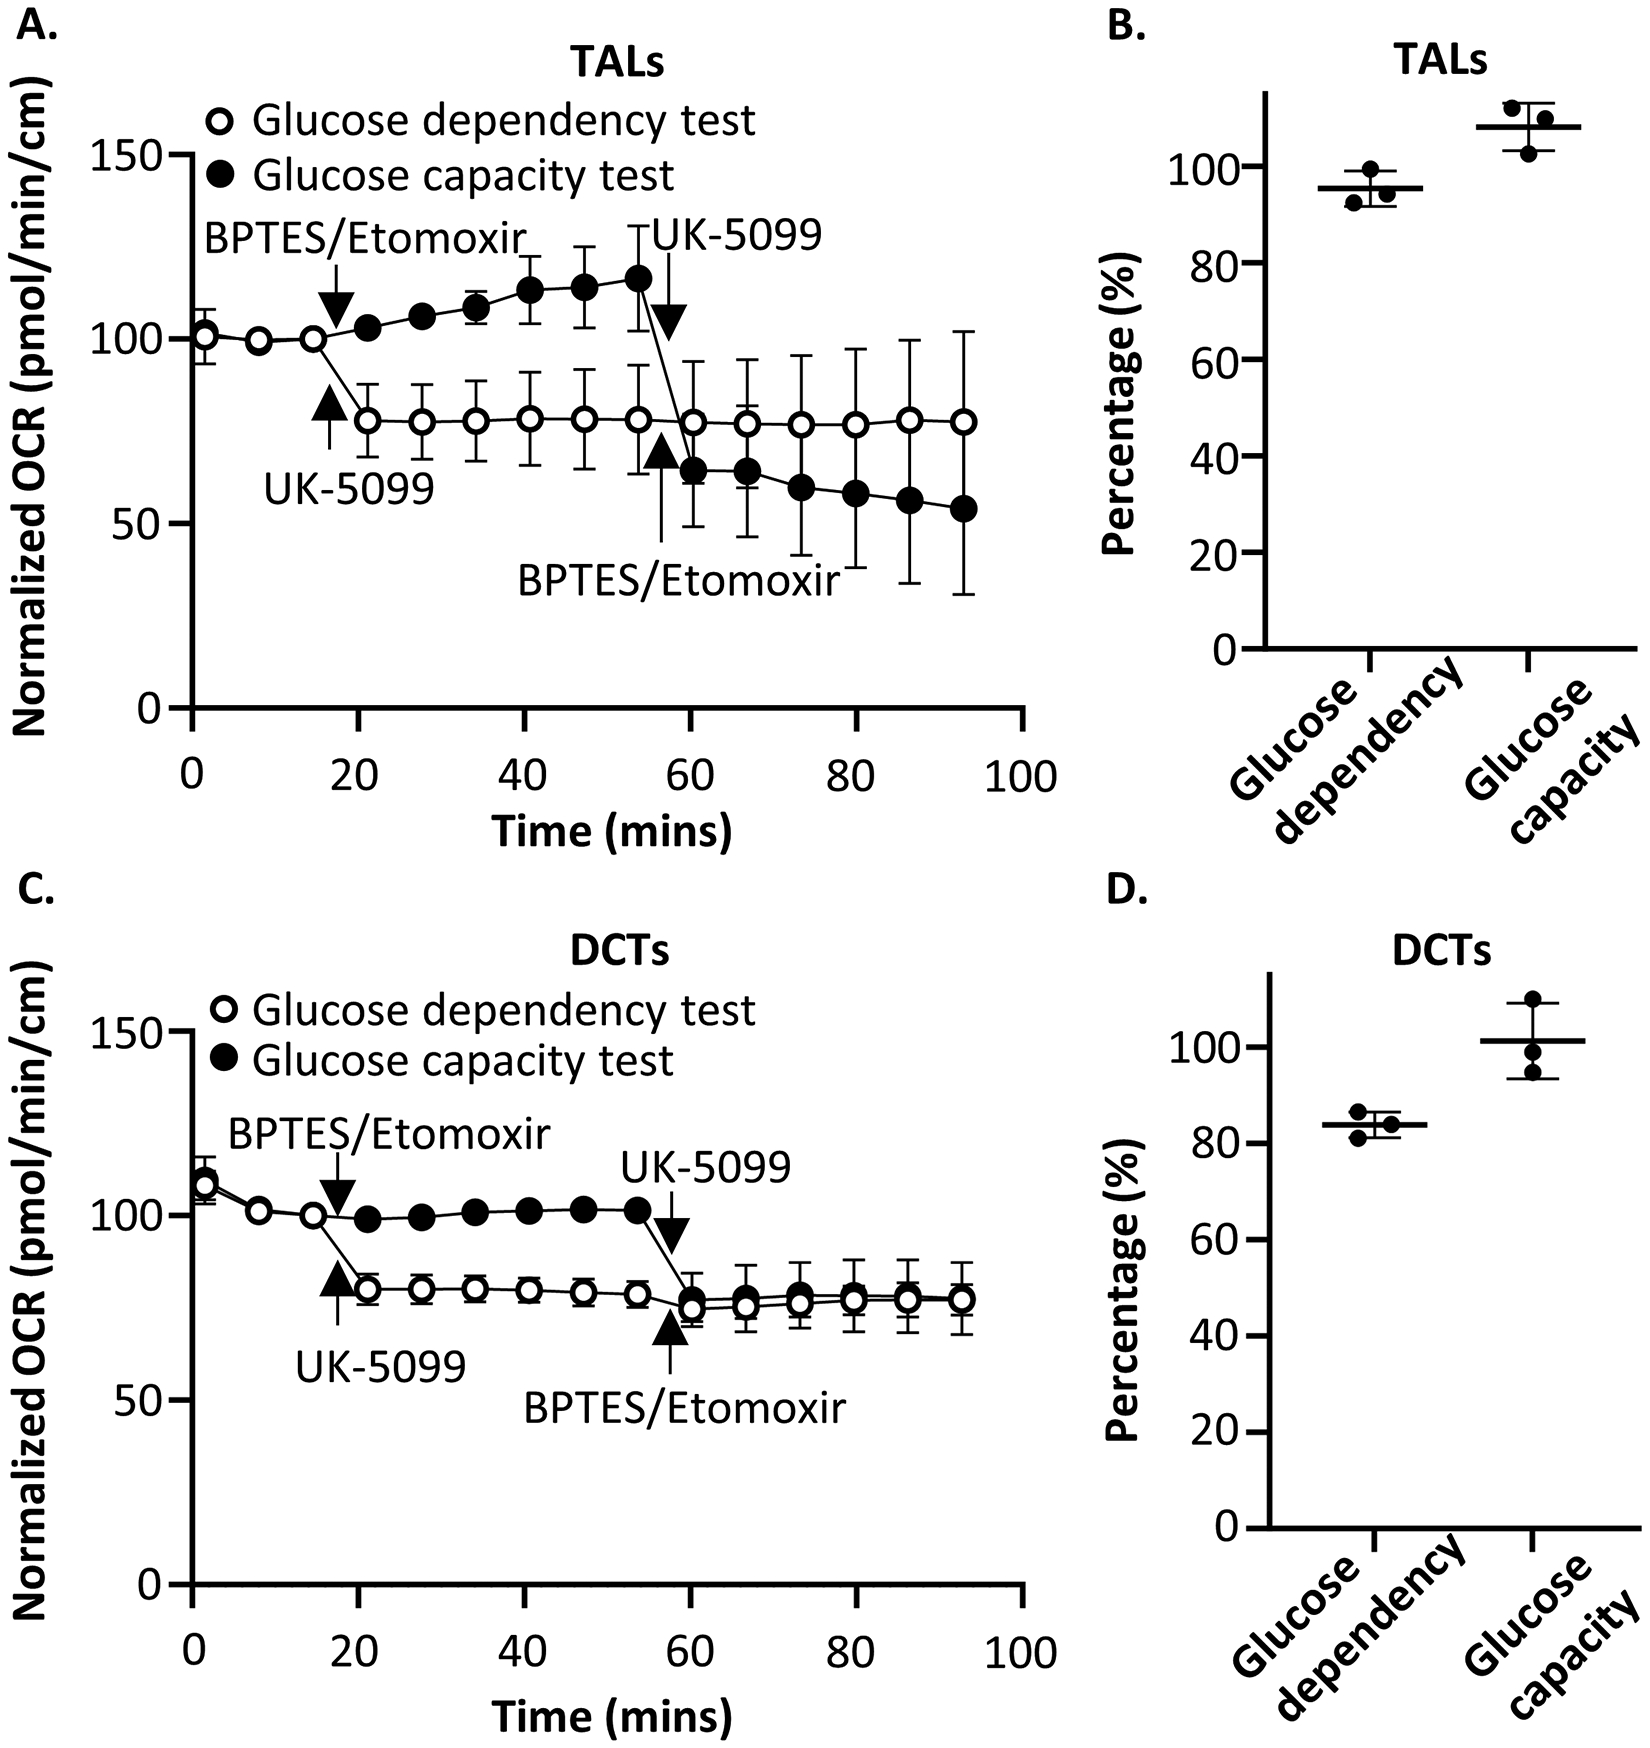
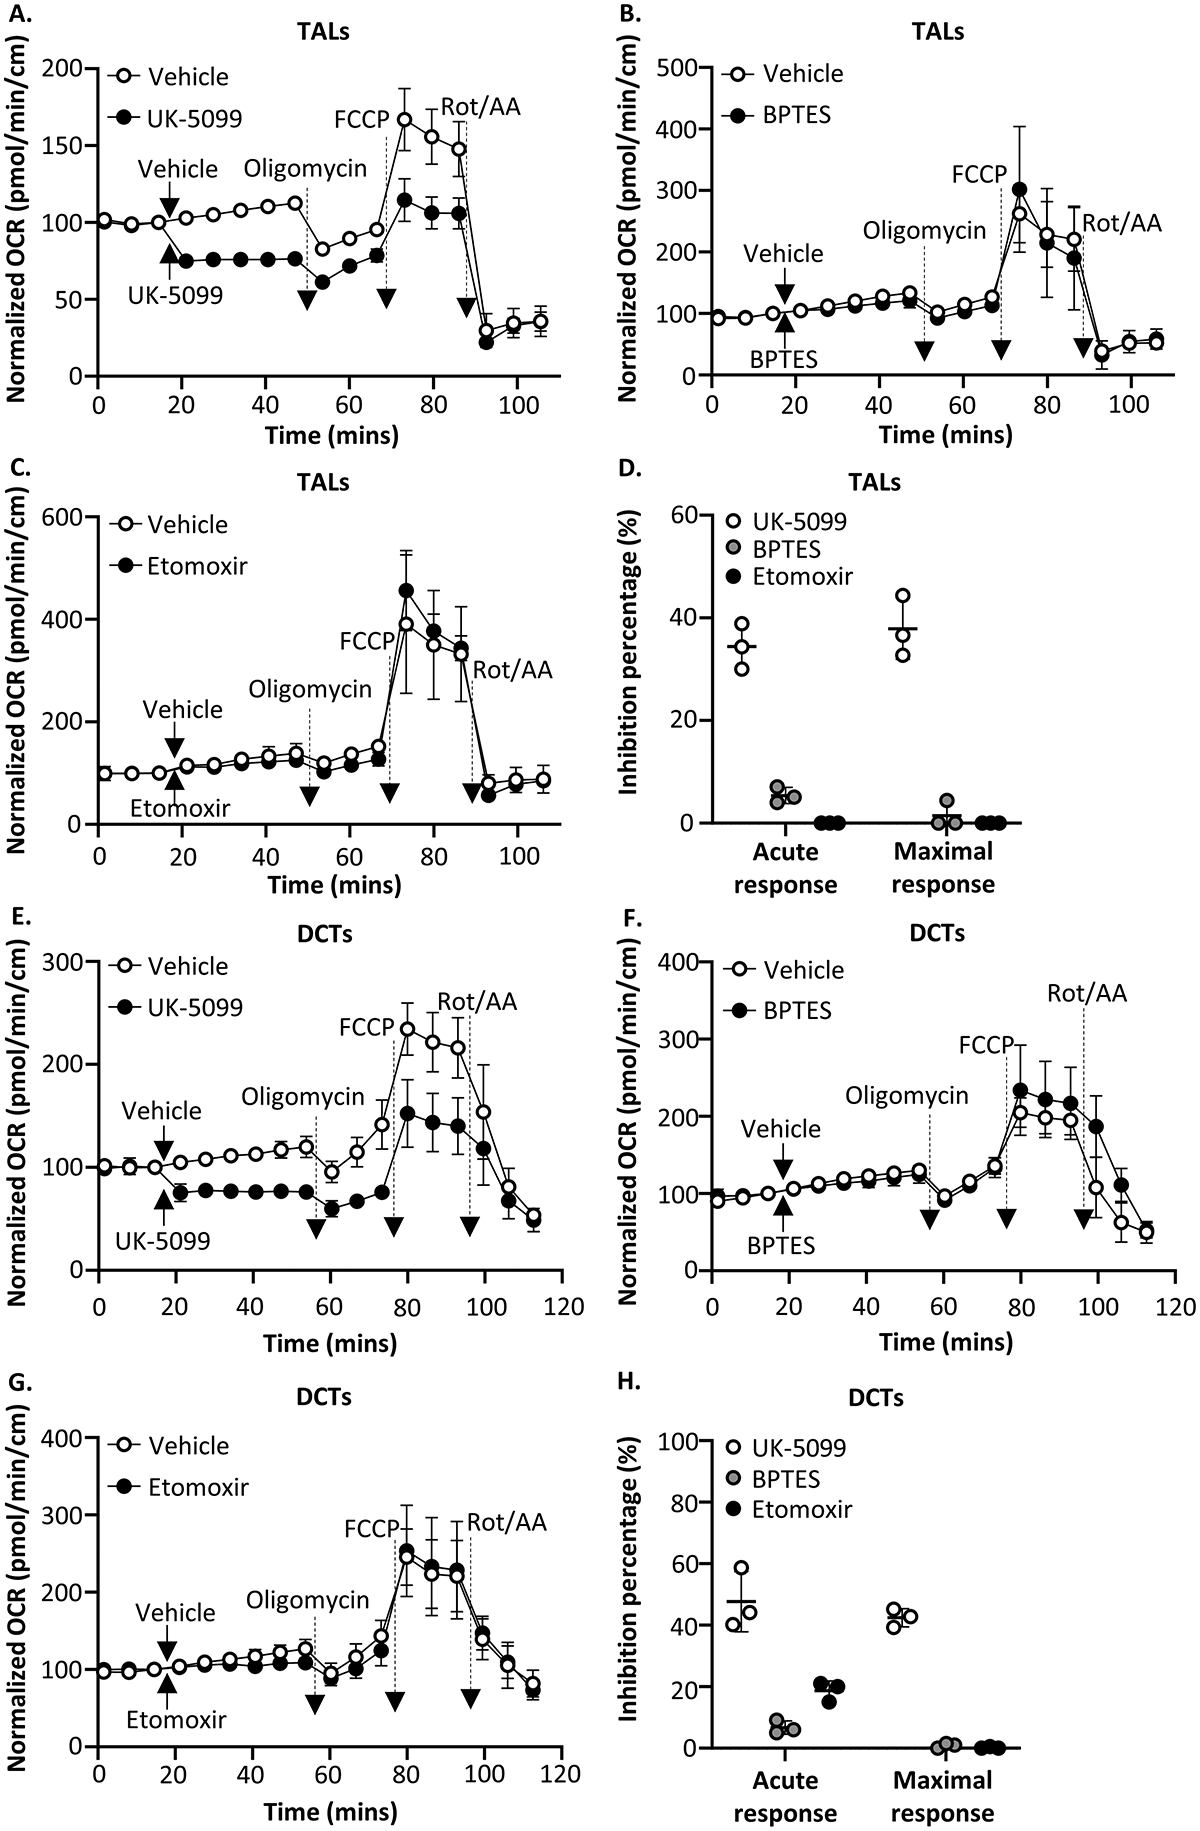
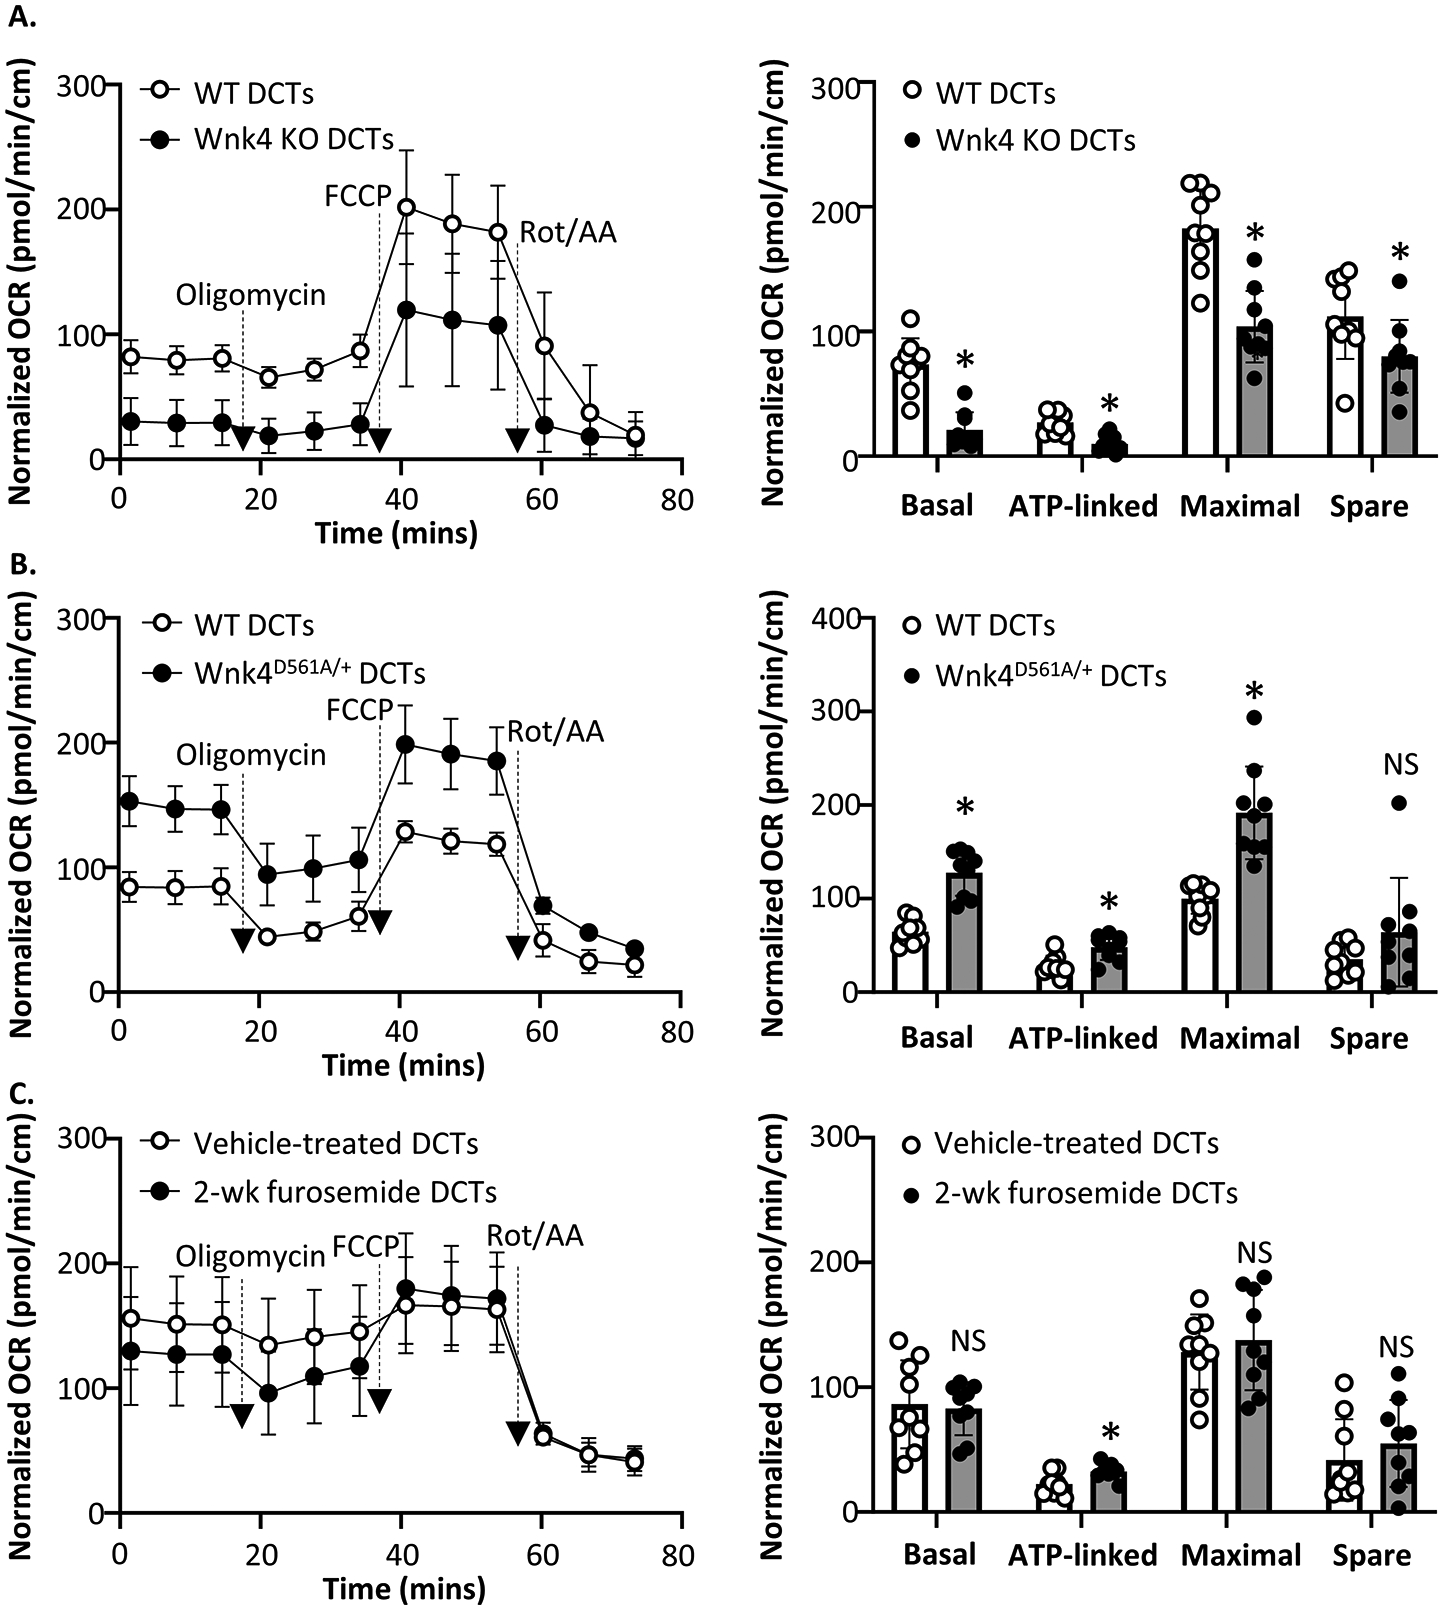
Renal tubules are featured with copious mitochondria and robust transport activity. Mutations in mitochondrial genes cause congenital renal tubulopathies, and changes in transport activity affect mitochondrial morphology, suggesting mitochondrial function and transport activity are tightly coupled. Current methods of using bulk kidney tissues or cultured cells to study mitochondrial bioenergetics are limited. Here, we optimized an extracellular flux analysis (EFA) to study mitochondrial respiration and energy metabolism using microdissected mouse renal tubule segments. EFA detects mitochondrial respiration and glycolysis by measuring oxygen consumption and extracellular acidification rates, respectively. We show that both measurements positively correlate with sample sizes of a few centimeter-length renal tubules. The thick ascending limbs (TALs) and distal convoluted tubules (DCTs) critically utilize glucose/pyruvate as energy substrates, whereas proximal tubules (PTs) are significantly much less so. Acute inhibition of TALs' transport activity by ouabain treatment reduces basal and ATP-linked mitochondrial respiration. Chronic inhibition of transport activity by 2-week furosemide treatment or deletion of with-no-lysine kinase 4 (Wnk4) decreases maximal mitochondrial capacity. In addition, chronic inhibition downregulates mitochondrial DNA mass and mitochondrial length/density in TALs and DCTs. Conversely, gain-of-function Wnk4 mutation increases maximal mitochondrial capacity and mitochondrial length/density without increasing mitochondrial DNA mass. In conclusion, EFA is a sensitive and reliable method to investigate mitochondrial functions in isolated renal tubules. Transport activity tightly regulates mitochondrial bioenergetics and biogenesis to meet the energy demand in renal tubules. The system allows future investigation into whether and how mitochondria contribute to tubular remodeling adapted to changes in transport activity.

Keywords: distal convoluted tubule; extracellular flux analysis; glycolysis; mitochondrial respiration; thick ascending limb; transport activity.


Conflict of interest statement

Conflict of Interest Statement

The authors declare no conflicts of interest.

Figures

Figure 1.
Figure 1.
Authentication of isolated renal tubules. (A) The proximal tubules (PTs, S1/S2), thick ascending limbs (TALs), and distal convoluted tubules (DCTs) are recognized by their distinct gross appearance. PTs (S1 & S2) are large in diameter and convoluted (we did not use S3 in this study). TALs are thin, straight, and parallel with S3 PTs and collecting ducts. The distal end of TALs is juxtaposed and attached to its parental glomerulus. DCTs are proximally connected to TALs, thicker in diameter than TALs, and distinctively convoluted. The distal ends of multiple DCTs merge into one collecting duct. (B) Segment-specific markers (Slc5a2 for PTs S1/S2, Slc12a1 for TALs, Slc12a3 for DCTs, and Aqp2 for collecting ducts) were used to verify the purity of isolated renal tubules by quantitative PCR (n=6 for each segment).
Figure 2.
Figure 2.
Basal oxygen consumption and proton production rates positively correlated with sample sizes of isolated renal tubules. Different amounts of isolated TALs, DCTs, and PTs were used for EFA assays to measure basal OCRs (A-C) and ECARs (D-F). Three separate EFA tests were conducted for each tubular segment (n = 3 for each segment). Each test included 4 renal tubule samples isolated from the same mouse kidney. After EFA assays, renal tubules were harvested for RNA extraction and quantitative PCR. The sample size was quantitated by the sum of lengths of isolated renal tubules using image J (left panel) or by the relative Gapdh mRNA level (fold-change versus the smallest sample) using quantitative PCR (right panel). The correlations between basal OCRs/ECARs and sample sizes were analyzed by simple linear regression. The p and R2 values for each test are shown in the figures. (DCT: distal convoluted tubule; ECAR: extracellular acidification rate; EFA: extracellular flux analysis; OCR: oxygen consumption rate; PT: proximal tubule; TAL: thick ascending limb)
Figure 3.
Figure 3.
Optimization of oligomycin and FCCP concentrations for extracellular flux analysis using isolated renal tubules. Different doses of oligomycin or FCCP were used in Seahorse Cell Mito Stress Tests to determine the optimal oligomycin and FCCP concentration. (A-C) The optimal concentration of oligomycin for each tubular segment was determined when comparing the 4th-6th OCR between different oligomycin concentrations (n = 3 for each dose). (D-F) The optimal concentration of FCCP for each tubular segment was determined when comparing the 7th-9th OCR between different FCCP concentrations (n=3 for each dose). *p < 0.05 between the designated group and the group with the lowest concentration using two-way ANOVA with mixed-effects analysis.
Figure 4.
Figure 4.
ATP production rates correlated with tubule length of isolated renal tubules before reaching a plateau. Real-time ATP rate tests were used to determine the relative contributions of mitochondrial OXPHOS and glycolysis to ATP production. For each test, 5–6 renal tubule samples with different lengths were isolated from the same mouse kidney. Three separate tests were performed. (A-C) A representative figure of simultaneous OCRs and ECARs measurements in real-time ATP rate tests using isolated TALs (A), DCTs (B), or PTs (C). OCRs and ECARs were normalized by tubule length. Data are presented as mean ± SD. (D-F) Calculated basal ATP production rates (see methods for equations) of isolated renal tubules from each test were nonlinearly correlated with tubule length for TALs (D), DCTs (E), and PTs (F) using nonlinear curve-fitting regression analysis ([Agonist] vs. response -- Variable slope (four parameters)). The EC50 (tubule length with OCR at 50% of the plateau) and R2 values for each test were shown. (G-I) The relative contribution of glycolytic ATP production to the total ATP production in TALs (G), DCTs (H), and PTs (I). Data from three tests were pooled for nonlinear curve-fitting regression analysis ([Agonist] vs. response -- Variable slope (four parameters)) (n=16 for each segment). The EC50 (tubule length with glycolysis percentage at 50% of the maximum [44% in TALs, 73% in DCTs]) and R2 values were shown in TALs and DCTs. Data from PTs did not reach a statistically meaningful result.
Figure 5.
Figure 5.
Mitochondrial fuel usage in the basal state of isolated TALs and DCTs. Seahorse XF Mito Fuel Flex Tests were used to determine the relative contributions of glucose, glutamine, and LCFAs oxidation to basal respiration in isolated TALs (A, B) and DCTs (C, D) by measuring OCRs in the absence and presence of pathway inhibitors. Glucose dependency and capacity tests were performed simultaneously with a reverse injection sequence of pathway inhibitors (see methods). For each test, six renal tubule samples were isolated from the same mouse kidney (n=3 for glucose dependency test, n = 3 for glucose capacity test). Three separate tests with similar results were performed for each tubular segment. (A, C) A representative OCR tracing of Mito Fuel Flex tests using isolated TALs (A) or DCTs (C). (B, D) The calculated glucose dependency and capacity of mitochondrial respiration in TALs (B) or DCTs (D). Results were summarized from three tests. Glucose dependency was estimated using the equation of [(mean OCRbasal (3rd point) – mean OCRUK-5099 (4th point)) / (mean OCRbasal (3rd point) – mean OCRBPTES/Etomoxir (10th point))] x 100%, indicating the uncompensated part of mitochondrial respiration fueled by glucose oxidation. Glucose capacity was calculated using the equation of [1 – (mean OCRbasal (3rd point) – mean OCRBPTES/Etomoxir (4th point)) / (mean OCRbasal (3rd point) – mean OCRUK-5099 (10th point))] x 100%, indicating the ability of renal tubules to oxidize glucose when the oxidation of glutamine and LCFAs are inhibited. All OCRs were normalized by tubule length and the 3rd OCR (defined as 100 pmol/min/cm) of each sample. Data are presented as mean ± SD.
Figure 6.
Figure 6.
Mitochondrial fuel usage under high energy demand states of isolated TALs and DCTs. Seahorse XF Substrate Oxidation Stress Tests were conducted to investigate the oxidation of glucose, glutamine, and LCFAs in basal and high energy demand states in TALs (A-D) and DCTs (E-H). For each test, six renal tubule samples were isolated from the same mouse kidney (n=3 for the vehicle group, n = 3 for the metabolic inhibitor group). Three separate tests with similar results were performed for each tubular segment. (A-C) A representative OCR tracing of glucose (A), glutamine (B), or LCFAs (C) oxidation stress tests using isolated TALs. (D) The relative contribution of glucose, glutamine, and LCFAs oxidation to basal (acute response) and maximal respirations (maximal response) in isolated TALs. Results were summarized from three tests. (E-G) A representative OCR tracing of glucose (E), glutamine (F), or LCFAs (G) oxidation stress tests using isolated DCTs. (H) The relative contribution of glucose, glutamine, and LCFAs oxidation to basal and maximal respirations in isolated DCTs. Results were summarized from three tests. Acute responses were calculated by [1 – (mean OCRbasal – mean trough OCRURot/AA with pathway inhibitor) / (mean OCRbasal – mean trough OCRURot/AA with vehicle)] x 100%, indicating the percentage of basal OCR being suppressed by pathway inhibitors. Maximal responses were calculated by [1 – (mean peak OCRFCCP – mean trough OCRRot/AA with pathway inhibitor) / (mean peak OCRFCCP – mean trough OCRRot/AA with vehicle)] x 100%, indicating the percentage of maximal OCR being suppressed by pathway inhibitors. The arrows mark the timepoint of pathway inhibitor or vehicle injection. The dashed arrows indicate the injections of ETC complex inhibitors and uncoupler FCCP. All OCRs were normalized by tubule length and the 3rd OCR (defined as 100 pmol/min/cm) of each sample. Data are presented as mean ± SD.
Figure 7.
Figure 7.
Characterization of 2-week furosemide-treated mice. (A) Daily body weight and (B) urine osmolality during 2-week furosemide or vehicle (DMSO) treatment. *p < 0.05 between vehicle-treated and furosemide-treated groups using two-way ANOVA with mixed-effects analysis (p values: body weight = 0.02, urine osmolality < 0.0001, n = 6 for each group). (C) Western blot analysis of major cotransporters and channels involved in sodium reabsorption in thick ascending limb, distal convoluted tubule, and collecting duct. The abundance of each band was measured by densitometry using the Image J program. *p < 0.05 between vehicle-treated and furosemide-treated groups using a two-tailed Student unpaired-t test (p values: Nkcc2 = 0.63, p-Nkcc2 = 0.84, Ncc = 0.01, p-Ncc = 0.02, cleaved ENaC-ϒ = 0.04, ENaC-α = 0.05, n = 5 for each group). Data are presented as mean ± SD. (Ncc: sodium, chloride cotransporter; p-Ncc(T58): threonine 58 phosphorylated Ncc; Nkcc2: sodium, potassium, chloride cotransporter type 2; p-Nkcc2(T105): threonine 105 phosphorylated Nkcc2; ENaC: epithelial sodium channel)
Figure 8.
Figure 8.
Mitochondrial respiration in isolated TALs with different transport activities. Seahorse XF Cell Mito Stress Tests were used to study mitochondrial respiration in isolated TALs with acutely or chronically altered transport activity. The inset showed the definition of mitochondrial respiration parameters: Basal OCR = OCRbasal – OCRRot/AA., ATP-linked = OCRbasal – OCROligomycin, Maximal OCR = OCRFCCP – OCRRot/AA, Spare OCR = OCRFCCP – OCRbasal. For each test, three TAL samples isolated from an experimental mouse were compared to three TAL samples isolated from a control mouse. Experimental and control mice were matched in genetic background, age, and gender. The left panel showed the OCR tracing of a representative test of three similar tests (see the other two tests in Supplemental Figure 2). The dashed arrows indicate the injections of ETC complex inhibitors and uncoupler FCCP. All OCRs were normalized by tubule length. The right panel summarizes the results of mitochondrial respiration parameters from three tests. *p < 0.05, and NS: statistically not significant between two groups using a two-tailed Student unpaired-t test. Data are presented as mean ± SD. (A) TALs treated with 30mg/kg/day furosemide (2-wk furosemide) or vehicle for 2 weeks were compared (p values: basal = 0.001, ATP-linked = 0.007, maximal = 0.001, spare = 0.44, n=9). (B) TALs treated with 500 μM ouabain (2-hr Ouabain) or vehicle for 2 hours were compared. Tubule samples for each test were isolated from the same mouse kidney (p values: basal = 0.05, ATP-linked = 0.002, maximal = 0.59, spare = 0.49, n=9). (C) TALs isolated from Wnk4 knockout (Wnk4 KO) or wild-type (WT) littermates were compared (p values: basal = 0.0001, ATP-linked = 0.001, maximal = < 0.0001, spare = 0.003, n=9). (D) TALs isolated from Wnk4D561A/+ knockin or WT littermates were compared (p values: basal = 0.0002, ATP-linked = <0.0001, maximal = 0.0001, spare = 0.92, n=9).
Figure 9.
Figure 9.
Mitochondrial respiration in isolated DCTs with different transport activities. Seahorse XF Cell Mito Stress Tests were used to study the mitochondrial respiration in isolated DCTs with chronically altered transport activity. For each test, three DCT samples isolated from an experimental mouse were compared to three TAL samples isolated from a control mouse. Experimental and control mice were matched in genetic background, age, and gender. The left panel showed the OCR tracing of a representative test of three similar tests (see the other two tests in Supplemental Figure 3). The dashed arrows indicate the injections of ETC complex inhibitors and uncoupler FCCP. All OCRs were normalized by tubule length. The right panel summarizes the results of mitochondrial respiration parameters from three tests. *p < 0.05, and NS: statistically not significant between two groups using a two-tailed Student unpaired-t test. Data are presented as mean ± SD. (A) DCTs isolated from Wnk4 knockout (Wnk4 KO) or wild-type (WT) littermates were compared (p values: basal <0.0001, ATP-linked =0.0002, maximal <0.0001, spare = 0.05, n=9). (B) DCTs isolated from Wnk4D561A/+ knockin or WT controls were compared (p values: basal <0.0001, ATP-linked = 0.004, maximal <0.0001, spare = 0.17, n=9). (C) DCTs isolated from mice treated with 30mg/kg/day furosemide (2-wk furosemide) or vehicle were compared (p values: basal = 0.80, ATP-linked = 0.009, maximal = 0.58, spare = 0.42, n=9).
Figure 10.
Figure 10.
Mitochondrial morphology and DNA copy number of isolated TALs and DCTs with different transport activities. (A, B) Representative TEM images of TALs (A) and DCTs (B) isolated from Wnk4 knockout (Wnk4 KO), wild-type (WT), and Wnk4D561A/+ knockin (Wnk4D561A/+) mice. (C) Representative TEM images of isolated TALs from vehicle-treated (Vehicle) and 2-week furosemide-treated (2-wk furosemide) mice. Mitochondrial volume density (p values: TALs: Wnk4 KO vs. WT=0.0002; Wnk4D561A/+ vs. WT=0.0011; Wnk4 KO vs. Wnk4D561A/+<0.0001; DCTs: Wnk4 KO vs. WT =0.0003; Wnk4D561A/+ vs. WT<0.0001; Wnk4 KO vs. Wnk4D561A/+<0.0001; Vehicle vs. 2-wk furosemide: 0.003; n=6 tubules for A, B; n=10 for C, using a two-tailed Student unpaired-t test), length (p values: TALs: Wnk4 KO vs. WT <0.0001; Wnk4D561A/+ vs. WT =0.12; Wnk4 KO vs. Wnk4D561A/+<0.0001; DCTs: Wnk4 KO vs. WT<0.0001; Wnk4D561A/+ vs. WT<0.0001; Wnk4 KO vs. Wnk4D561A/+<0.0001; n=50 mitochondria, using Mann-Whitney test), and cristae density (p values: TALs: Wnk4 KO vs. WT=0.002; Wnk4D561A/+ vs. WT=0.58; Wnk4 KO vs. Wnk4D561A/+=0.02; DCTs: Wnk4 KO vs. WT=0.004; Wnk4D561A/+ vs. WT=0.59; Wnk4 KO vs. Wnk4D561A/+=0.02; Vehicle vs. 2-wk furosemide<0.0001; n=50 mitochondria, using Mann-Whitney test) were analyzed using Image J (see methods). (D) The mitochondrial DNA (Nd1 gene) to nuclear DNA (Hk1 gene) ratios in isolated TALs or DCTs with decreased or increased transport activity (p values: WT TALs vs. Wnk4 KO TALs=0.0008; WT DCTs vs. Wnk4 KO DCTs=0.05, Vehicle TALs vs. Furo TALs=0.04, WT TALs vs. Wnk4D561A/+ TALs=0.80, WT DCTs vs. Wnk4D561A/+ DCTs=0.38, Vehicle DCTs vs. Furo DCTs=0.08; n≥3, using a two-tailed Student unpaired-t test). Data are presented as mean ± SD. *p < 0.05, and NS: statistically not significant between the two groups (Furo: furosemide; IMM: inner mitochondrial membrane; OMM: outer mitochondrial membrane; TEM: transmission electron microscopy)

Update of

References

    1. Wang Z, Ying Z, Bosy-Westphal A, et al. Specific metabolic rates of major organs and tissues across adulthood: evaluation by mechanistic model of resting energy expenditure. Am J Clin Nutr. 2010; 92: 1369–1377. - PMC - PubMed
    1. Kanako KI, Sakakibara N, Murayama K, et al. BCS1L mutations produce Fanconi syndrome with developmental disability. J Hum Genet. 2022; 67: 143–148. - PubMed
    1. Niaudet P, Rötig A. Renal involvement in mitochondrial cytopathies. Pediatr Nephrol. 1996; 10: 368–373. - PubMed
    1. Viering D, Schlingmann KP, Hureaux M, et al. Gitelman-like syndrome caused by pathogenic variants in mtDNA. J Am Soc Nephrol. 2022; 33: 305–325. - PMC - PubMed
    1. Viering DHHM, Vermeltfoort L, Bindels RJM, Deinum J, de Baaij JHF. Electrolyte disorders in mitochondrial cytopathies: a systematic review. J Am Soc Nephrol. 2023; 34: 1875–1888. - PMC - PubMed

Substances

LinkOut - more resources