. 2024 Jun 4;121(23):e2314213121.
doi: 10.1073/pnas.2314213121. Epub 2024 May 28.

Deep sequencing of Phox2a nuclei reveals five classes of anterolateral system neurons

Affiliations

Deep sequencing of Phox2a nuclei reveals five classes of anterolateral system neurons

Andrew M Bell et al. Proc Natl Acad Sci U S A. .

Abstract

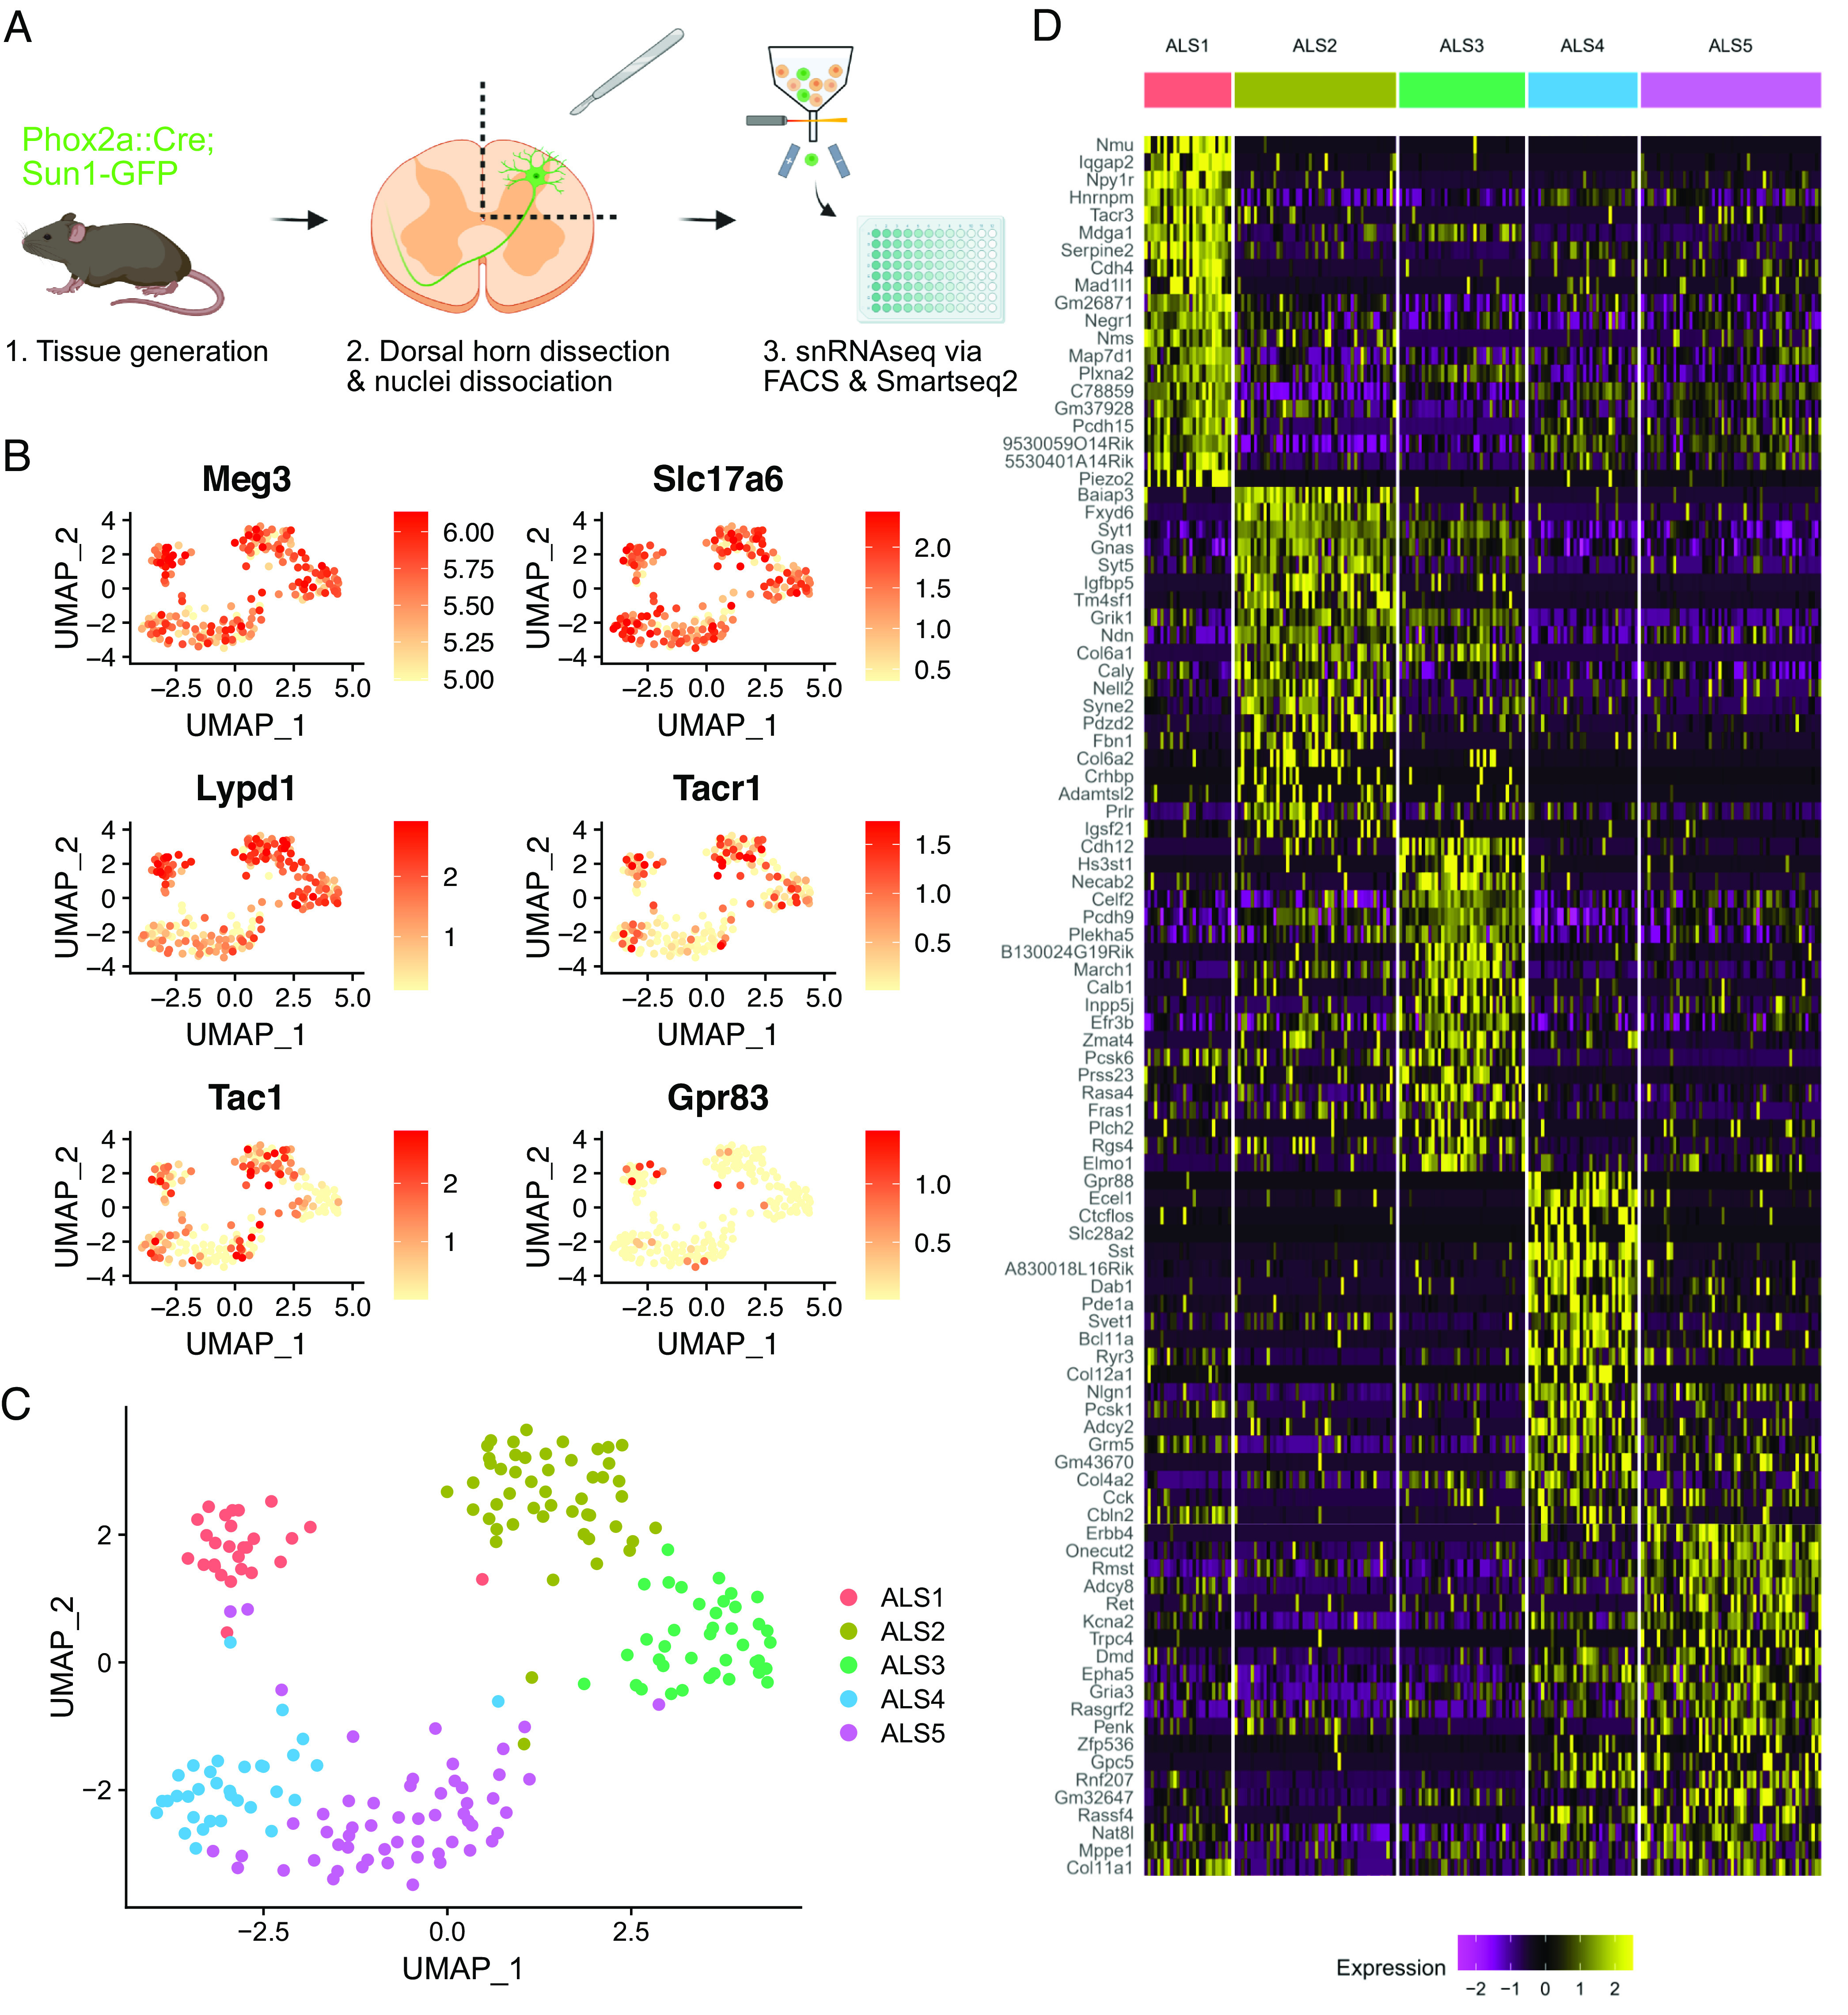
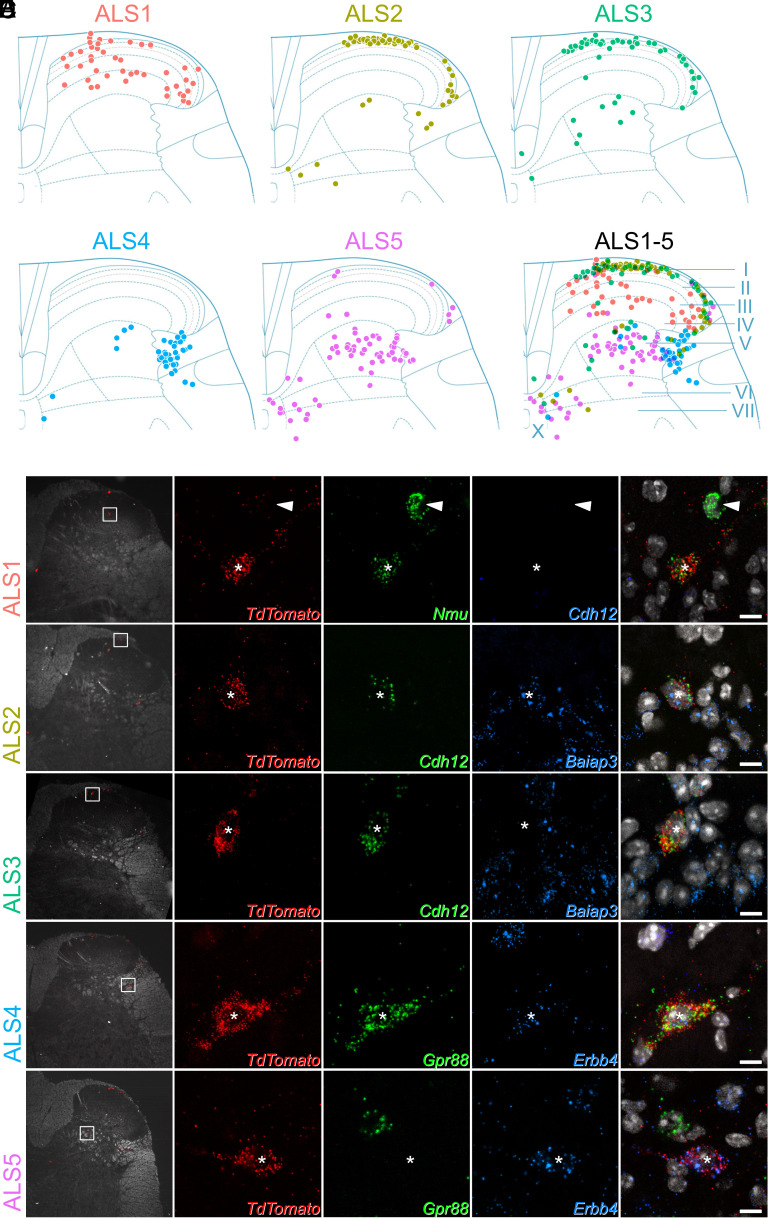
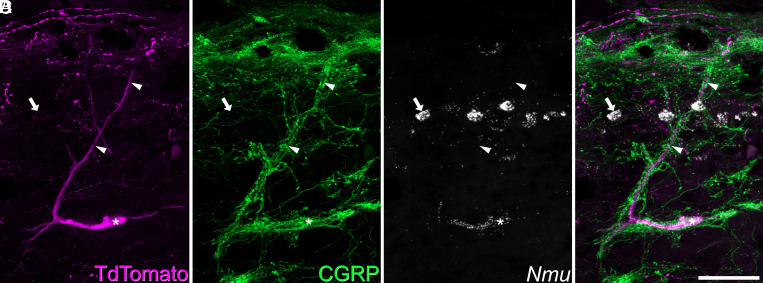
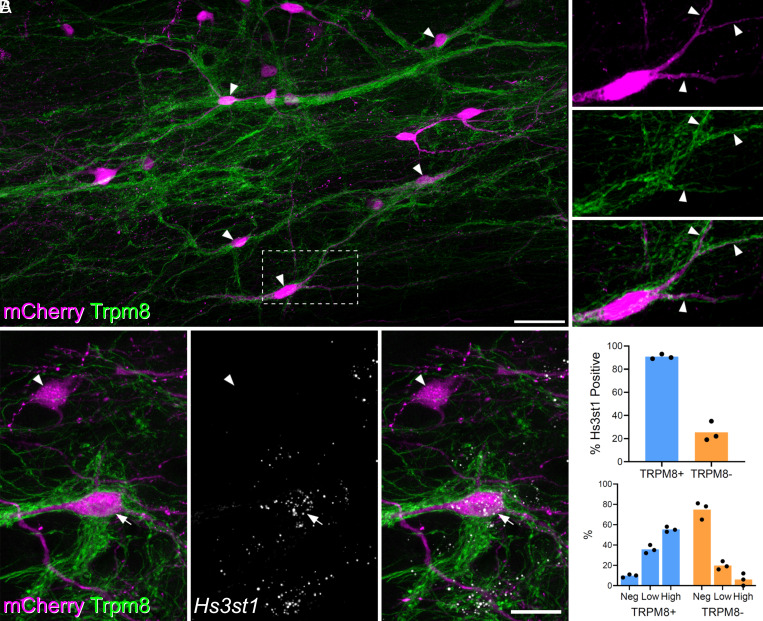
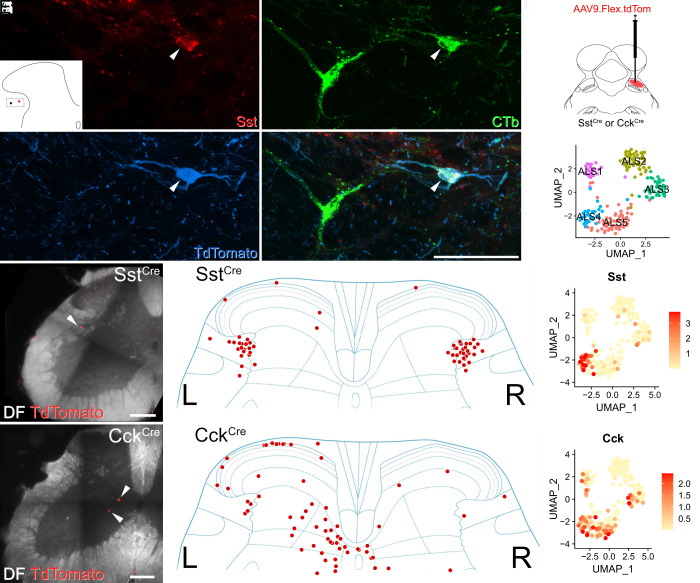
The anterolateral system (ALS) is a major ascending pathway from the spinal cord that projects to multiple brain areas and underlies the perception of pain, itch, and skin temperature. Despite its importance, our understanding of this system has been hampered by the considerable functional and molecular diversity of its constituent cells. Here, we use fluorescence-activated cell sorting to isolate ALS neurons belonging to the Phox2a-lineage for single-nucleus RNA sequencing. We reveal five distinct clusters of ALS neurons (ALS1-5) and document their laminar distribution in the spinal cord using in situ hybridization. We identify three clusters of neurons located predominantly in laminae I-III of the dorsal horn (ALS1-3) and two clusters with cell bodies located in deeper laminae (ALS4 and ALS5). Our findings reveal the transcriptional logic that underlies ALS neuronal diversity in the adult mouse and uncover the molecular identity of two previously identified classes of projection neurons. We also show that these molecular signatures can be used to target groups of ALS neurons using retrograde viral tracing. Overall, our findings provide a valuable resource for studying somatosensory biology and targeting subclasses of ALS neurons.

Keywords: ALS projection neuron; pain; spinal cord; temperature sensation.


Conflict of interest statement

Competing interests statement:The authors declare no competing interest.

Figures

Fig. 1.
Fig. 1.
Transcriptomic clusters identified in the Phox2a::Cre mouse. (A) Schematic of the experimental workflow. (B) UMAP feature plots showing gene expression across 206 single nuclei included in the final analysis. Meg3 and Slc17a6 are markers of neurons and excitatory neurons, respectively. Lypd1, Tacr1, Tac1, and Gpr83 are previously proposed markers of ALS neurons or ALS neuron subsets. (C) UMAP plot showing the five clusters (ALS1–5) detected within Phox2a nuclei. (D) Heatmap showing the single-nucleus expression profile of 206 nuclei organized by the clusters ALS1–5. Twenty genes are shown per cluster, representing the top differentially expressed genes according to the adjusted P-value.
Fig. 2.
Fig. 2.
Laminar location of cells belonging to each cluster. (A) Plots showing the location of cells in each cluster. Each dot represents a single Phox2a cell with the appropriate in situ marker gene expression. Locations of the laminae are indicated in the lower right plot. Additional data to support cluster assignment are in SI Appendix, Fig. S8. (BF) In situ hybridization signals seen with probes directed against TdTomato and mRNAs that were used to define each of the clusters in tissue from Phox2a::Cre;Ai9 mice. In each case, the Left pane shows a low-magnification view to indicate the location of the cell, with a box indicating the area seen at high magnification in the remaining panes. The Right pane is a merged image with each type of in situ hybridization signal superimposed on nuclear staining (gray). Each set of high-magnification images contains a single TdTomato-positive Phox2a cell, which is marked with an asterisk. These cells are positive for Nmu (B), Cdh12 and Baiap3 (C), Cdh12, but not Baiap3 (D), Gpr88 and Erbb4 (E), and Erbb4, but not Gpr88 (F). The arrowhead in (B) shows another neuron that is positive for Nmu but not for TdTomato. High-magnification scans are single confocal optical sections. (Scale bar: 10 μm.)
Fig. 3.
Fig. 3.
Expression of Nmu by a Phox2a+ antenna cell. Combined in situ hybridization and immunohistochemistry performed on a sagittal section of the lumbar spinal cord from a Phox2a::Cre;Ai9 mouse revealed that 94%, (92 to 97%, n = 3) of antenna cells were Nmu-positive. (A and B) show immunostaining for TdTomato and CGRP, while (C) shows in situ hybridization signal for Nmu, and (D) is a merged image. A large TdTomato-labeled cell is indicated with an asterisk. It has a long dorsal dendrite (marked with arrowheads) that is surrounded by numerous CGRP-immunoreactive axons, indicating that this is an antenna cell. In situ hybridization shows that this cell expresses Nmu mRNA, which is also present in many small interneurons in lamina II (one shown with an arrow). This image is a projection of confocal optical sections (1 μm z-separation) taken through the full 12 μm thickness of the section. (Scale bar: 50 μm.)
Fig. 4.
Fig. 4.
Projection cells with dense Trpm8 input are likely to correspond to ALS3. (A) Horizontal section through lamina I showing dense innervation of spinoparabrachial neurons (retrogradely labeled with AAV.mCherry injected into the lateral parabrachial area, LPb) by GFP-labeled axons in a Trpm8Flp;RCE:FRT mouse. Arrowheads indicate mCherry-positive cells that receive numerous contacts from GFP-labeled (TRPM8) axons. The box indicates the area that is enlarged to the right of the main image. This shows staining for mCherry and GFP separately and in a merged view. Note that the cell body and dendrites (3 indicated with arrowheads) are associated with GFP-labeled axons. Main and Inset images are maximum projection of 63 and 16 (respectively) optical sections at 0.5 μm z-spacing. (Scale bar: 50 μm.) (B) Combined immunohistochemistry and fluorescent in situ hybridization on a horizontal section through lamina I from another Trpm8Flp;RCE:FRT mouse that had received an injection of AAV.mCherry into the LPb. Two retrogradely labeled (mCherry-positive) cells are seen. One of these (arrow) is densely coated with GFP-labeled (TRPM8) axons, while the other (arrowhead) is not. The cell with numerous TRPM8 contacts contains Hs3st1 mRNA, whereas the other cell lacks this mRNA. These images are a projection of confocal optical sections (1 μm z-separation) taken through the full 12 μm thickness of the section. (Scale bar: 20 μm.) (C) Quantification of Hs3st1 transcripts on mCherry cells with dense TRPM8 innervation (blue bars, TRPM8+) and mCherry cells that lacked dense TRPM8 innervation (orange bars, TRPM8-). Each dot represents data from a single mouse.
Fig. 5.
Fig. 5.
Retrograde viral tracing of ALS cells. (AD) Immunohistochemistry showing the presence of somatostatin (Sst) in ALS neurons in lateral lamina V. The lateral lamina V area of a lumbar transverse spinal cord section from a Phox2a::Cre;Ai9 that had received an injection of CTb into the LPb is shown. The section has been stained for Sst, CTb, and TdTomato, and these are shown separately in (AC) and merged in (D). Two CTb-labeled ALS neurons are present, and the location of these is shown in the Inset in (A). One of these is a Phox2a cell (marked with an arrowhead) and is also positive for Sst. Images are a maximum projection of six optical sections at 1 µm z-spacing. (Scale bar: 50 μm.) (EL) Retrograde labeling of molecularly defined subclasses of ALS neurons. (E) A schematic of the approach used. AAV.flex.TdTomato was injected into the right LPb of either SstCre or CckCre mice (n = 2 for each genotype). This resulted in labeling of Cre-expressing ALS cells in the lumbar spinal cord. (F) UMAP plot showing the five clusters. Representative images of retrogradely labeled cells are shown in (G) and (J) (Scale bars: 200 μm.). In SstCre animals, traced cells were seen mainly in reticulated lateral lamina V bilaterally as shown in (H). Cells traced in CckCre animals were present across the superficial and deep dorsal horn and are mainly contralateral to the injection site (K). In both cases, these distributions are consistent with the pattern of expression of the mRNAs across the clusters, as shown in UMAP plots (I) and (L).

Update of

References

    1. Wang L. H., Ding W. Q., Sun Y. G., Spinal ascending pathways for somatosensory information processing. Trends Neurosci. 45, 594–607 (2022). - PubMed
    1. Wercberger R., Basbaum A. I., Spinal cord projection neurons: A superficial, and also deep, analysis. Curr. Opin. Physiol. 11, 109–115 (2019). - PMC - PubMed
    1. Ma Q., A functional subdivision within the somatosensory system and its implications for pain research. Neuron 110, 749–769 (2022). - PMC - PubMed
    1. Javed S., Viswanathan A., Abdi S., Cordotomy for intractable cancer pain: A narrative review. Pain Phys. 23, 283–292 (2020). - PubMed
    1. Brown D. C., Agnello K., Intrathecal substance P-saporin in the dog: Efficacy in bone cancer pain. Anesthesiology 119, 1178–1185 (2013). - PMC - PubMed