. 2024 May 28;134(15):e173602.
doi: 10.1172/JCI173602.

Induced CD8α identifies human NK cells with enhanced proliferative fitness and modulates NK cell activation

Affiliations

Induced CD8α identifies human NK cells with enhanced proliferative fitness and modulates NK cell activation

Celia C Cubitt et al. J Clin Invest. .

Abstract

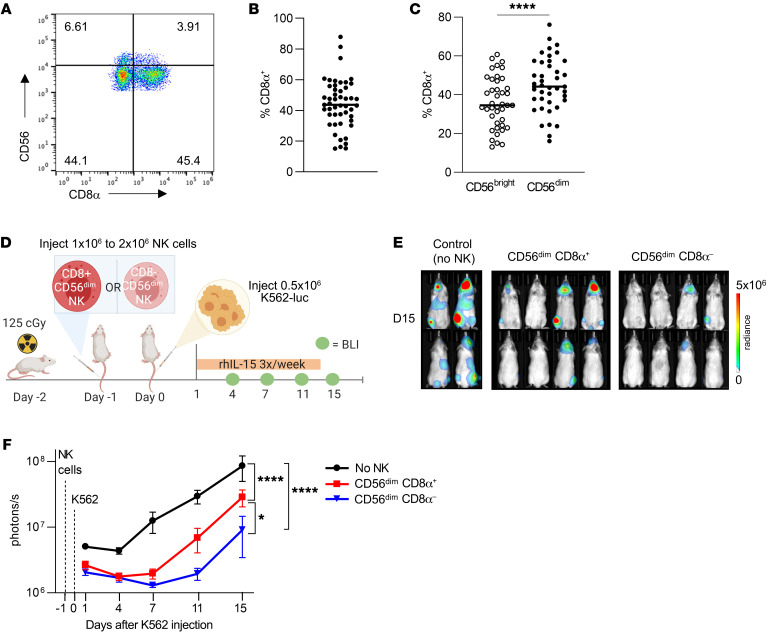
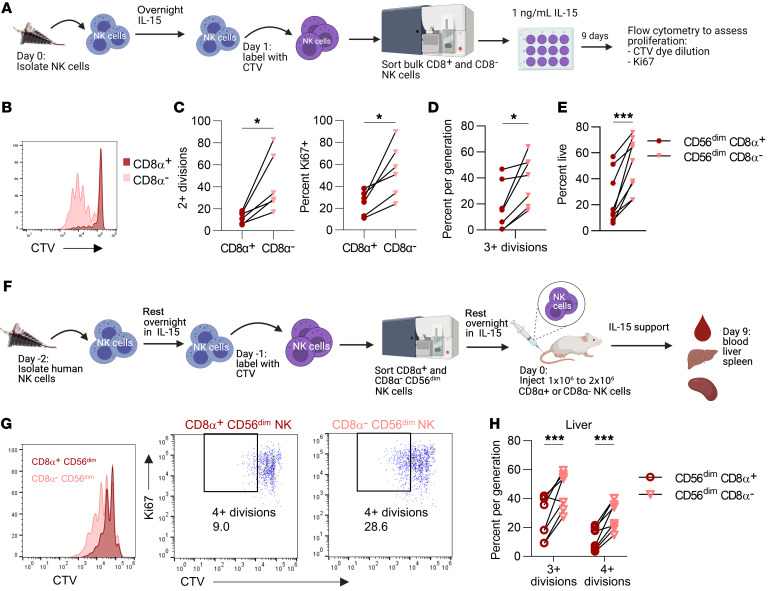
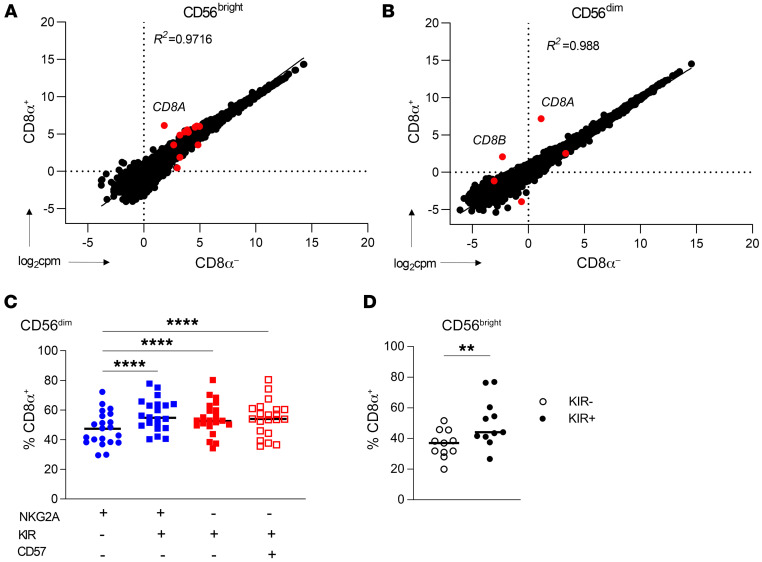
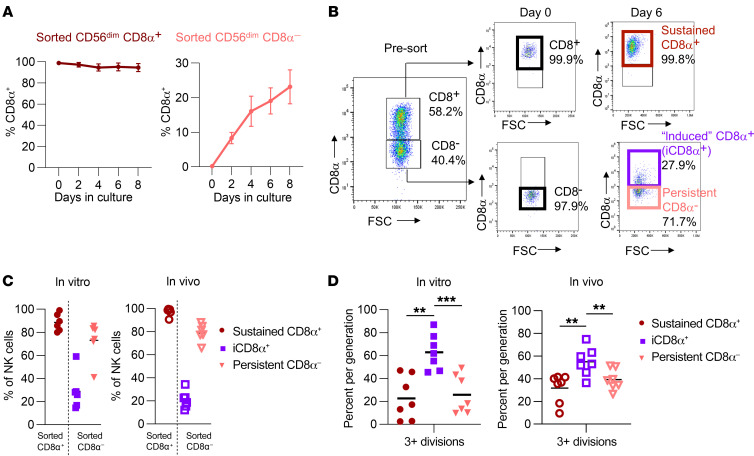
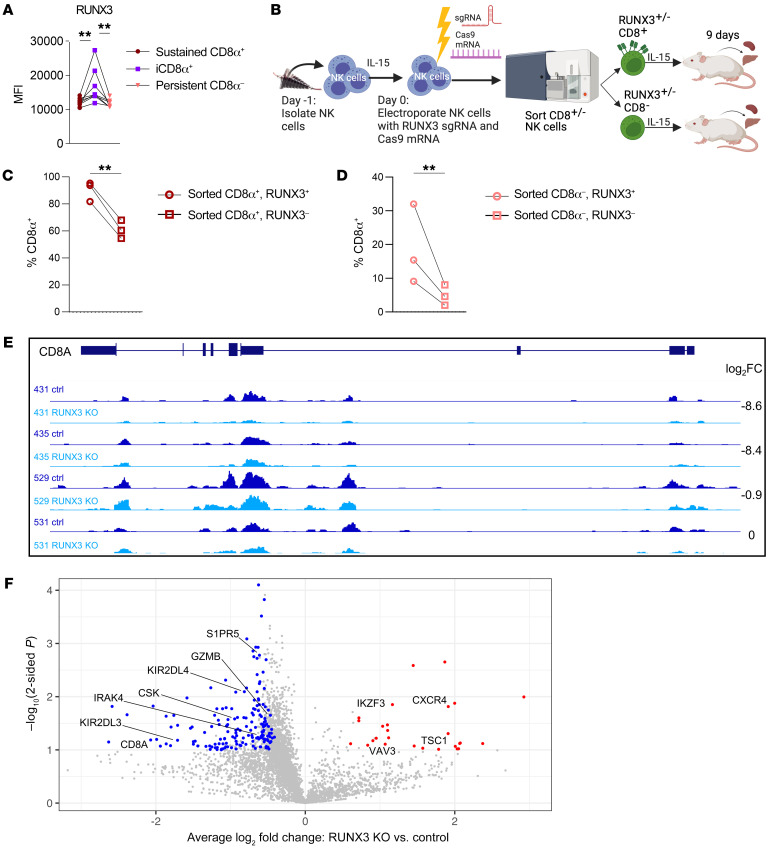
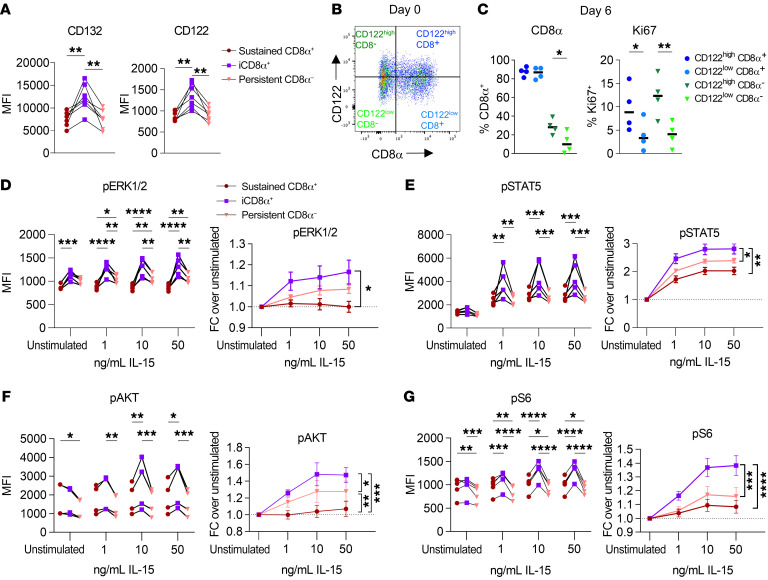
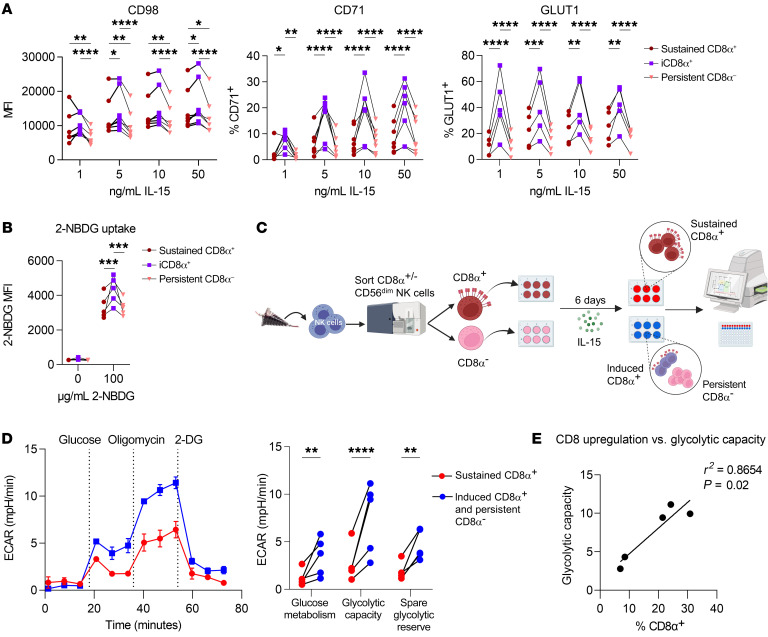
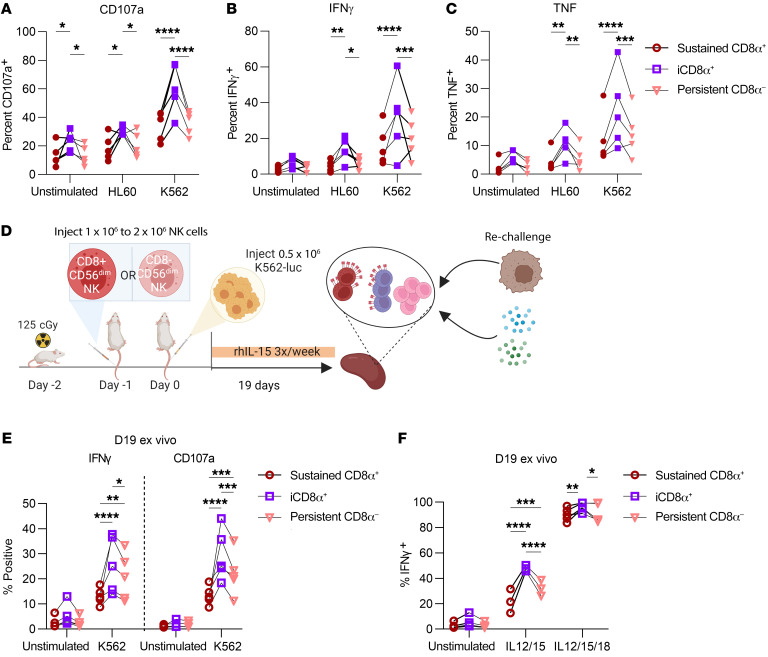
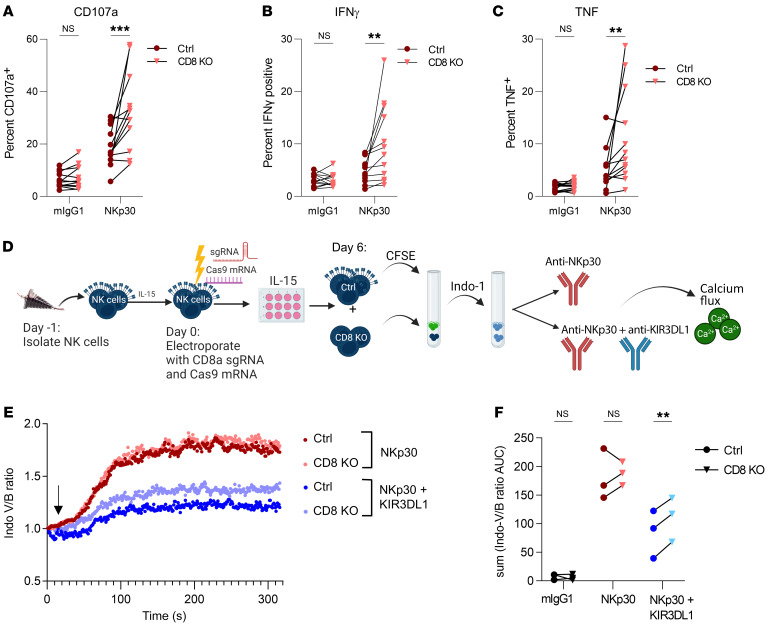
The surface receptor CD8α is present on 20%-80% of human (but not mouse) NK cells, yet its function on NK cells remains poorly understood. CD8α expression on donor NK cells was associated with a lack of therapeutic responses in patients with leukemia in prior studies, thus, we hypothesized that CD8α may affect critical NK cell functions. Here, we discovered that CD8α- NK cells had improved control of leukemia in xenograft models compared with CD8α+ NK cells, likely due to an enhanced capacity for proliferation. Unexpectedly, we found that CD8α expression was induced on approximately 30% of previously CD8α- NK cells following IL-15 stimulation. These induced CD8α+ (iCD8α+) NK cells had the greatest proliferation, responses to IL-15 signaling, and metabolic activity compared with those that sustained existing CD8α expression (sustained CD8α+) or those that remained CD8α- (persistent CD8α-). These iCD8α+ cells originated from an IL-15Rβhi NK cell population, with CD8α expression dependent on the transcription factor RUNX3. Moreover, CD8A CRISPR/Cas9 deletion resulted in enhanced responses through the activating receptor NKp30, possibly by modulating KIR inhibitory function. Thus, CD8α status identified human NK cell capacity for IL-15-induced proliferation and metabolism in a time-dependent fashion, and its presence had a suppressive effect on NK cell-activating receptors.

Keywords: Cancer; Immunology; Innate immunity; NK cells.


Conflict of interest statement

Conflict of interest: TAF and MMBE have pending patents (15/983,275; 62/963,971; PCT/US2019/060005) licensed to Wugen Inc., and have equity in, receive royalties from, and consult for Wugen Inc . JAF has pending patents (WO 2019/152387; US 63/018,108) that are licensed to Kiadis and a mAb licensed to EMD Millipore. MBH has patent US8895020B2. CCC has equity in Pionyr Immunotherapeutics, and DARG receives consulting fees from Cartography Inc. TAF reports research funding from the NIH during the conduct of the study, equity in and research funding and consulting fees from Wugen Inc., research funding from ImmunityBio, HCW Biologics, and Affimed, consulting fees from Kiadis, Takeda, AI Proteins, Smart Immune, and Affimed, and other support from Indapta and OrcaBio.

Figures

Figure 1
Figure 1. Sorted CD8α NK cells have enhanced tumor control in vivo.
(A) Representative flow plot showing CD8α expression on CD56bright and CD56dim NK cells. (B). Percentage of freshly isolated healthy donor human NK cells that expressed CD8α. (C) Percentage of freshly isolated NK cells, gated into CD56bright or CD56dim cells, that expressed CD8α. n = 49. ****P < 0.0001, by 2-tailed, paired Student’s t test. (DF) CD56dimCD8α+ and CD56dimCD8α NK cells were sorted from primary human NK cells and rested overnight in 1 ng/mL IL-15. The next day, approximately 1 × 10⁶ to 2 × 10⁶ CD8α+ CD56dim or CD8αCD56dim NK cells were injected i.v. via the tail vein into NSG mice (Day –1). The following day (Day 0), 0.4 × 10⁶ to 0.5 × 10⁶ K562-CBR-luciferase (K562-luc) cells were injected i.v. into the tail vein. NK cells were supported with i.p. rhIL-15 three times/week, and tumor burden was assessed via BLI on days 1, 4, 7, 11, and 15 after tumor injection. (D) Experimental schema. (E) Representative BLI images from 1 of 3 independent experiments on day 15 and (F) summary data showing tumor burden as the mean ± SEM within the indicated groups. n = 5 unique donors; n = 3 independent experiments; n = 8–10 mice in each group. *P < 0.05 and ****P < 0.0001, by mixed-effects model with Holm-Šídák correction for multiple comparisons.
Figure 2
Figure 2. Sorted CD8α NK cells have enhanced proliferation and survival in vitro and in vivo.
(AE) Freshly isolated NK cells were labeled with CTV, sorted on the basis of CD8α expression, and cultured with 1 ng/mL IL-15 in vitro for 7 days. (A) Experimental schema. (B) Representative histogram of CTV dilution in CD8α+ and CD8α NK cells at day 7. Percentage of NK cells with (C) 2 or more divisions or Ki67 expression at day 7. n = 6 donors and 3 independent experiments. (DE) CD8α+ or CD8α CD56dim NK cells were labeled with CTV, sorted, and cultured in vitro in 1 ng/mL IL-15 for 9 days. (D) Proliferation was assessed by CTV dye dilution. Data are shown as the percentage of NK cells that had undergone the indicated number of divisions. (E) Cell death was assessed by staining with annexin V and 7AAD (live = annexin V, 7AAD). n = 7–9 donors and 4 independent experiments. (FH) Sorted CD8α+CD56dim and CD8αCD56dim NK cells were labeled with CTV and injected i.v. into different NSG mice. Human NK cells were supported with i.p. injections of rhIL-15 3 times/week. (F) Experimental schema. Proliferation was assessed by CTV dye dilution and Ki67 expression. (G) Representative histogram and (H) summary data showing the percentage of NK cells that had undergone the indicated number of divisions in the liver of NSG mice. Data represent the mean ± SEM. *P < 0.05 and ***P < 0.001, by (CE) paired, 2-tailed Student’s t test and (H) 2-way ANOVA with Holm-Šídák correction for multiple comparisons. n = 9 donors and 5 independent experiments.
Figure 3
Figure 3. CD8α does not mark a distinct, terminally differentiated population.
(A and B) Bulk RNA-Seq was performed on freshly isolated (A) CD56bright or (B) CD56dim NK cells sorted on the basis of CD8α expression (CD3CD19CD14). Data are shown as the log2-normalized expression of protein-coding genes in CD8α+/– cell populations. Red dots indicate genes that were statistically significantly differentially expressed (adjusted P < 0.05). n = 6 unique donors. The R2 value was derived from simple linear regression of gene expression data. (C and D). Peripheral blood NK cells were stained for the expression of markers of NK maturation. (C) CD56dim NK cell maturation stages were identified based on expression of NKG2A, KIR (KIR3DL1, KIR2DL1, and KIR2DL2/3), and CD57, with maturation increasing from left to right. Data are shown as the percentage of each subset that was positive for CD8α expression. n = 28 donors. (D) Expression of CD8α within NKG2ACD56brightKIR or KIR+ (KIR3DL1+, KIR2DL1+, and KIR2DL2/3+) NK cells. n = 11 donors. Data represent the mean ± SEM. **P < 0.01 and ****P < 0.0001, by (C) 2-way ANOVA with Holm-Šídák correction for multiple comparisons and (D) paired, 2-tailed Student’s t test.
Figure 4
Figure 4. IL-15 modulates CD8α expression.
(A) CD8α+/–CD56dim NK cells were sorted and cultured in 5 ng/mL IL-15 for up to 8 days. Plots show the percentage of NK cells positive for CD8α expression on cells originally sorted as CD8α+ or CD8α cells. n = 2–3 donors and 2 independent experiments. (B) Gating strategy for identification of induced CD8α+ versus sustained CD8α+ and persistent CD8α NK cells. Sorted CD8α+ NK cells that remained CD8α+ were defined as sustained CD8α+ cells. Sorted CD8α NK cells that upregulated CD8α during culturing were defined as induced CD8α+ cells. Sorted CD8α NK cells that remained CD8α during culturing were defined as persistent CD8α cells. FSC, forward scatter. (C and D) CD8α+/–CD56dim NK cells were sorted and cultured in 1 ng/mL IL-15 in vitro or injected into NSG mice supported with i.p. rhIL-15 3 times/week. Data are shown as the percentage of NK cells positive for CD8α expression after 9 days. n = 8 donors and 4 independent experiments. (D) Percentage of NK cells that underwent 3 or more divisions within the indicated subsets in vitro or in vivo in NSG mice 9 days after sorting. n = 6–9 donors and 4 independent experiments. Data represent the mean ± SEM. **P < 0.01 and ***P < 0.001, by 2-way ANOVA with Holm-Šídák correction for multiple comparisons.
Figure 5
Figure 5. RUNX3 regulates CD8α expression.
(A) MFI of RUNX3 on day 6 within the indicated cell populations cultured in 1 ng/mL IL-15. n = 5 donors and 3 independent experiments. (BD) NK cells were electroporated with RUNX3 sgRNA and Cas9 mRNA, cultured in vitro for 48 hours, and then sorted on the basis of CD8α expression. NSG mice were injected i.v. with sorted CD8α+/– control or RUNX3-KO cells and supported with i.p. rhIL-15 for 9 days. (B) Experimental schema. (C and D) Percentage of human NK cells in the liver expressing CD8α within RUNX3+ or RUNX3 cell populations that were originally sorted as (C) CD8α+ or (D) CD8α. n = 3 donors and 2 independent experiments. Data represent the mean ± SEM. **P < 0.01, by (A) repeated-measures 1-way ANOVA and (C and D) ratio-paired, 2-tailed Student’s t test. (E and F) NK cells were electroporated with control or RUNX3 gRNA and Cas9 mRNA, cultured in 5 ng/mL IL-15 for 9 days, and assessed for H3K27ac abundance using CUT&TAG. (E) Integrative Genomics Viewer (IGV) tracks showing H3K27ac peaks within the CD8A locus for control (ctrl) and RUNX3-KO donor pairs, with the log2 FC for each donor pair for the entire CD8A locus shown. (F) Volcano plot showing the average log2 FC and –log10 P value, determined by matched, paired, 2-tailed Student’s t test, for donor-matched RUNX3-KO versus control H3K27ac signal for gene loci. Genes in highlighted in red had significantly increased H3K27ac signal, and genes in blue had significantly decreased H3K27ac signal in RUNX3-KO cells with log2 FC cutoffs of absolute (0.5) or higher for at least 3 of 4 donors. We filtered genes with P < 0.05 using the results of 1-sided Student’s t tests (peaks lost/lower in KO or peaks gained/higher in KO), a log2 fold change ≤ -0.5 or ≥ 0.5, respectively) in at least 3 of 4 donors, for genes expressed in NK cells. n = 4 donors and 2 independent experiments.
Figure 6
Figure 6. iCD8α NK cells have greater IL-15R expression and signaling.
(A) Primary human NK cells were sorted into CD8α+CD56dim and CD8αCD56dim populations and cultured in vitro in 1 ng/mL IL-15 for 6 days. CD132 and CD122 expression was assessed by flow cytometry, gated within the indicated subsets. n = 7 donors and 3 independent experiments. (B and C) CD56dim NK cells were sorted from freshly isolated primary human NK cells, based on high and low expression of CD122 and CD8α, and cultured for 6 days in vitro in 5 ng/mL IL-15. (B) Representative flow plots of the gating strategy for cell sorting. (C) Summary data showing the percentage of NK cells positive for CD8α or Ki67 expression that were originally sorted as CD122hi or CD122lo and CD8α+ or CD8α. n = 4 donors, and 2 independent experiments. (DG) CD8α+ CD56dim and CD8αCD56dim NK cells were sorted and cultured for 6 days in vitro with 1 ng/mL IL-15. Cells were cultured briefly (1 hour) in cytokine-free media prior to stimulation for 1 hour with the indicated concentrations of IL-15. Data are shown as the MFI and FC over the unstimulated condition within the indicated cell subsets for (D) p-ERK1/-2, (E), p-STAT5, (F) p-AKT, and (G) p-S6. n = 5 donors and 2 independent experiments. Data represent the mean ± SEM.*P < 0.05, **P < 0.01, ***P < 0.001, and ****P < 0.0001, by (A and C) repeated-measures, 1-way ANOVA and (DG) 2-way ANOVA with Holm-Šídák correction for multiple comparisons.
Figure 7
Figure 7. Induced CD8α expression is associated with metabolic activity in NK cells.
(A) Primary human NK cells were sorted into CD8α+CD56dim and CD8αCD56dim populations and cultured for 6 days in vitro with the indicated concentrations of IL-15. The MFI and percentage of NK cells positive for nutrient receptors CD98, CD71, and GLUT1 are shown. n = 7 donors, 3 independent experiments. (BE) CD8α+ and CD8α NK cells were sorted and cultured for 6 days in vitro with 1 ng/mL IL-15. (B) Uptake of the fluorescent glucose analog 2-NBDG at various concentrations was assessed by flow cytometry. The MFI of 2-NBDG in the indicated subsets is shown. n = 7 donors and 3 independent experiments. (CE) Metabolic parameters were determined using the Seahorse XFe96 Extracellular Flux Analyzer. (C) Experimental schema. (D) Donor glycolysis stress test trace from 1 representative donor, with measurement of the extracellular acidification rate (ECAR). The stimulation and summary data show glucose metabolism, glycolytic capacity, and glycolytic reserve. (E) Simple linear regression showing the relationship between the extent of CD8α upregulation within the sorted CD8α CD56dim NK cells and the glycolytic capacity recorded via Seahorse. n = 6 donors and 4 independent experiments. Data represent the mean ± SEM. *P < 0.05, **P < 0.01, ***P < 0.001, and ****P < 0.0001, by 2-way ANOVA with Holm-Šídák correction for multiple comparisons.
Figure 8
Figure 8. Induction of CD8α corresponds to enhanced in vitro and ex vivo responses to tumors.
(AC) Primary human NK cells were sorted into CD8α+CD56dim and CD8αCD56dim populations and cultured in vitro in 5 ng/mL IL-15 for 6 days. NK cells were stimulated with HL60 or K562 leukemic cell lines at a 1:1 effector/target ratio for 6 hours, with GolgiPlug/Stop for the last 5 hours. Data are shown as the percentage of NK cells expressing (A) CD107a, (B) IFN-γ, or (C) TNF within the indicated cell subsets. n = 5 donors and 3 independent experiments. (DF) CD56dim NK cells were sorted on the basis of CD8α expression, and approximately 1 × 10⁶ to 2 × 10⁶ CD8α+CD56dim or CD8αCD56dim NK cells were injected i.v. into the tail vein of NSG mice (day –1). The next day (day 0), 0.4 × 10⁶ to 0.5 × 10⁶ K562-CBR cells were injected i.v. into the tail vein. NK cells were supported with i.p. rhIL-15 three times/week. (D) Experimental schema. (E and F) On day 19, splenocytes were isolated from NK cell–treated mice and stimulated ex vivo with (E) K562s (10:1 splenocyte/K562 ratio) or (F) cytokines for 6 hours (20 ng/mL IL-12; 100 ng/mL IL-15; 100 ng/mL IL-18) with GolgiPlug/Stop in the last 5 hours. The percentage of NK cells positive for the indicated marker and gated within the indicated cell subsets is shown. n = 5 donors and 3 independent experiments. Data represent the mean ± SEM. *P < 0.05, **P < 0.01, ***P < 0.001, and ****P < 0.0001, by 2-way ANOVA with Holm-Šídák correction for multiple comparisons.
Figure 9
Figure 9. CD8A KO enhances cytokine secretion and degranulation following NKp30 stimulation.
(AC) Primary human NK cells were electroporated with Cas9 mRNA and sgRNA targeting CD8A or a control gRNA (TRAC) and cultured in vitro in 1 ng/mL IL-15 for 6 days. NK cells were stimulated with plate-bound antibodies (10 μg/mL) targeting NKp30 or mouse IgG1 isotype control antibody for 6 hours, with GolgiPlug/Stop for the last 5 hours. The percentage of NK cells positive for expression of (A) CD107a, (B) IFN-γ, or (C) TNF is shown. n = 13 donors and 7 independent experiments. (DF) Control or CD8-KO cells were labeled with 50 nM CFSE, mixed together at a 1:1 ratio, and then labeled with the UV-excitable, Ca2+-sensing dye Indo-1. A mAb (5 μg/mL) targeting NKp30 alone or NKp30 (5 μg/mL) and KIR3DL1 (0.2 μg/mL) was added for 20 minutes at 4°C, cells were washed, and then cross-linking was induced at the indicated time point (black arrow) using goat anti–mouse IgG (10 μg/mL). Calcium flux was measured by flow cytometry. (E) Data are shown as the normalized ratio of Indo-violet over Indo-blue within control or CD8-KO cells as a function of time in cells from 1 representative donor. (F) Sum of the AUC of the normalized Indo-violet/Indo-blue ratio for all time points in control and CD8-KO cells. n = 3 donors and 3 independent experiments; donors were prescreened to ensure KIR3DL1 and CD8α expression of greater than 30%. Data represent the mean ± SEM. **P < 0.01 and ***P < 0.001, by (AC) 2-way ANOVA with Holm-Šídák correction for multiple comparisons and (FG) paired, 2-tailed Student’s t test.

Comment in

  • Striking a balance: the Goldilocks effect of CD8α expression on NK cells

References

    1. Caligiuri MA. Human natural killer cells. Blood. 2008;112(3):461–469. doi: 10.1182/blood-2007-09-077438. - DOI - PMC - PubMed
    1. Yokoyama WM, et al. The dynamic life of natural killer cells. Annu Rev Immunol. 2004;22:405–29. doi: 10.1146/annurev.immunol.22.012703.104711. - DOI - PubMed
    1. Cerwenka A, Lanier LL. Natural killer cells, viruses and cancer. Nat Rev Immunol. 2001;1(1):41–49. doi: 10.1038/35095564. - DOI - PubMed
    1. Cooper MA, et al. The biology of human natural killer-cell subsets. Trends Immunol. 2001;22(11):633–640. doi: 10.1016/S1471-4906(01)02060-9. - DOI - PubMed
    1. Lanier LL. NK cell recognition. Ann Rev Immunol. 2005;23:225–274. doi: 10.1146/annurev.immunol.23.021704.115526. - DOI - PubMed