. 2024 Sep-Oct;21(5):1591-1600.
doi: 10.1109/TCBB.2024.3406341. Epub 2024 Oct 9.

Circular Clustering With Polar Coordinate Reconstruction

Circular Clustering With Polar Coordinate Reconstruction

Xiaoxiao Sun et al. IEEE/ACM Trans Comput Biol Bioinform. 2024 Sep-Oct.

Abstract

There is a growing interest in characterizing circular data found in biological systems. Such data are wide-ranging and varied, from the signal phase in neural recordings to nucleotide sequences in round genomes. Traditional clustering algorithms are often inadequate due to their limited ability to distinguish differences in the periodic component θ. Current clustering schemes for polar coordinate systems have limitations, such as being only angle-focused or lacking generality. To overcome these limitations, we propose a new analysis framework that utilizes projections onto a cylindrical coordinate system to represent objects in a polar coordinate system optimally. Using the mathematical properties of circular data, we show that our approach always finds the correct clustering result within the reconstructed dataset, given sufficient periodic repetitions of the data. This framework is generally applicable and adaptable to most state-of-the-art clustering algorithms. We demonstrate on synthetic and real data that our method generates more appropriate and consistent clustering results than standard methods. In summary, our proposed analysis framework overcomes the limitations of existing polar coordinate-based clustering methods and provides an accurate and efficient way to cluster circular data.


Figures

Fig. 1.
Fig. 1.
Common approach to perform clustering analysis for data specified in polar coordinates. A. Illustration converting from polar coordinates (r,θ) to Cartesian coordinates (x,y) as (3). B.1. Seven example sample points in polar coordinates are shown for illustration purposes (points in the same shaded area belong to the same class). B.2. Transforming points in B.1 to Cartesian coordinates (points correspondences indicated by color). C.1. Clustering result generated by K-means method (K=2) where the green point (r=0.2,θ=π/2) in B.1 is incorrectly classified. C.2. Clustering result generated by DBSCAN method (neighborhood search radius ϵ=0.5 and minimum number of neighbors nmin=2) where the purple point (r=0.2,θ=3π/2) in B.1 is incorrectly classified. C.3. Clustering result generated by the hierarchical clustering method. The figure on the left graphically illustrates the way the linkages group the objects into a hierarchy of clusters, and the figure on the right is the corresponding dendrogram of clusters where the x-axis corresponds to the leaf nodes of the tree, and the y-axis corresponds to the linkage distances between clusters. Similar to the K-means and DBSCAN methods, incorrect grouping arises for the sample points that are labeled as 4, 5, and 7.
Fig. 2.
Fig. 2.
Reconstruction of polar coordinates on the rectangular plane X,Y using cylindrical coordinates. Mapping the points in polar coordinates to the lateral surface of the cylinder where the height is equal to the radius of the polar coordinates system (h=r) and the base circle has radius R. Values of R control the weights of θ as described in (5). By flattening the lateral surface, we obtain a 2-dimensional rectangular space where the X-axis represents θ and Y-axis represents r. The length of the X-axis equals the circumference of the base circle (i.e., C=2πR).
Fig. 3.
Fig. 3.
Period repetition for revealing the correct distance between sample points. A. Within-clustering variance is unchanged after period repetition, so the clustering result within each repeated period is identical to the original space. No changes will be introduced by period repetition. Clustering results always match with the ground truth. B. Within-clustering variance is changed after period repetition, leading to the emergence of novel centroid types. This iterative process helps the clustering algorithm to capture the accurate distance between individual samples. As the dataset size or clusters increase, more repetitions are necessary to ensure the correct patterns occur robustly.
Fig. 4.
Fig. 4.
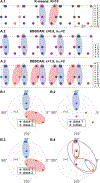
Solving circularity with period repetition for K-means, DBSCAN and hierarchical clustering methods. A.1. In the given example, with four-period repetition, the question of finding two classes within one period becomes the question of finding 10 = 2 × (4 + 1) classes within the total 5 = 4 + 1 periods with the K-means method. Points with the same color belong to the same class. We can locate the correct cluster output in the middle (i.e., 3 rd) period. A.2. We apply the same DBSCAN parameters as Fig. 1 (ϵ=0.5 and nmin=2) on the rectangular plane with five periods. Points with the same color belong to the same class. We consistently identify the same pattern for class 1 (four points are classified into the same class repetitively five times, highlighted as blue shadow). All other points that are unclassified are defined as outliers, which are also the outliers defined by given parameters (referred to as label ‘−1’). A.3. We apply DBSCAN with different parameters (ϵ=1.5 and nmin=2) on the rectangular plane with five periods. Two patterns have been identified this time and those two patterns include all 7 sample points, so two classes are found with no outliers. B.1. Clustering result of K-means in A.1. B.2. Clustering result of DBSCAN in A.2. B.3. Clustering result of DBSCAN in A.3. B.4. Clustering result of the hierarchical clustering method with the proposed algorithm, its result is improved from the result shown in Fig. 1 (C.3), and its result is consistent with the K-means and DBSCAN methods where both class 1 and class 2 are included as sub-class (highlighted in red).
Fig. 5.
Fig. 5.
Application to synthetic data (N=50). A. Clustering results with K-means on two groups. First, 50 points are randomly generated based on two classes on the unit cycle (highlighted with the gray shadow). With a smaller R applied, the clustering results have a balanced weight between r and θ, while angle-driven clustering results will be generated when a larger R is used. The angle-driven clustering result is identical to the result generated by FOCC, BOCC, and HEUC [14]. B. Clustering results of multiple groups with K-means and DBSCAN. Another 50 points are randomly generated based on five classes (highlighted with the gray shadow) on the unit cycle. Applying both K-means and DBSCAN on our reconstructed representation yields the ground truth as output. More quantitative comparison results can be found at Tables I and II.
Fig. 6.
Fig. 6.
Application to neural data (N=30). Two subjects are used as examples. The output of K-means with a larger R to capture the difference in θ is identical to the output of another angle-focused circular clustering method (FOCC with K=2, see Fig. 1(B.1) in Appendix A), available online. Additionally, DBSCAN with two sets of parameters is examined. DBSCAN(1) is generated with ϵ=0.25, and nmin=5 and DBSCAN(2) is generated with ϵ=0.2 and nmin=3 for both subjects. The DBSCAN clustering result of Sub#1 shows this subject has consistent similarity within c1 class (green points in DBSCAN(1) and camel points in DBSCAN(2)), while no such observation is seen in Sub#2.
Fig. 7.
Fig. 7.
Hierarchical clustering result on the coding sequences of the first exon of β-globin gene of Human, Chimpanzee, and Mouse. The top raw shows the polar coordinates representation of the dual nucleotides. The bottom row is the corresponding dendrogram of three species.

References

    1. Anand S, Padmanabham P, and Govardhan A, “Effect of distance measures on partitional clustering algorithms using transportation data,” Int. J. Comput. Sci. Inf. Technol, vol. 6, no. 6, pp. 5308–5312, 2015.
    1. Merrell R and Diaz D, “Clustering analyses methods: Strategies and algorithms,” Rev. Theor. Sci, vol. 4, no. 2, pp. 153–158, 2016.
    1. Patil YS and Joshi MR, “Clustering with polar coordinates system: Exploring possibilities,” in Smart Intelligent Computing and Applications, Berlin, Germany: Springer, 2019, pp. 553–560.
    1. Jain AK, Murty MN, and Flynn PJ, “Data clustering: A review,” ACM Comput. Surv, vol. 31, no. 3, pp. 264–323, 1999.
    1. Fell J and Axmacher N, “The role of phase synchronization in memory processes,” Nature Rev. Neurosci, vol. 12, no. 2, pp. 105–118, 2011. - PubMed

Publication types