. 2024 Jul;20(7):4663-4676.
doi: 10.1002/alz.13898. Epub 2024 May 28.

Serum NfL and GFAP as biomarkers of progressive neurodegeneration in TBI

Affiliations

Serum NfL and GFAP as biomarkers of progressive neurodegeneration in TBI

Pashtun Shahim et al. Alzheimers Dement. 2024 Jul.

Abstract

Background: We examined spatial patterns of brain atrophy after mild, moderate, and severe traumatic brain injury (TBI), the relationship between progression of brain atrophy with initial traumatic axonal injury (TAI), cognitive outcome, and with serum biomarkers of brain injury.

Methods: A total of 143 patients with TBI and 43 controls were studied cross-sectionally and longitudinally up to 5 years with multiple assessments, which included brain magnetic resonance imaging, cognitive testing, and serum biomarkers.

Results: TBI patients showed progressive volume loss regardless of injury severity over several years, and TAI was independently associated with accelerated brain atrophy. Cognitive performance improved over time. Higher baseline serum neurofilament light (NfL) and glial fibrillary acidic protein (GFAP) were associated with greater rate of brain atrophy over 5 years.

Discusssion: Spatial patterns of atrophy differ by injury severity and TAI is associated with the progression of brain atrophy. Serum NfL and GFAP show promise as non-invasive prognostic biomarkers of progressive neurodegeneration in TBI.

Highlights: In this longitudinal study of patient with mild, moderate, and severe traumatic brain injury (TBI) who were assessed with paired magnetic resonance imaging (MRI), blood biomarkers, and cognitive assessments, we found that brain atrophy after TBI is progressive and continues for many years even after a mild head trauma without signs of brain injury on conventional MRI. We found that spatial pattern of brain atrophy differs between mild, moderate, and severe TBI, where in patients with mild TBI , atrophy is mainly seen in the gray matter, while in those with moderate to severe brain injury atrophy is predominantly seen in the subcortical gray matter and whiter matter. Cognitive performance improves over time after a TBI. Serum measures of neurofilament light or glial fibrillary acidic protein are associated with progression of brain atrophy after TBI.

Keywords: brain volume; glial fibrillary acidic protein; neurofilament light; tau; traumatic brain injury; ubiquitin C‐terminal hydrolase‐L1.


Conflict of interest statement

The authors declare no conflicts of interest. Author disclosures are available in the supporting information.

Figures
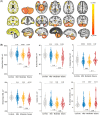
FIGURE 1
FIGURE 1
Lower cross‐sectional brain volumes in patients with TBI at baseline. A, There are significantly lower brain volumes in TBI patients compared to controls at baseline, corrected for multiple comparisons using the Benjamini–Hochberg procedure. The T1‐MR structural slices displayed are axial, coronal, and sagittal and overlaid on average of 15 participants. B, Volume differences in key brain regions are associated with brain atrophy in patients with a history of mild, moderate, and severe TBI, as well as controls. CC, corpus callosum; GM, gray matter, L, left; MR, magnetic resonance; R, right; TBI, traumatic brain injury; WM, white matter.
FIGURE 2
FIGURE 2
Longitudinal changes in brain volume. A, Longitudinal changes in brain volumes calculated as average change in percentage per year in patients with a history of mild, moderate, or severe TBI. The average changes in brain volumes in percentage per year (for ease of interpretability) were calculated by dividing the slope from the linear mixed‐effects model with the intercept for each group and brain region. Bold outlines, < 0.01; dashed outlines < 0.05, Benjamini–Hochberg corrected. Cooler colors indicate decreases in brain volumes and hotter colors indicate increases in brain volumes. B, Examples of longitudinal changes in brain volume across mild, moderate, and severe TBI are shown in the heatmap. The fitted lines indicate mean, and standard errors are from the linear mixed‐effects models covaried for age, education, and sex. The trajectory of brain volume changes at individual level for key brain regions are shown in Figure S1 in supporting information. bankssts, bank of the superior temporal sulcus; CC, corpus callosum; GM, gray matter; L, left; R, right; vCSF, ventricular cerebrospinal fluid; WM, white matter.
FIGURE 3
FIGURE 3
TAI underlies the progression of brain atrophy. A, Correlations between DTI measures of TAI (FA, AD, RD, and MD for CC) at baseline and the rate of change (per year) in MRI‐measured brain atrophy (GM, WM, subcortical GM, and CC volumes). The cooler colors in the heatmap indicate negative correlation and the hotter colors indicate positive. The colors of the brain masks (whole brain GM, whole brain WM, subcortical GM, and CC volumes) in panel (A) correspond to the correlation (r) between various TAI measures (FA, AD, RD, and MD) and atrophy in the WBGM, WBWM, subcortical GM, and CC volumes. B–E, Examples of the correlations summarized in the panel (A). Changes in MRI‐measured atrophy were tested using mixed‐effects models covaried for age, sex, and education. The association between the individual slope from the mixed‐effects model and the baseline biomarker concentrations were tested using Spearman rank correlation (r). All the associations shown in the heatmap were statistically significant. AD, axial diffusivity; CC, corpus callosum; DTI, diffusion tensor imaging; FA, fractional anisotropy; GM, gray matter; MD, mean diffusivity; MRI, magnetic resonance imaging; RD, radial diffusivity; TAI, traumatic axonal injury; WBGM, whole brain gray matter; WBWM, whole brain white matter; WM, white matter.
FIGURE 4
FIGURE 4
Longitudinal changes in cognitive composite scores and quality of life. A–F, Longitudinal changes in cognitive composite scores and quality of life in patients with a history of mild, moderate, and severe TBI. The fitted lines indicate mean, and standard errors are from the linear mixed‐effects models covaried for age, education, and sex. The cognitive composite test results are shown as t score (50 is population mean, +/− 10 is one standard deviation greater or lower). The gray horizontal dashed lines indicate the mean for controls and are overlayed for clarity purposes. The trajectory of changes at individual level for cognitive composite and scores are shown in Figure S2 in supporting information. SWLS, Satisfaction with Life Scale.
FIGURE 5
FIGURE 5
Cross‐sectional associations among serum biomarkers, brain volume, and cognitive assessments. A, Correlation between serum biomarkers and global and regional MRI‐measured brain volumes. All outcome measures were collected median 0.7 years, interquartile range 0.2–1.4 years after injury, but on the same day (± 1 day). In the heatmaps, the brain volumes and the serum biomarker concentrations were standardized for comparison purposes. Cooler colors indicate negative correlations, and hotter colors indicate positive. The correlations were assessed using linear models adjusted for age, sex, education, and time since most recent injury. Bold outlines, < 0.01; dashed outlines < 0.05, corrected for multiple comparison using Benjamini–Hochberg method. B–E, Examples of correlations summarized in the heatmap. F, Correlation between serum biomarkers and quality of life and cognitive composite scores. These associations were calculated in similar fashion as the other plots in this figure. The spline plot including the 95% confidence interval is shown for better depicting the direction of the associations. CC, corpus callosum; GM, gray matter, L, left; MRI, magnetic resonance imaging; R, right; SWLS, Satisfaction with Life Scale; vCSF, ventricular cerebrospinal fluid; WM, white matter.
FIGURE 6
FIGURE 6
Serum NfL at baseline is associated with longitudinal changes in brain volumes. A–G, Concentrations of NfL, GFAP, tau, and UCH‐L1 measured at baseline predicting changes (in cm3 per year) in brain volume over time. B‐G, Examples of the correlations summarized in the heatmap. The changes in brain volumes were tested using linear mixed effects model, covaried for age, sex, and education. The association between the individual slopes from the linear mixed effects model and the baseline serum biomarker concentrations were tested using Spearman sign rank correlation (r). Only the associations that survived multiple comparisons are shown. The cooler colors in the heatmap indicate negative correlation and the hotter colors indicate positive. Bold outlines, < 0.01; dashed outlines < 0.05, Benjamini–Hochberg corrected. GFAP, glial fibrillary acidic protein; GM, gray matter, L, left; NfL, neurofilament light; R, right; vCSF, ventricular cerebrospinal fluid; WBWM, whole brain white matter; WM, white matter; UCH‐L1, ubiquitin carboxy‐terminal hydrolase‐L1.

References

    1. Cole JH, Jolly A, de Simoni S, et al. Spatial patterns of progressive brain volume loss after moderate‐severe traumatic brain injury. Brain. 2018;141:822‐836. - PMC - PubMed
    1. Smith DH, Chen XH, Pierce JE, et al. Progressive atrophy and neuron death for one year following brain trauma in the rat. J Neurotrauma. 1997;14:715‐727. - PubMed
    1. Goddeyne C, Nichols J, Wu C, Anderson T. Repetitive mild traumatic brain injury induces ventriculomegaly and cortical thinning in juvenile rats. J Neurophysiol. 2015;113:3268‐3280. - PMC - PubMed
    1. Zhou Y, Kierans A, Kenul D, et al. Mild traumatic brain injury: longitudinal regional brain volume changes. Radiology. 2013;267:880‐890. - PMC - PubMed
    1. Ross DE. Review of longitudinal studies of MRI brain volumetry in patients with traumatic brain injury. Brain Inj. 2011;25:1271‐1278. - PubMed

Publication types

MeSH terms

LinkOut - more resources