. 2024 Jun 24;262(2):e240072.
doi: 10.1530/JOE-24-0072. Print 2024 Aug 1.

Deletion of Hsd11b1 suppresses caloric restriction-induced bone marrow adiposity in male but not female mice

Affiliations

Deletion of Hsd11b1 suppresses caloric restriction-induced bone marrow adiposity in male but not female mice

Andrea Lovdel et al. J Endocrinol. .

Abstract

Bone marrow adipose tissue (BMAT) comprises >10% of total adipose mass in healthy humans. It increases in diverse conditions, including ageing, obesity, osteoporosis, glucocorticoid therapy, and notably, during caloric restriction (CR). BMAT potentially influences skeletal, metabolic, and immune functions, but the mechanisms of BMAT expansion remain poorly understood. Our hypothesis is that, during CR, excessive glucocorticoid activity drives BMAT expansion. The enzyme 11β-hydroxysteroid dehydrogenase type 1 (11β-HSD1) amplifies glucocorticoid activity by catalysing intracellular regeneration of active glucocorticoids from inert 11-keto forms. Mice lacking 11β-HSD1 resist metabolic dysregulation and bone loss during exogenous glucocorticoid excess; thus, we hypothesised that 11β-HSD1 knockout mice would also resist excessive glucocorticoid action during CR, thereby restrining BMAT expansion and bone loss. To test this, we first confirmed that 11β-HSD1 is expressed in mouse and human bone marrow. We then investigated the effects of CR in male and female control and 11β-HSD1 knockout mice from 9 to 15 weeks of age. CR increased Hsd11b1 mRNA in adipose tissue and bone marrow. Deletion of Hsd11b1 did not alter bone or BMAT characteristics in mice fed a control diet and had little effect on tibial bone microarchitecture during CR. Notably, Hsd11b1 deletion attenuated the CR-induced increases in BMAT and prevented increases in bone marrow corticosterone in males but not females. This was not associated with suppression of glucocorticoid target genes in bone marrow. Instead, knockout males had increased progesterone in plasma and bone marrow. Together, our findings show that knockout of 11β-HSD1 prevents CR-induced BMAT expansion in a sex-specific manner and highlights progesterone as a potential new regulator of bone marrow adiposity.

Keywords: 11β-HSD1; bone; bone marrow adipose tissue; caloric restriction; glucocorticoids; progesterone; sex differences.


Conflict of interest statement

The authors declare that there are no conflicts of interest that could be perceived as prejudicing the impartiality of the research reported herein. KEC is a Senior Editor of the Journal of Endocrinology and the Journal of Molecular Endocrinology. KEC was not involved in the review or editorial process for this paper, on which she is listed as an author.

Figures

Figure 1
Figure 1
Transcripts encoding 11β-HSD1 are expressed at similar levels in BM and WAT and are increased with CR. (A) Male and female mice on a C57BL/6JOlaHsd background were fed ad libitum (AL) or a 30% CR diet from 9 to 15 weeks of age (0–6 weeks of CR). At necropsy (15 weeks’ old) tibial BM, iWAT, and gWAT were sampled, and expression of Hsd11b1 was determined by qPCR. Expression is shown relative to levels in AL males after normalising to the geometric mean of the housekeeping genes Ppia, Tbp, and Actb (for BM) or Ppia, Tbp, and Hprt (for iWAT and gWAT). Box-and-whisker plots include the following numbers of mice per group: male AL,n = 7; female AL,n = 8; male CR,n = 11; female CR,n = 13. Within each tissue, significant effects of diet, sex, and diet × sex interactions were determined by two-way ANOVA, with P valuesshown beneath the graph. Within each tissue, significant diet effects (within each sex) or sex effects (within each diet) were determined by Fisher’s LSD test and are indicated by *P < 0.05, **P < 0.01, or ***P < 0.001. (B) HSD11B1 expression in femoral BM or subcutaneous WAT of human donors (n = 16) was assessed by qPCR. Expression is shown as box-and-whisker plots relative to levels in BM after normalising to the geometric mean of the housekeeping genes TBP and RN18S. There was no significant difference between BM and WAT expression, as determined by the Wilcoxon matched-pairs signed-rank test. Source data are provided as a Source Data file.
Figure 2
Figure 2
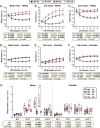
Effects of CR on body mass, composition, and adipose depot masses in WT and Hsd11b1 KO mice. Male and female WT and Hsd11b1 KO mice were fed ad libitum (AL) or a 30% CR diet from 9 to 15 weeks of age (0–6 weeks of CR). (A–F) Each week mice were weighed (A and D) and total fat mass (B and E) and lean mass (C and F) were measured by TD-NMR. (G) Masses of brown adipose tissue (BAT), inguinal WAT (iWAT), gonadal WAT (gWAT), and mesenteric WAT (mWAT) were recorded at necropsy and are shown as % body mass. Data are shown as mean ± s.e.m. (A–F) or as box-and-whisker plots (G) of the following numbers of mice per group: male WT AL, n = 7; male WT CR, n = 11; male KO AL, n = 8; male KO CR,n = 8; female WT AL, n = 8; female WT CR, n = 13; female KO AL, n = 5; female KO CR, n = 8. For A–F, significant effects of diet, sex, or time, and interactions thereof, were determined by mixed-effects models. For G, significant effects of diet and/or KO within each tissue were determined by two-way ANOVA with Šidák’s multiple comparisons tests. P values from ANOVA or mixed models are shown beneath the graphs, as indicated. For G, significant differences between comparable groups are indicated by **P < 0.01 or ***P < 0.001. Source data are provided as a Source Data file. See also Supplementary Fig. 4.
Figure 3
Figure 3
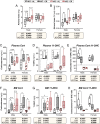
Effects of CR and Hsd11b1 KO on adrenal mass and concentrations of corticosterone and 11-DHC in plasma and BM. Male and female WT and Hsd11b1 KO mice were fed AL or a 30% CR diet as described in Fig. 2. (A and B) Adrenal glands from 15-week-old mice were weighed at necropsy. Masses are shown in grams (A) or as % body mass (B). (C–H) Tail vein blood and femoral BM were collected from 10-week-old mice at necropsy. Concentrations of corticosterone and 11-DHC in plasma (C and D) and BM (F and G) were then measured by LC-MS/MS and used to calculate the ratio of corticosterone: 11-DHC (E and H). Data are shown as box-and-whisker plots of the following numbers of mice per group: male WT AL, n = 7 (A and B) or 8 (C–H); male WT CR, n = 11 (A and B) or 11 (C–H); male KO AL, n = 8 (A and B) or 5 (C–H); male KO CR, n = 8 (A and B) or 5 (C–H); female WT AL, n = 8 (A and B) or 5 (C–H); female WT CR, n = 13 (A,B) or 6 (C–H); female KO AL, n = 5 (A and B) or 8 (C–H); female KO CR,n = 7 (A and B) or 9 (C–H). Significant effects of diet and/or KO within each sex were determined by two-way ANOVA with Šidák’s multiple comparisons tests (A and B) or Fisher’s LSD test (C–H). Overall ANOVA P values are shown beneath the graphs, while significant diet effects within each sex and genotype are indicated by *P < 0.05, **P < 0.01, or ***P < 0.001. Source data are provided as a Source Data file.
Figure 4
Figure 4
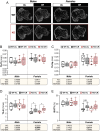
Hsd11b1 KO attenuates CR-induced BMAT expansion in male but not female mice. Male and female WT and Hsd11b1 KO mice were fed AL or a 30% CR diet as described for Figure 2. After necropsy, tibiae were stained with osmium tetroxide prior to µCT for analysis of BM adiposity. (A) Representative µCT scans of osmium tetroxide-stained bones. Stained regions of BMAT are shown in yellow. (B and C) BMAT volumes (Ad.V) from µCT scans of tibiae from males (B) and females (C), presented as % of marrow volume (Ma.V) for the distal, proximal, and total tibia. Data in (B and C) are box-and-whisker plots of the following numbers of mice per group: male WT AL, n = 13; male WT CR, n = 11; male KO AL, n = 8; male KO CR, n = 7; female WT AL, n = 13; female WT CR, n = 14; female KO AL, n = 5; female KO CR, n = 7. For (B), significant effects of diet and/or KO within each sex were determined by two-way ANOVA with Tukey’s multiple comparisons test. Overall ANOVA P values are shown beneath the graphs, while significance for multiple comparisons is shown as for Fig. 3. Source data are provided as a Source Data file.
Figure 5
Figure 5
Effects of CR and Hsd11b1 KO on trabecular bone in the proximal tibia. Male and female WT and Hsd11b1 KO mice were fed AL or a 30% CR diet as described in Fig. 2. After necropsy, calcified tibiae underwent µCT for analysis of trabecular architecture. (A) Representative µCT images showing 2D axial sections of the proximal tibial metaphysis. (B) Trabecular thickness (Tb.Th), mm. (C) Trabecular separation (Tb.Sp), mm. (D) Trabecular number (Tb.N) per mm. (E) Trabecular bone volume fraction (BV/TV), %. Data in B–E are box-and-whisker plots of the following numbers of mice per group: male WT AL, n = 7; male WT CR, n = 11; male KO AL, n = 8; male KO CR, n = 8; female WT AL,n = 8; female WT CR,n = 13; female KO AL,n = 5; female KO CR, n = 8. For B–E, statistical analyses and presentation were done as described in Fig. 3. Source data are provided as a Source Data file.
Figure 6
Figure 6
Effects of CR and Hsd11b1 KO on cortical bone in the tibial diaphysis. Male and female WT and Hsd11b1 KO mice were fed AL or a 30% CR diet as described in Fig. 2. After necropsy, calcified tibiae underwent µCT for analysis of cortical architecture in the proximal tibial diaphysis. (A) Representative µCT images showing 2D axial sections of the proximal tibial diaphysis. (B) Cortical thickness (Ct.Th), mm. (C) Total cross-sectional area inside the periosteal envelope (Tt.Ar), mm2. (D) Cortical bone area (Ct.Ar), mm2. (E) Cortical area fraction (Ct.Ar/Tt.Ar), %. For B–E, statistical analyses and presentation were done as described in Fig. 3. Source data are provided as a Source Data file.
Figure 7
Figure 7
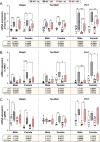
Effects of CR and Hsd11b1 KO on mRNA expression of glucocorticoid target genes in BM and WAT. Male and female WT and Hsd11b1 KO mice were fed AL or a 30% CR diet as described in Fig. 2. (A–C) Tibial BM, iWAT, and gWAT were collected from 10-week-old mice at necropsy and Fkbp5, Tsc22d3, and Per1 mRNA levels were determined by qPCR. Expression of each mRNA is shown relative to levels in AL males or females after normalising to the geometric mean of the housekeeping genes Ppia, Tbp, and Actb (for BM) or Ppia, Tbp, and Hprt (for iWAT and gWAT). Box-and-whisker plots include the following numbers of mice per group: male WT AL, n = 8; male WT CR,n = 8; male KO AL,n = 5; male KO CR,n = 5; female WT AL, n = 5; female WT CR, n = 6; female KO AL,n = 8 (BM, iWAT) or 7 (gWAT); female KO CR, n = 9 (BM, iWAT) or 7 (gWAT). Within each tissue, significant effects of diet and/or KO within each sex were determined by two-way ANOVA. Overall ANOVA P values are shown beneath the graphs. Significant diet effects (within each sex and genotype) or genotype effects (within each sex and diet) were determined by Fisher’s LSD test and are indicated by *P < 0.05, **P < 0.01, or ***P < 0.001. Source data are provided as a Source Data file.
Figure 8
Figure 8
Effects of CR and Hsd11b1 KO on testosterone and progesterone in plasma and BM. Male and female WT and Hsd11b1 KO mice were fed AL or a 30% CR diet as described in Fig. 2. (A–D) Tail vein blood and femoral BM were collected from 10-week-old mice at necropsy. Concentrations of testosterone (A and B) and progesterone (C and D) were then measured by LC-MS/MS. Data are shown as box-and-whisker plots of the following numbers of mice per group: male WT AL, n = 8; male WT CR, n = 8; male KO AL, n = 5; male KO CR,n = 5; female WT AL, n = 5; female WT CR, n = 6; female KO AL, n = 8; female KO CR, n = 9. Statistical analyses and presentation are as described in Fig. 7. Source data are provided as a Source Data file.

Similar articles

Cited by

References

    1. Abrahams L Semjonous NM Guest P Zielinska A Hughes B Lavery GG & Stewart PM. 2012Biomarkers of hypothalamic-pituitary-adrenal axis activity in mice lacking 11β-HSD1 and H6PDH. Journal of Endocrinology 214367–372. (10.1530/JOE-12-0178) - DOI - PMC - PubMed
    1. Attané C Estève D Chaoui K Iacovoni JS Corre J Moutahir M Valet P Schiltz O Reina N & Muller C. 2020Human bone marrow is comprised of adipocytes with specific lipid metabolism. Cell Reports 30949–958.e6. (10.1016/j.celrep.2019.12.089) - DOI - PubMed
    1. Austin MJ Kalampalika F Cawthorn WP & Patel B. 2023Turning the spotlight on bone marrow adipocytes in haematological malignancy and non-malignant conditions. British Journal of Haematology 201605–619. (10.1111/bjh.18748) - DOI - PMC - PubMed
    1. Bravenboer N, Bredella MA, Chauveau C, Corsi A, Douni E, Ferris WF, Riminucci M, Robey PG, Rojas-Sutterlin S, Rosen C, et al.2020Standardised nomenclature, abbreviations, and units for the study of bone marrow adiposity: report of the nomenclature working group of the international bone marrow adiposity society. Frontiers in Endocrinology 10. (10.3389/fendo.2019.00923) - DOI - PMC - PubMed
    1. Cangemi R Friedmann AJ Holloszy JO & Fontana L. 2010Long-term effects of calorie restriction on serum sex-hormone concentrations in men. Aging Cell 9236–242. (10.1111/j.1474-9726.2010.00553.x) - DOI - PMC - PubMed

Publication types

Substances

LinkOut - more resources