. 2024 May 28;21(5):e1004409.
doi: 10.1371/journal.pmed.1004409. eCollection 2024 May.

Barriers to engagement in the care cascade for tuberculosis disease in India: A systematic review of quantitative studies

Affiliations

Barriers to engagement in the care cascade for tuberculosis disease in India: A systematic review of quantitative studies

Tulip A Jhaveri et al. PLoS Med. .

Abstract

Background: India accounts for about one-quarter of people contracting tuberculosis (TB) disease annually and nearly one-third of TB deaths globally. Many Indians do not navigate all care cascade stages to receive TB treatment and achieve recurrence-free survival. Guided by a population/exposure/comparison/outcomes (PECO) framework, we report findings of a systematic review to identify factors contributing to unfavorable outcomes across each care cascade gap for TB disease in India.

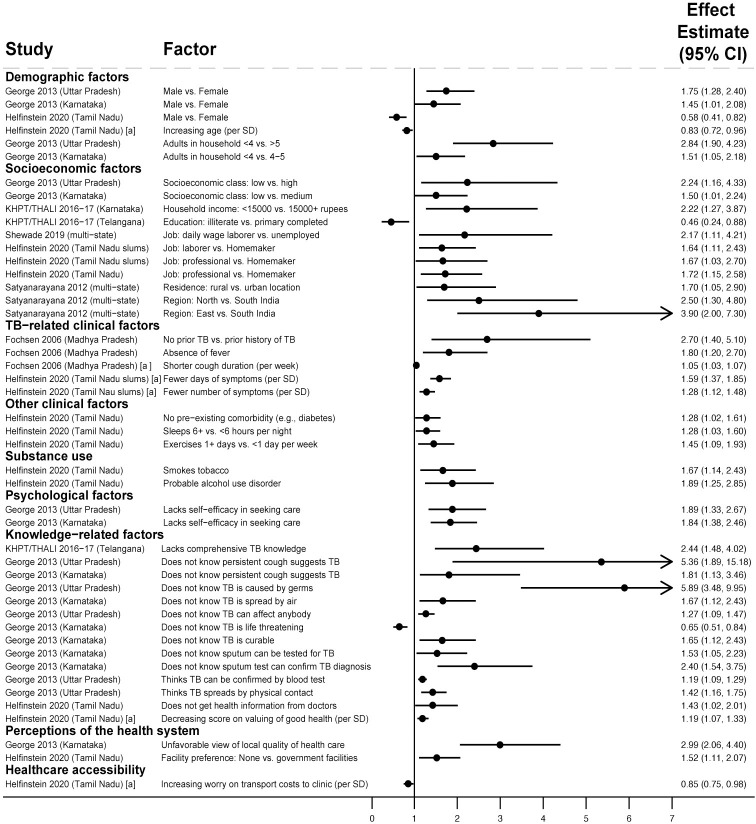
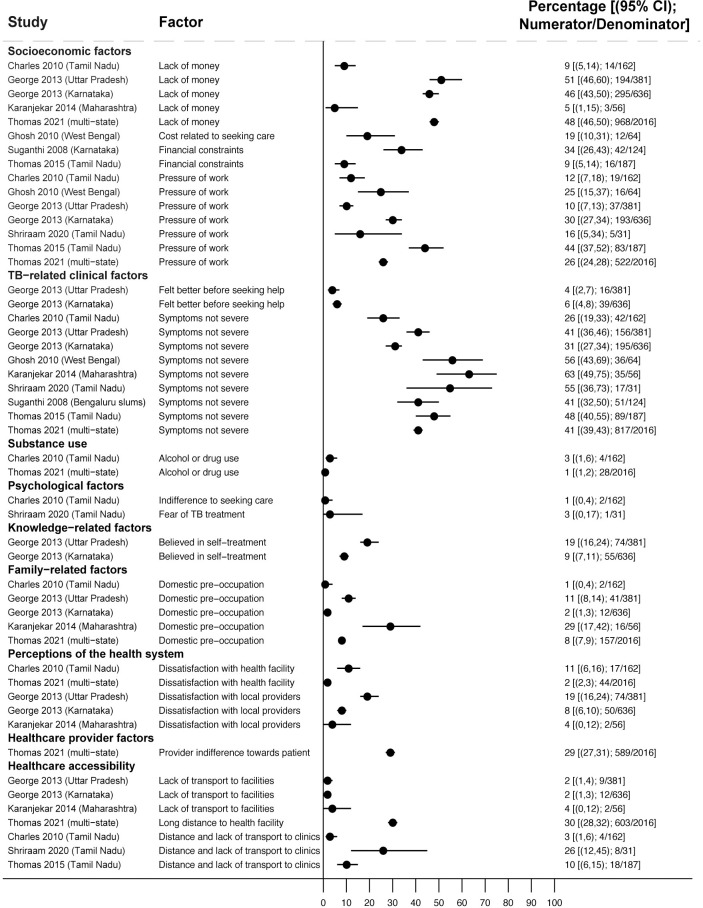
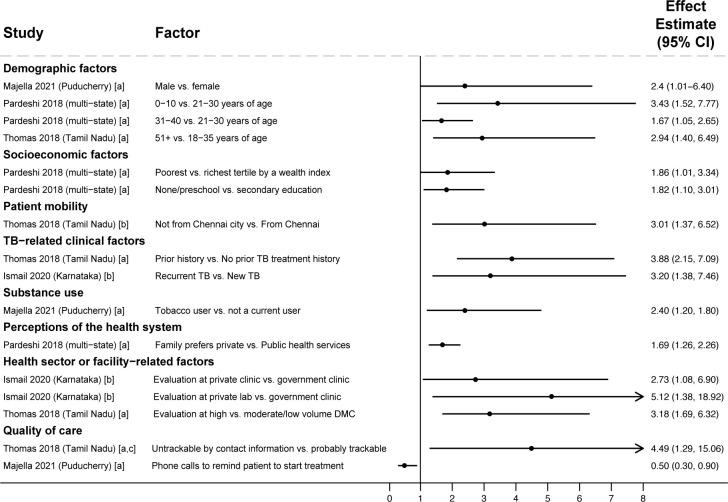
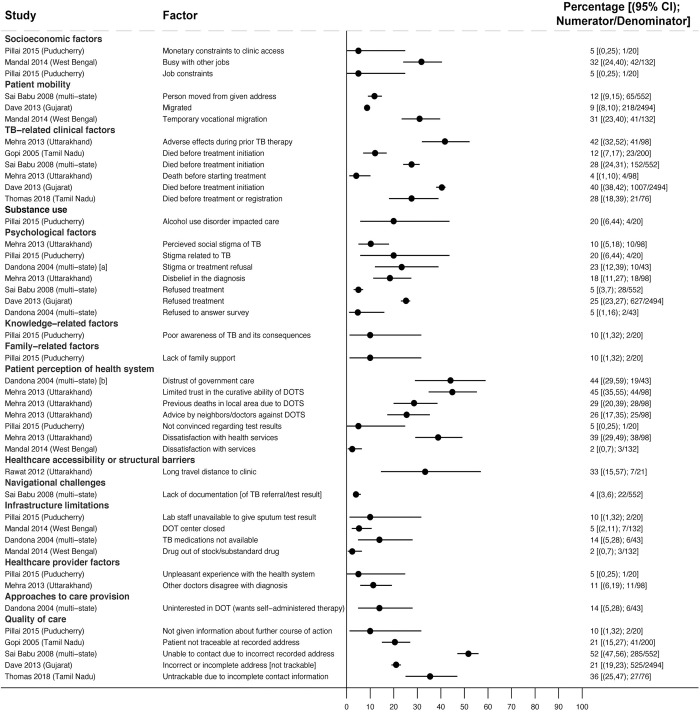
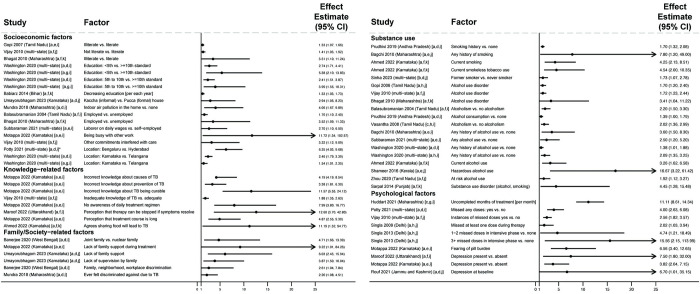
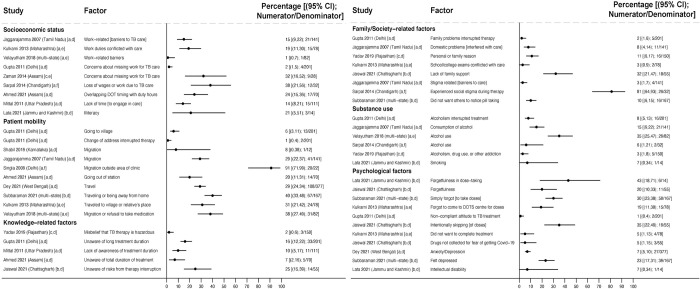
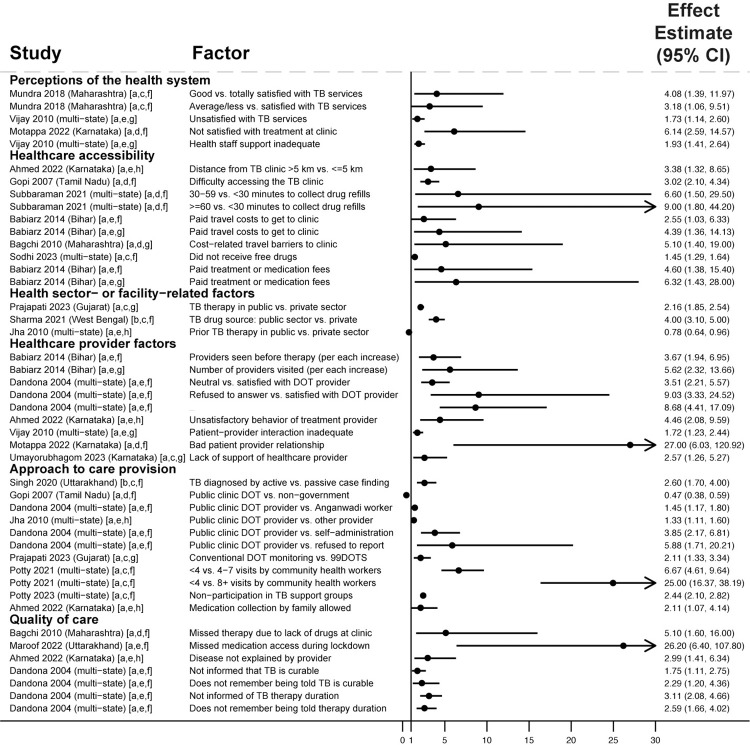
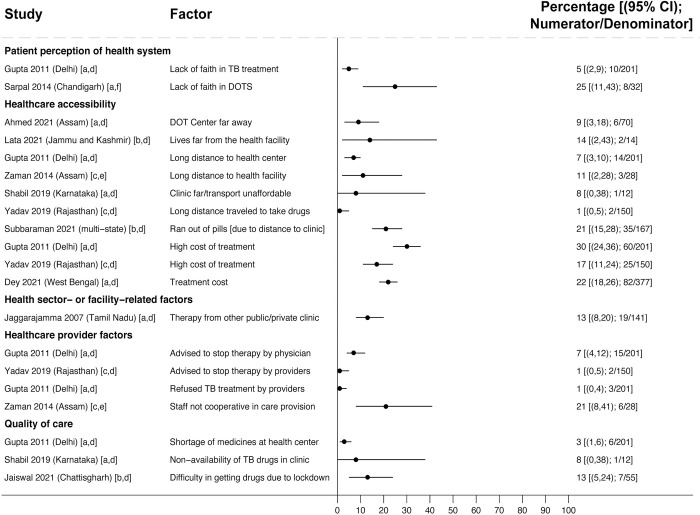
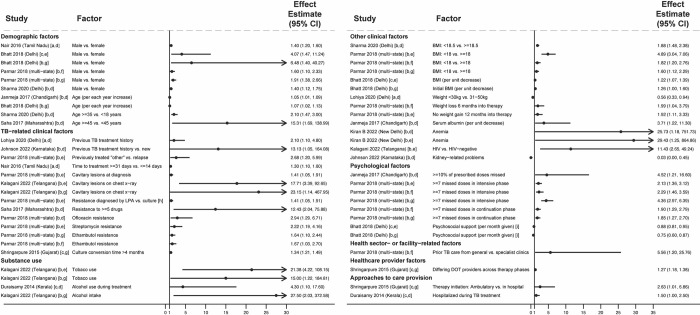
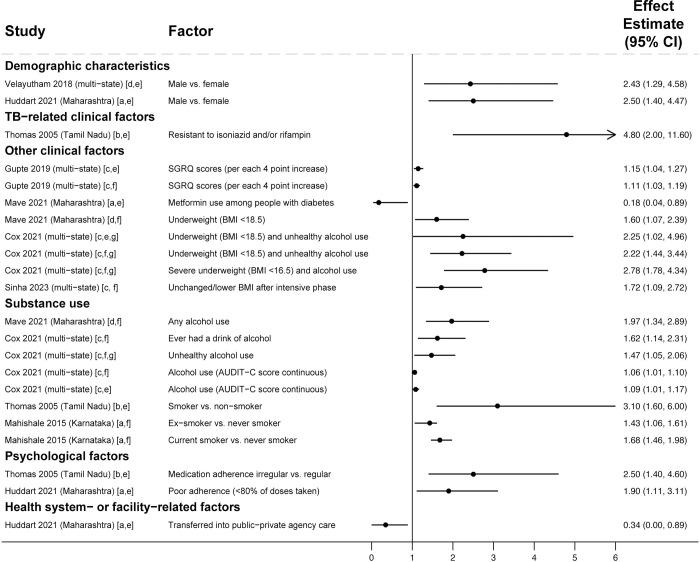
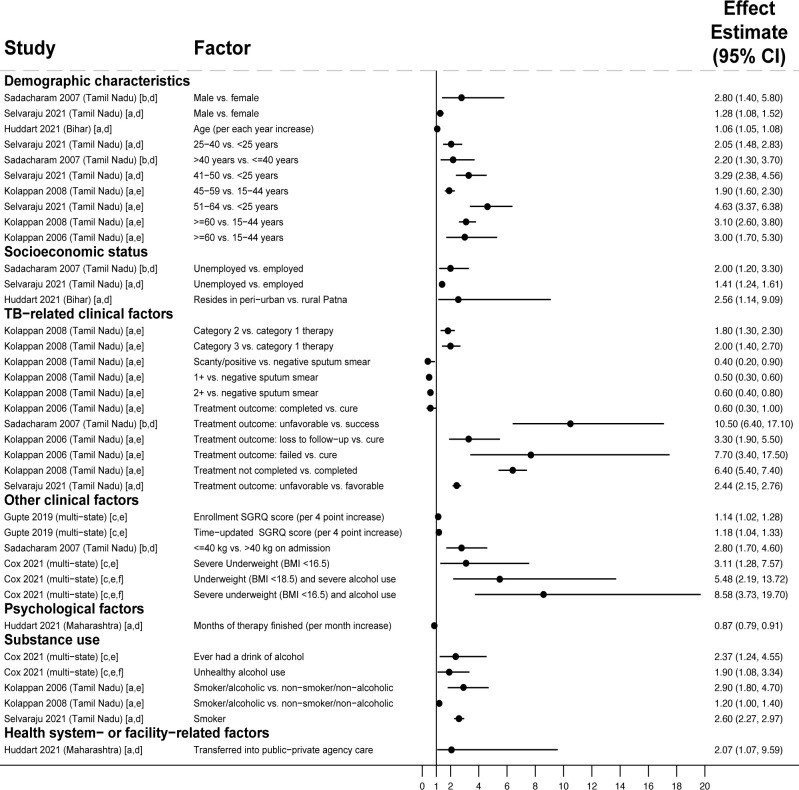
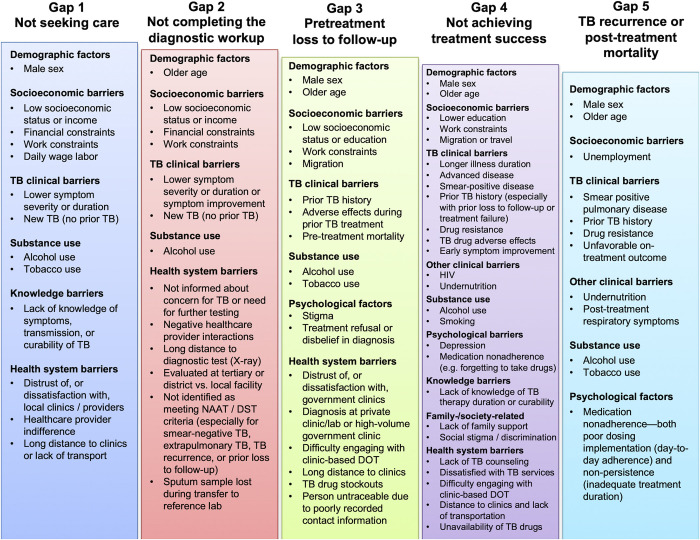
Methods and findings: We defined care cascade gaps as comprising people with confirmed or presumptive TB who did not: start the TB diagnostic workup (Gap 1), complete the workup (Gap 2), start treatment (Gap 3), achieve treatment success (Gap 4), or achieve TB recurrence-free survival (Gap 5). Three systematic searches of PubMed, Embase, and Web of Science from January 1, 2000 to August 14, 2023 were conducted. We identified articles evaluating factors associated with unfavorable outcomes for each gap (reported as adjusted odds, relative risk, or hazard ratios) and, among people experiencing unfavorable outcomes, reasons for these outcomes (reported as proportions), with specific quality or risk of bias criteria for each gap. Findings were organized into person-, family-, and society-, or health system-related factors, using a social-ecological framework. Factors associated with unfavorable outcomes across multiple cascade stages included: male sex, older age, poverty-related factors, lower symptom severity or duration, undernutrition, alcohol use, smoking, and distrust of (or dissatisfaction with) health services. People previously treated for TB were more likely to seek care and engage in the diagnostic workup (Gaps 1 and 2) but more likely to suffer pretreatment loss to follow-up (Gap 3) and unfavorable treatment outcomes (Gap 4), especially those who were lost to follow-up during their prior treatment. For individual care cascade gaps, multiple studies highlighted lack of TB knowledge and structural barriers (e.g., transportation challenges) as contributing to lack of care-seeking for TB symptoms (Gap 1, 14 studies); lack of access to diagnostics (e.g., X-ray), non-identification of eligible people for testing, and failure of providers to communicate concern for TB as contributing to non-completion of the diagnostic workup (Gap 2, 17 studies); stigma, poor recording of patient contact information by providers, and early death from diagnostic delays as contributing to pretreatment loss to follow-up (Gap 3, 15 studies); and lack of TB knowledge, stigma, depression, and medication adverse effects as contributing to unfavorable treatment outcomes (Gap 4, 86 studies). Medication nonadherence contributed to unfavorable treatment outcomes (Gap 4) and TB recurrence (Gap 5, 14 studies). Limitations include lack of meta-analyses due to the heterogeneity of findings and limited generalizability to some Indian regions, given the country's diverse population.

Conclusions: This systematic review illuminates common patterns of risk that shape outcomes for Indians with TB, while highlighting knowledge gaps-particularly regarding TB care for children or in the private sector-to guide future research. Findings may inform targeting of support services to people with TB who have higher risk of poor outcomes and inform multicomponent interventions to close gaps in the care cascade.


Conflict of interest statement

MP is an Academic Editor on PLOS Medicine’s editorial board, and serves as Editor-in-Chief of PLOS Global Public Health. MP also serves as an advisor to the following non-profit agencies in global health: Bill & Melinda Gates Foundation; Foundation for Innovative New Diagnostics; World Health Organization & the Stop TB Partnership. JEH has been a paid consultant for Merck. JEH owns stock in Natera. All other authors have declared that no competing interests exist.

Figures

Fig 1
Fig 1. Factors associated with people in the community not having sought care for TB symptoms (Gap 1).
All studies used multivariable logistic regression with findings reported as adjusted odds ratios [–30]. Estimates greater than 1 represent increased odds of not seeking care; estimates less than 1 represent decreased odds of not seeking care. Arrowheads mean that the upper limit of the CI extends beyond the end of the x-axis. Variables labeled [a] represent continuous variables in regression analyses; effect estimates should be interpreted per one level change in the unit in parentheses. Only statistically significant findings are presented. Some studies in the review with adjusted analyses reported nonsignificant findings for sex [–29], number of adults in the household [29], age [,–29], income or socioeconomic class [24,25], educational attainment [,,–29], employment status [24,25,29], and TB knowledge [27]. CI, confidence interval; KHPT/THALI, Karnataka Health Promotion Trust/Tuberculosis Health Action Learning Initiative; SD, standard deviation; TB, tuberculosis.
Fig 2
Fig 2. Reasons why people with TB symptoms in the community had not sought care (Gap 1).
All studies report the percentage of people reporting a given reason for not seeking care [,–37]. The denominator comprises people who had not sought care in population-based surveys. CI, confidence interval; TB, tuberculosis.
Fig 3
Fig 3. Factors associated with PTLFU after diagnosis among people with drug-susceptible TB (Gap 3).
All studies [–57] used multivariable regression with findings reported as adjusted odds ratios, except Ismail 2020 [40], which reported findings as adjusted risk ratios. Estimates greater than 1 represent increased risk of PTLFU; estimates less than 1 represent decreased risk of PTLFU. Study labels indicate: [a] outcome was non-registration in the TB program, [b] outcome was not starting TB treatment, and [c] inability to track people with TB due to poor recording of phone or address information in diagnostic registers. Only statistically significant findings are presented. Some studies with adjusted analyses reported nonsignificant associations for sex [40,56,57], age [40,55], educational attainment [55], and previous TB treatment [55]. CI, confidence interval; DMC, designated microscopy center; PTLFU, pretreatment loss to follow-up; TB, tuberculosis.
Fig 4
Fig 4. Reasons for PTLFU among people with drug-susceptible TB (Gap 3).
All studies [,–64] report estimates of the percentage of people interviewed who reported a given reason for not starting on, or registering in, TB treatment. Study labels indicate: [a] summarizes the following responses: “no time or busy, afraid that someone would come to know of disease, was very sick, and did not know about TB treatment;” [b] summarizes the following: “did not want treatment at a government center, did not have belief in government doctors, and unable to meet the doctor.” CI, confidence interval; DOT, directly observed therapy; PTLFU, pretreatment loss to follow-up; TB, tuberculosis.
Fig 5
Fig 5. Socioeconomic, psychosocial, and family- or society-related factors associated unfavorable treatment outcomes in people with drug-susceptible TB (Gap 4).
All studies used multivariable regression and reported adjusted effect estimates [,,–,,,,,,–,–,–110,123]. Estimates greater than 1 represent increased risk of unfavorable outcomes; estimates less than 1 represent decreased risk of unfavorable outcomes. Arrowheads mean the upper limits of the CI extend beyond the end of the x-axis. Study labels indicate effect estimates are: [a] odds ratios; [b] incidence rate ratios; or [c] hazard ratios. Study labels indicate outcomes are: [d] any unfavorable treatment outcome; [e] medication nonadherence; [f] loss to follow-up; [g] death; or [h] treatment failure. Study labels indicate that participants are: [i] from a combined population of people with new TB or a prior TB treatment history; [j] people with new TB only; or [k] people with a prior TB treatment history only. Only statistically significant findings are presented. Some studies in the review with adjusted analyses reported nonsignificant findings for educational attainment [,,–86,91,92,94,108], employment status [84,85,87,93,94], TB knowledge [91,123], family support [73,93,105,123], stigma [93,101], smoking [66,84,86,93,98,108,109,123], alcohol use [77,85,93,98,106,124], and medication nonadherence [106]. CI, confidence interval; TB, tuberculosis.
Fig 6
Fig 6. Socioeconomic, psychosocial, and family- or society-related reasons reported for experiencing unfavorable treatment outcomes in people with drug-susceptible TB (Gap 4).
All studies reported estimates of the percentage of people who reported a given reason for experiencing unfavorable outcomes [,,,,–122]. Study labels indicate outcomes are: [a] LTFU, [b] medication nonadherence, or [c] any interruption (defined as a combination of medication nonadherence and LTFU). Study labels indicate patient populations are: [d] from a combined population of people with new TB or a prior TB treatment history; [e] people with new TB only; [f] people with a prior TB treatment history only. CI, confidence interval; DOTS, directly observed therapy short course; LTFU, loss to follow-up; TB, tuberculosis.
Fig 7
Fig 7. Health system factors associated with unfavorable treatment outcomes in people with drug-susceptible TB (Gap 4).
All studies used multivariable regression and reported adjusted effect estimates [,,,,,–89,91,93,104,105,109,110,123,125]. Estimates greater than 1 represent increased risk of unfavorable outcomes; estimates less than 1 represent decreased risk of unfavorable outcomes. Arrowheads mean that the upper limits of the CI extend beyond the end of the x-axis. Study labels indicate effect estimates are: [a] odds ratios; or [b] relative risk ratios. Study labels indicate outcomes are: [c] any unfavorable treatment outcome; [d] medication nonadherence; or [e] loss to follow-up. Study labels indicate that participants are: [f] from a combined population of people with new TB or a prior TB treatment history; [g] people with new TB only; or [h] people with a prior TB treatment history only. Only statistically significant findings are presented. Some studies in the review with adjusted analyses reported nonsignificant findings for health system dissatisfaction [93], proximity to the nearest clinic [41,93,108], treatment costs [91,93], number of providers visited [91], type of DOT provider [41,84], type of case finding approach [127], type of adherence monitoring approach [75,84,105,109], and incorrect and/or inadequate information given by providers [73,93,123]. Anganwadi workers are government-supported community health workers. 99DOTS is a TB digital adherence technology. CI, confidence interval; DOT, directly observed therapy; DOTS, directly observed therapy short course; km, kilometer; TB, tuberculosis.
Fig 8
Fig 8. Health system reasons for experiencing unfavorable treatment outcomes in people with drug-susceptible TB (Gap 4).
Studies report the estimated percentage of people interviewed who reported a given reason for experiencing unfavorable outcomes [,,–,,,–122]. Study labels indicate outcomes are: [a] LTFU; [b] medication nonadherence; or [c] any interruption (defined as a combination of medication nonadherence and LTFU). Study labels indicate participants are: [d] from a combined population of people with new TB or a prior TB treatment history; [e] people with new TB only; [f] people with a prior TB treatment history only. CI, confidence interval; DOTS, directly observed therapy short course; LTFU, loss to follow-up; TB, tuberculosis.
Fig 9
Fig 9. Factors associated with unfavorable treatment outcomes in people with RR or MDR TB (Gap 4).
All studies used multivariable regression and reported adjusted effect estimates [–137,139,140]. Estimates greater than 1 represent increased risk of unfavorable outcomes; estimates less than 1 represent decreased risk of unfavorable outcomes. Arrowheads means that the upper or lower limits of the CI extend beyond the end of the x-axis. Study labels indicate effect estimates are: [a] relative risk ratios; [b] odds ratios; or [c] hazard ratios. Study labels indicate outcomes are: [d] any unfavorable treatment outcome; [e] death; [f] treatment failure; or [g] loss to follow-up. Variable labels indicate: [h] higher mortality among LPA-diagnosed individuals may reflect survivor bias related to culture-diagnosed individuals dying before starting MDR TB treatment; and [i] psychosocial support package comprised nutritional supplementation, cash transfer, and counseling. Only statistically significant findings are presented. Some studies in the review with adjusted analyses reported nonsignificant findings for sex [–135], age [,,–135,137,138], previous TB history [135,137], cavitary disease [135], HIV status [128,134], BMI/weight [134,135,140], and tobacco use [139]. BMI, body mass index; CI, confidence interval; DOT, directly observed therapy; HIV, human immunodeficiency virus; kg, kilogram; LPA, line probe assay; MDR, multidrug-resistant; RR, rifampin-resistant; TB, tuberculosis.
Fig 10
Fig 10. Factors associated with TB recurrence after completing TB treatment as a single outcome or part of a composite outcome (Gap 5).
All studies used multivariable regression and report adjusted effect estimates [77,81,95,106,111,124,151,152,154]. Estimates greater than 1 represent increased risk of TB recurrence; estimates less than 1 represent decreased risk of recurrence. Arrowhead means that the upper limit of the CI extends beyond the end of the x-axis. Study labels indicate effect estimates are: [a] hazard ratios, [b] odds ratios, [c] incidence rate ratios, or [d] relative risk ratios. Other labels indicate: [e] study reported TB recurrence as a single outcome; [f] study reported TB recurrence as a composite outcome including on-treatment outcomes; and [g] unhealthy alcohol use was defined as AUDIT-C score > = 4. Only statistically significant findings are presented. Some studies in the review with adjusted analyses reported nonsignificant findings for sex [81,111], medication adherence [81,106], undernutrition [106], and smoking [106,111]. AUDIT, alcohol use disorder identification test; BMI, body mass index; CI, confidence interval; SGRQ, Saint George Respiratory Questionnaire; TB, tuberculosis.
Fig 11
Fig 11. Factors associated with mortality after TB treatment (without evaluation of TB recurrence) (Gap 5).
All studies used multivariable regression with findings reported as adjusted effect estimates [,,,,–158]. Effect estimates greater than 1 represent increased mortality risk; estimates less than 1 represent decreased mortality risk. Study labels indicate: [a] effect estimates are hazard ratios; [b] effect estimates are odds ratios; [c] effect estimates are incidence rate ratios; [d] posttreatment mortality was reported as a single outcome; [e] posttreatment mortality was reported as part of a composite outcome including on-treatment mortality; and [f] unhealthy or severe alcohol use was defined as AUDIT-C score > = 4. Only statistically significant findings are presented. Some studies in the review with adjusted analyses reported nonsignificant findings for sex [81,95], age [95], and previous TB treatment history (i.e., treatment category) [81,95]. AUDIT, alcohol use disorder identification test; kg, kilogram; BMI, body mass index; SGRQ, Saint George Respiratory Questionnaire; TB, tuberculosis.
Fig 12
Fig 12. Important barriers to engagement in the care cascade for TB disease in India.
Barriers listed generally represent factors from regression analyses that were statistically significantly associated with unfavorable TB treatment outcomes in at least 2 studies for a given gap, or reasons that were reported by at least 15% of people with TB who experienced unfavorable outcomes in at least 1 study for a given gap. DOT, directly observed therapy; DST, drug susceptibility testing; NAAT, nucleic acid amplification testing; TB, tuberculosis.

Similar articles

Cited by

References

    1. World Health Organization. Global tuberculosis report 2023 [Internet]. Geneva, Switzerland: World Health Organization; 2023. Available from: https://www.who.int/teams/global-tuberculosis-programme/tb-reports/globa.... Accessed 2024 Apr 9.
    1. Central TB. Division. India TB report 2020 [Internet]. New Delhi, India: Ministry of Health and Family Welfare; 2020. Available from: https://tbcindia.gov.in/showfile.php?lid=3538. Accessed 2024 Apr 9.
    1. Subbaraman R, Nathavitharana RR, Mayer KH, Satyanarayana S, Chadha VK, Arinaminpathy N, et al.. Constructing care cascades for active tuberculosis: A strategy for program monitoring and identifying gaps in quality of care. PLoS Med. 2019; 16: e1002754. doi: 10.1371/journal.pmed.1002754 - DOI - PMC - PubMed
    1. Faust L, Naidoo P, Caceres-Cardenas G, Ugarte-Gil C, Muyoyeta M, Kerkhoff AD, et al.. Improving measurement of tuberculosis care cascades to enhance people-centred care. Lancet Infect Dis. 2023;23:e547–e557. doi: 10.1016/S1473-3099(23)00375-4 - DOI - PubMed
    1. Subbaraman R, Nathavitharana RR, Satyanarayana S, Pai M, Thomas BE, Chadha VK, et al.. The Tuberculosis Cascade of Care in India’s Public Sector: A Systematic Review and Meta-analysis. PLoS Med. 2016;13:e1002149. doi: 10.1371/journal.pmed.1002149 - DOI - PMC - PubMed

Publication types