Review
. 2024 May;311(2):e232369.
doi: 10.1148/radiol.232369.

Liver Imaging Reporting and Data System Contrast-Enhanced US Nonradiation Treatment Response Assessment Version 2024

Affiliations
Review

Liver Imaging Reporting and Data System Contrast-Enhanced US Nonradiation Treatment Response Assessment Version 2024

Andrej Lyshchik et al. Radiology. 2024 May.

Abstract

The American College of Radiology Liver Imaging Reporting and Data System (LI-RADS) standardizes the imaging technique, reporting lexicon, disease categorization, and management for patients with or at risk for hepatocellular carcinoma (HCC). LI-RADS encompasses HCC surveillance with US; HCC diagnosis with CT, MRI, or contrast-enhanced US (CEUS); and treatment response assessment (TRA) with CT or MRI. LI-RADS was recently expanded to include CEUS TRA after nonradiation locoregional therapy or surgical resection. This report provides an overview of LI-RADS CEUS Nonradiation TRA v2024, including a lexicon of imaging findings, techniques, and imaging criteria for posttreatment tumor viability assessment. LI-RADS CEUS Nonradiation TRA v2024 takes into consideration differences in the CEUS appearance of viable tumor and posttreatment changes within and in close proximity to a treated lesion. Due to the high sensitivity of CEUS to vascular flow, posttreatment reactive changes commonly manifest as areas of abnormal perilesional enhancement without washout, especially in the first 3 months after treatment. To improve the accuracy of CEUS for nonradiation TRA, different diagnostic criteria are used to evaluate tumor viability within and outside of the treated lesion margin. Broader criteria for intralesional enhancement increase sensitivity for tumor viability detection. Stricter criteria for perilesional enhancement limit miscategorization of posttreatment reactive changes as viable tumor. Finally, the TRA algorithm reconciles intralesional and perilesional tumor viability assessment and assigns a single LI-RADS treatment response (LR-TR) category: LR-TR nonviable, LR-TR equivocal, or LR-TR viable.


Conflict of interest statement

Disclosures of conflicts of interest: A.L. Support for the present article from GE HealthCare, Bracco Diagnostics, Siemens Healthineers, and Canon Medical Systems; book royalties from Elsevier; consulting fees from GE HealthCare, Bracco Diagnostics, Bioclinica, and WorldCare Clinical; payment or honoraria for lectures, presentations, speakers bureaus, manuscript writing, or educational events from GE HealthCare; participation on an advisory board for GE HealthCare, Bracco Diagnostics, and Lantheus; and leadership or fiduciary role with the International Contrast Ultrasound Society. D.T.F. Research contracts to institution from GE HealthCare, Philips Healthcare, and Siemens Healthineers and paid participation on an advisory board for Philips Healthcare and GE HealthCare. Y.K. No relevant relationships. S.R.W. Honoraria for speakers bureaus from Philips, paid participation on an advisory board for Definity and Lantheus Medical Imaging, co-president of the International Contrast Ultrasound Society, and equipment support from Philips, Siemens, and Samsung. C.F.D. Payment or honoraria for lectures, presentations, speakers bureaus, manuscript writing, or educational events from Bracco and GE. D.A.C. Payment or honoraria for speakers bureaus from Samsung, Siemens, Philips, Mindray, Bracco, and Esaote. M.F.M. Speaker fees from Bracco, Mindray, and GE Medical Systems and travel support from Bracco and GE Medical Systems. H.J.J. No relevant relationships. T.K.K. No relevant relationships. J.M.L. Grants or contracts from Bayer HealthCare, Canon Medical Systems, Philips Healthcare, GE HealthCare, Central Medical Service, Guerbet, Samsung Medison, and Bracco and payment or honoraria for lectures, presentations, speakers bureaus, manuscript writing, or educational events from Bayer HealthCare, Siemens Healthineers, Samsung Medison, and Guerbet. Y.M. No relevant relationships. M.K. Grants or contracts from Otsuka, Taiho, Chugai Pharmaceutical, GE HealthCare, Eisai, AbbVie, and EA Pharma; consulting fees from Chugai Pharmaceutical, Roche, Eisai, and AstraZeneca; and payment or honoraria for lectures, presentations, speakers bureaus, manuscript writing, or educational events from Chugai Pharmaceutical, Eisai, Eli Lilly, Takeda Pharmaceutical, Bayer, and AstraZeneca. F.P. Support for the present manuscript from AstraZeneca, Bayer, Bracco, Esaote, Eisai, Exact Sciences, GE, Guerbet-LaForce, Ipsen, MSD, Nerviano, Roche, Samsung, and Siemens Healthineers; consulting fees from AstraZeneca, Bayer, Bracco, Esaote, Eisai, GE, Ipsen, MSD, Roche, and Samsung; payment or honoraria for lectures, presentations, speakers bureaus, manuscript writing, or educational events from AstraZeneca, Eisai, Exact Sciences, MSD, Roche, and Siemens Healthineers; support for attending meetings and/or travel from AstraZeneca and Siemens Healthineers; and participation on a data and safety monitoring board or advisory board for Nerviano.

Figures

None
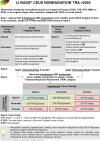
Graphical abstract
Liver Imaging Reporting and Data System (LI-RADS) Contrast-Enhanced US
(CEUS) Nonradiation Treatment Response Assessment (TRA) Version 2024. LR-TR =
LI-RADS treatment response, MWA = microwave ablation, PEA = percutaneous ethanol
ablation, RFA = radiofrequency ablation, TACE = transarterial chemoembolization,
TAE = transarterial embolization.
Figure 1:
Liver Imaging Reporting and Data System (LI-RADS) Contrast-Enhanced US (CEUS) Nonradiation Treatment Response Assessment (TRA) Version 2024. LR-TR = LI-RADS treatment response, MWA = microwave ablation, PEA = percutaneous ethanol ablation, RFA = radiofrequency ablation, TACE = transarterial chemoembolization, TAE = transarterial embolization.
US images of a treated lesion with intralesional and perilesional
tumor viability category absent at 1 month after transarterial
chemoembolization. (A) The B-mode image is used as an anatomic reference to
define the margin of the treated lesion (dotted line), allowing separate
evaluation of contrast enhancement inside and outside of the treated lesion
margin. (B) The contrast-enhanced US image demonstrates no enhancement
within the margin of the treated lesion (dotted line) and enhancement
identical to surrounding liver along the treated lesion margin. A schematic
summarizing intralesional and perilesional findings is shown in the lower
left corner of each panel.
Figure 2:
US images of a treated lesion with intralesional and perilesional tumor viability category absent at 1 month after transarterial chemoembolization. (A) The B-mode image is used as an anatomic reference to define the margin of the treated lesion (dotted line), allowing separate evaluation of contrast enhancement inside and outside of the treated lesion margin. (B) The contrast-enhanced US image demonstrates no enhancement within the margin of the treated lesion (dotted line) and enhancement identical to surrounding liver along the treated lesion margin. A schematic summarizing intralesional and perilesional findings is shown in the lower left corner of each panel.
US images of a treated lesion with intralesional tumor viability
category uncertain at 1 month after microwave ablation. (A) The B-mode image
is used as an anatomic reference to define the margin of the treated lesion
(dotted line). (B) Arterial phase contrast-enhanced US image demonstrates
irregular hypoenhancement within the margin of the treated lesion (dotted
line). (C) Late phase contrast-enhanced US image demonstrates some degree of
washout within the margin of the treated lesion (dotted line). A schematic
summarizing intralesional findings is shown in the lower left corner of each
panel.
Figure 3:
US images of a treated lesion with intralesional tumor viability category uncertain at 1 month after microwave ablation. (A) The B-mode image is used as an anatomic reference to define the margin of the treated lesion (dotted line). (B) Arterial phase contrast-enhanced US image demonstrates irregular hypoenhancement within the margin of the treated lesion (dotted line). (C) Late phase contrast-enhanced US image demonstrates some degree of washout within the margin of the treated lesion (dotted line). A schematic summarizing intralesional findings is shown in the lower left corner of each panel.
US images of a treated lesion with intralesional tumor viability
category present at 1 week after transarterial chemoembolization. (A) The
B-mode image is used as an anatomic reference to define the margin of the
treated lesion (dotted line). (B) Arterial phase contrast-enhanced US image
demonstrates nodular area of contrast isoenhancement within the margin of
the treated lesion (dotted line). (C) Late phase contrast-enhanced US image
demonstrates some degree of washout within the margin of the treated lesion
(dotted line). A schematic summarizing intralesional findings is shown in
the lower left corner of each panel.
Figure 4:
US images of a treated lesion with intralesional tumor viability category present at 1 week after transarterial chemoembolization. (A) The B-mode image is used as an anatomic reference to define the margin of the treated lesion (dotted line). (B) Arterial phase contrast-enhanced US image demonstrates nodular area of contrast isoenhancement within the margin of the treated lesion (dotted line). (C) Late phase contrast-enhanced US image demonstrates some degree of washout within the margin of the treated lesion (dotted line). A schematic summarizing intralesional findings is shown in the lower left corner of each panel.
US images of a treated lesion with perilesional tumor viability
category uncertain immediately after radiofrequency ablation. (A) The B-mode
image is used as an anatomic reference to define the margin of the treated
lesion (dotted line). (B) Arterial phase contrast-enhanced US image
demonstrates nodular rim of hyperenhancement (arrow) adjacent to the margin
of the treated lesion (dotted line). (C) Late phase contrast-enhanced US
image demonstrates no detectable washout in previously hyperenhanced area
(arrow) along the margin of the treated lesion. A pseudoenhancement artifact
(*) from hyperechoic postablation changes is visible in the center of
the treated lesion. A schematic summarizing perilesional findings is shown
in the lower left corner of each panel.
Figure 5:
US images of a treated lesion with perilesional tumor viability category uncertain immediately after radiofrequency ablation. (A) The B-mode image is used as an anatomic reference to define the margin of the treated lesion (dotted line). (B) Arterial phase contrast-enhanced US image demonstrates nodular rim of hyperenhancement (arrow) adjacent to the margin of the treated lesion (dotted line). (C) Late phase contrast-enhanced US image demonstrates no detectable washout in previously hyperenhanced area (arrow) along the margin of the treated lesion. A pseudoenhancement artifact (*) from hyperechoic postablation changes is visible in the center of the treated lesion. A schematic summarizing perilesional findings is shown in the lower left corner of each panel.
US images of a treated lesion with perilesional tumor viability
category present at 1 month after microwave ablation. (A) The B-mode image
is used as an anatomic reference to define the margin of the treated lesion
(dotted line). (B) Arterial phase contrast-enhanced US image demonstrates
nodular area of hyperenhancement (arrows) adjacent to the margin of the
treated lesion (dotted line). (C) Late phase contrast-enhanced US image
demonstrates mild washout in previously hyperenhanced area (arrows) along
the margin of the treated lesion (dotted line). A schematic summarizing
perilesional findings is shown in the lower left corner of each
panel.
Figure 6:
US images of a treated lesion with perilesional tumor viability category present at 1 month after microwave ablation. (A) The B-mode image is used as an anatomic reference to define the margin of the treated lesion (dotted line). (B) Arterial phase contrast-enhanced US image demonstrates nodular area of hyperenhancement (arrows) adjacent to the margin of the treated lesion (dotted line). (C) Late phase contrast-enhanced US image demonstrates mild washout in previously hyperenhanced area (arrows) along the margin of the treated lesion (dotted line). A schematic summarizing perilesional findings is shown in the lower left corner of each panel.

References

    1. Chernyak V , Fowler KJ , Kamaya A , et al. . Liver Imaging Reporting and Data System (LI-RADS) version 2018: imaging of hepatocellular carcinoma in at-risk patients . Radiology 2018. ; 289 ( 3 ): 816 – 830 . - PMC - PubMed
    1. Gummadi S , Eisenbrey JR , Lyshchik A . Contrast-enhanced ultrasonography in interventional oncology . Abdom Radiol (NY) 2018. ; 43 ( 11 ): 3166 – 3175 . - PMC - PubMed
    1. Eisenbrey JR , Gabriel H , Savsani E , Lyshchik A . Contrast-enhanced ultrasound (CEUS) in HCC diagnosis and assessment of tumor response to locoregional therapies . Abdom Radiol (NY) 2021. ; 46 ( 8 ): 3579 – 3595 . - PMC - PubMed
    1. Bansal S , Gui J , Merrill C , Wong JK , Burak KW , Wilson SR . Contrast-enhanced US in local ablative therapy and secondary surveillance for hepatocellular carcinoma . RadioGraphics 2019. ; 39 ( 5 ): 1302 – 1322 . - PubMed
    1. Wink MH , Wijkstra H , De La Rosette JJ , Grimbergen CA . Ultrasound imaging and contrast agents: a safe alternative to MRI? Minim Invasive Ther Allied Technol 2006. ; 15 ( 2 ): 93 – 100 . - PubMed

MeSH terms

LinkOut - more resources