. 2024 May;14(5):230460.
doi: 10.1098/rsob.230460. Epub 2024 May 29.

The Aurora B-controlled PP1/RepoMan complex determines the spatial and temporal distribution of mitotic H2B S6 phosphorylation

Affiliations

The Aurora B-controlled PP1/RepoMan complex determines the spatial and temporal distribution of mitotic H2B S6 phosphorylation

Maximilian Pfisterer et al. Open Biol. 2024 May.

Abstract

The precise spatial and temporal control of histone phosphorylations is important for the ordered progression through the different phases of mitosis. The phosphorylation of H2B at S6 (H2B S6ph), which is crucial for chromosome segregation, reaches its maximum level during metaphase and is limited to the inner centromere. We discovered that the temporal and spatial regulation of this modification, as well as its intensity, are governed by the scaffold protein RepoMan and its associated catalytically active phosphatases, PP1α and PP1γ. Phosphatase activity is inhibited at the area of maximal H2B S6 phosphorylation at the inner centromere by site-specific Aurora B-mediated inactivation of the PP1/RepoMan complex. The motor protein Mklp2 contributes to the relocalization of Aurora B from chromatin to the mitotic spindle during anaphase, thus alleviating Aurora B-dependent repression of the PP1/RepoMan complex and enabling dephosphorylation of H2B S6. Accordingly, dysregulation of Mklp2 levels, as commonly observed in tumour cells, leads to the lack of H2B S6 dephosphorylation during early anaphase, which might contribute to chromosomal instability.

Keywords: centromere; histone phosphorylation; mitosis; phosphatase scaffold.


Conflict of interest statement

We declare we have no competing interests.

Figures

Identification of the PP1 subunits mediating dephosphorylation of H2B S6ph.
Figure 1.
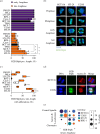
Identification of the PP1 subunits mediating dephosphorylation of H2B S6ph. (a) Purified H2B protein was phosphorylated by CDK1 and cyclin B in vitro to allow for H2B S6ph. CDK1/cyclin B was inactivated by heating and 0.2 µg of recombinant PP1 subunits or glutathion-S-transferase (GST) as a control were added. After further incubation for 30 min, proteins were analysed by Western blotting with the indicated antibodies, the positions of molecular weight markers are indicated. (b,c) HCT116 cells were treated as schematically indicated in (b) and analysed for the occurrence of H2B S6ph during the various mitotic stages as shown (c), scale bar = 10 µm. (d) The occurrence of H2B S6ph during early and late anaphase detected in (c) was quantified and statistically analysed with a two-way ANOVA and Tukey multiple comparisons correction from more than three independent biological replicates with n = 40, *p  ≤  0.05, **p  ≤  0.01, ***p  ≤  0.001.
Control of temporal dynamics of mitotic H2B S6ph by RepoMan and PP1.
Figure 2.
Control of temporal dynamics of mitotic H2B S6ph by RepoMan and PP1. (a,b) HCT116 cells were treated with siRNAs targeting the indicated PP1 scaffold proteins are further treated as schematically shown in figure 1b . The occurrence of H2B S6ph during late anaphase was analysed by indirect immunofluorescence (a) and analysed quantitatively (b). (c,d) HCT116 cells were treated with siRNAs targeting RepoMan and the PP1α and PP1γ subunits as shown, followed by analysis of mitotic H2B S6ph by indirect immunofluorescence (c) and its quantification (d). Scale bar = 10 µm, statistical analysis was done using a two-way ANOVA and Tukey multiple comparisons correction from more than three independent biological replicates with n = 40, ***p  ≤  0.001.
Comparative analysis of different histone phosphorylations during anaphase.
Figure 3.
Comparative analysis of different histone phosphorylations during anaphase. (a) HCT116 were synchronized and analysed for H3 T3ph and H2B S6ph during anaphase as shown. (b) The experiment from (a) was performed using the indicated cell lines and statistically analysed. The diameter of the circles corresponds to the percentage frequency, the outer ring indicates the value of the upper standard deviation from three biological replicates. (c,d) The experiment was performed as for (a,b) with the difference that anaphase phosphorylation of H3 S10ph and H2B S6ph was compared, scale bar = 10 µm.
Control of spatial distribution and intensity of mitotic H2B S6ph by RepoMan and PP1.
Figure 4.
Control of spatial distribution and intensity of mitotic H2B S6ph by RepoMan and PP1. (a) HCT116 cells were treated with the indicated siRNAs and then arrested at metaphase using nocodazole. Chromosome spreads were analysed for chromosomal localization of H2B S6ph. The boxed areas are shown in higher magnification, the arrows indicate the chromosome axis, scale bar = 10 µm. (b) Line scan analysis for the distribution of H2B S6ph and DNA along the chromosome axis of the chromosomes shown in (a). (c) H2B S6ph detected on the chromosome spreads displayed in (a) was quantified using ImageJ and statistically analysed with a one-way ANOVA and Dunnett multiple comparisons correction with n = 87, ***p  ≤  0.001.
Control of mitotic H2B S6ph by RepoMan phosphorylation.
Figure 5.
Control of mitotic H2B S6ph by RepoMan phosphorylation. (a) HCT116 cells were transfected with the indicated siRNAs and then treated with nocodazole and the Aurora B inhibitor AZD-1152 (1 µM). Chromosome spreads were prepared from metaphase cells and H2B S6ph was detected by immunofluorescence as shown. (b) Schematic representation of the RepoMan protein and the effects of phosphosite mutations on binding to chromatin and PP1. (c) HCT116 cells were transfected with an siRNA targeting the endogenous RepoMan mRNA together with plasmids directing the expression of siRNA-resistant enhanced green fluorescent protein (EGFP)-RepoMan mutants or an EGFP control as indicated. H2B S6ph and EGFP expression were detected by immunofluorescence (upper) and quantified (lower). Statistical analysis was done with a one-way ANOVA and Dunnett multiple comparisons correction from three biological replicates with n = 30. (d) The experiment was performed as in (c) with the difference that RepoMan mutants compromising the chromatin association were used. Scale bar = 10 µm, ***p  ≤  0.001.
Analysis of Aurora B-mediated RepoMan inactivation.
Figure 6.
Analysis of Aurora B-mediated RepoMan inactivation. (a) Left: HCT116 cells were expressed to express H2B-EGFP-Aurora B, a kinase-inactive point mutant thereof (H2B-EGFP-Aurora B KD) or H2B-EGFP (empty) as a control. Chromosome spreads from nocodazole-arrested cells were stained for localization of the EGFP-tagged fusion protein and H2B S6ph, the boxed areas are shown in higher magnification. Right: the experiment was done as in the left part with the difference that AZD-1152 (1 µM) and nocodazole were added simultaneously. (b) The H2B-EGFP-Aurora B fusion protein is incorporated along the entire chromosome. The resulting inhibition of phosphatase leads to the spreading of H2B S6ph along the entire chromosome. (c) HCT116 cells were transfected to express H2B-EGFP-INCENP Δcen. Chromosome spreads of nocodazole-arrested cells were stained to reveal the localization of the EGFP fusion protein and Aurora B. (d) H2B-EGFP-INCENP Δcen was expressed in HCT116 cells and cells were treated with nocodazole either alone or in combination with AZD-1152. Chromosome spreads from mitotic cells were stained for spatial distribution of H2B-EGFP-INCENP Δcen and H2B S6ph as shown, scale bar = 10 µm. (e) Schematic interpretation of results. While the constitutive CDK1/cyclin B-mediated H2B S6ph occurs along the entire chromosome, the antagonizing phosphatase is inactivated specifically at the centromere. This occurs through centromere-specific and CENP-A-mediated anchoring of INCENP and its associated Aurora B kinase.
Distribution of H2B S6ph in tumour cells with CIN.
Figure 7.
Distribution of H2B S6ph in tumour cells with CIN. (a) The indicated cells ranging between high (HCT116, RPE-1) and low (U2OS, HT-29) genetic stability were analysed for the occurrence of H2B S6ph during early or late anaphase. Statistical analysis was performed with two-way ANOVA and Tukey correction for multiple comparisons from three biological replicates with n = 40. HCT116 cells are indicated by black bars, as they were used in all previous experiments of this study. (b) H2B S6ph was detected during the different mitotic phases in the indicated cell lines, arrows point to enriched H2B S6ph in chromosomal aberrations. (c) Chromosomal aberrations showing H2B S6ph in late anaphase were analysed in the indicated cell lines. One-way ANOVA with Dunnett correction for multiple comparisons was performed from three biological replicates with n = 25. All cell lines were compared with HCT116 cells, indicated by a white box. Box plots show the data between the first and third quartiles, the mean is displayed. Statistical analysis compared H2B S6ph between different cell lines and HCT116 cells, ***p  ≤  0.001. (d) HCT116 and U2OS cells in late anaphase were analysed by immunofluorescence for the intracellular localization of H2B S6ph and Aurora B, which was detected at the chromatin or the central spindle. Scale bar = 10 µm. (e) The indicated cell lines were analysed for the localization of Aurora B and the occurrence of H2B S6ph. The graph shows a statistical analysis where the diameter of the circles corresponds to the percentage frequency, while the outer ring indicates the value of the upper standard deviation.
Effects of Mklp2 levels on Aurora B localization and H2B S6ph.
Figure 8.
Effects of Mklp2 levels on Aurora B localization and H2B S6ph. (a) Mitotic HCT116 and U2OS cells were analysed for the occurrence and localization of Mklp2, Aurora B and H2B S6ph in late anaphase. Representative examples of the different phenotypes are displayed. (b) The indicated cell lines were treated with nocodazole or DMSO for 16 h and whole cell extracts were prepared, followed by Western blot analysis using the indicated antibodies. (c) HCT116 cells were treated with siRNAs targeting Mklp2 and treated for 15 min with AZD-1152 as shown. The occurrence of H2B S6ph and the localization of Aurora B was analysed in late anaphase by indirect immunofluorescence, scale bar = 10 µm. The right part shows a quantitative analysis of the experiment displayed in (c). Error bars indicate standard deviations from two independent biological replicates.

Similar articles

Cited by

References

    1. Cuijpers SAG, Vertegaal ACO. 2018. Guiding mitotic progression by crosstalk between post-translational modifications. Trends Biochem. Sci. 43 , 251–268. (10.1016/j.tibs.2018.02.004) - DOI - PubMed
    1. Merbl Y, Refour P, Patel H, Springer M, Kirschner MW. 2013. Profiling of ubiquitin-like modifications reveals features of mitotic control. Cell 152 , 1160–1172. (10.1016/j.cell.2013.02.007) - DOI - PMC - PubMed
    1. Dephoure N, Zhou C, Villén J, Beausoleil SA, Bakalarski CE, Elledge SJ, Gygi SP. 2008. A quantitative atlas of mitotic phosphorylation. Proc. Natl Acad. Sci. USA 105 , 10762–10767. (10.1073/pnas.0805139105) - DOI - PMC - PubMed
    1. Wang F, Higgins JMG. 2013. Histone modifications and mitosis: countermarks, landmarks, and bookmarks. Trends Cell Biol. 23 , 175–184. (10.1016/j.tcb.2012.11.005) - DOI - PubMed
    1. Schmitz ML, Higgins JMG, Seibert M. 2020. Priming chromatin for segregation: functional roles of mitotic histone modifications. Cell Cycle 19 , 625–641. (10.1080/15384101.2020.1719585) - DOI - PMC - PubMed

LinkOut - more resources