. 2024 May 28;15(5):370.
doi: 10.1038/s41419-024-06767-7.

Tumor microenvironment-induced FOXM1 regulates ovarian cancer stemness

Affiliations

Tumor microenvironment-induced FOXM1 regulates ovarian cancer stemness

Chiara Battistini et al. Cell Death Dis. .

Abstract

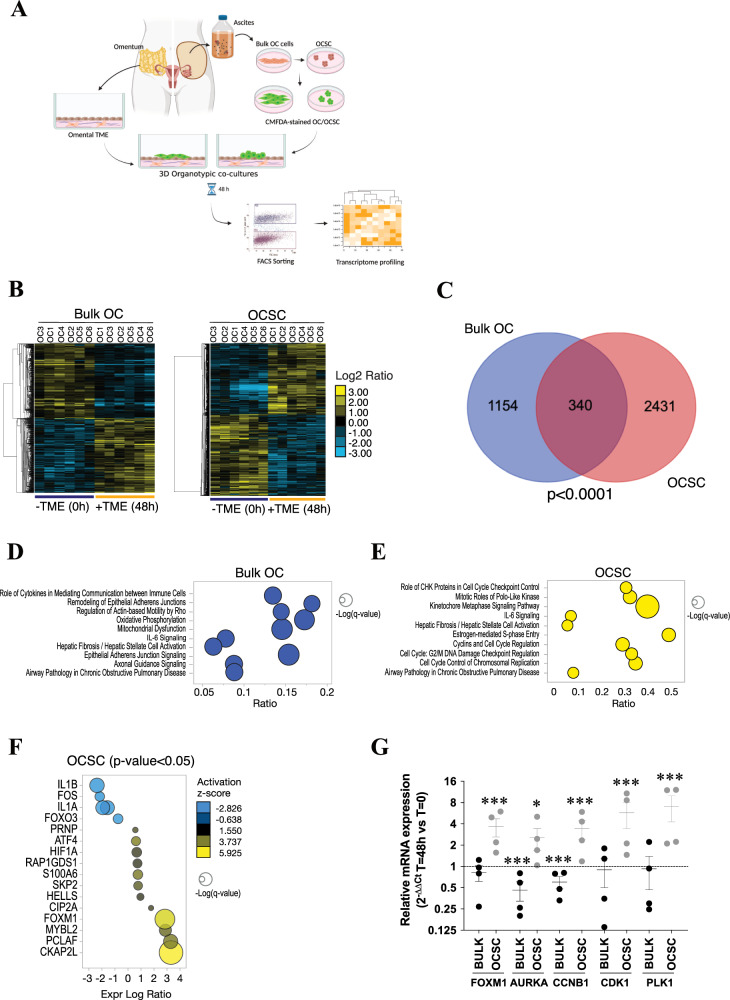
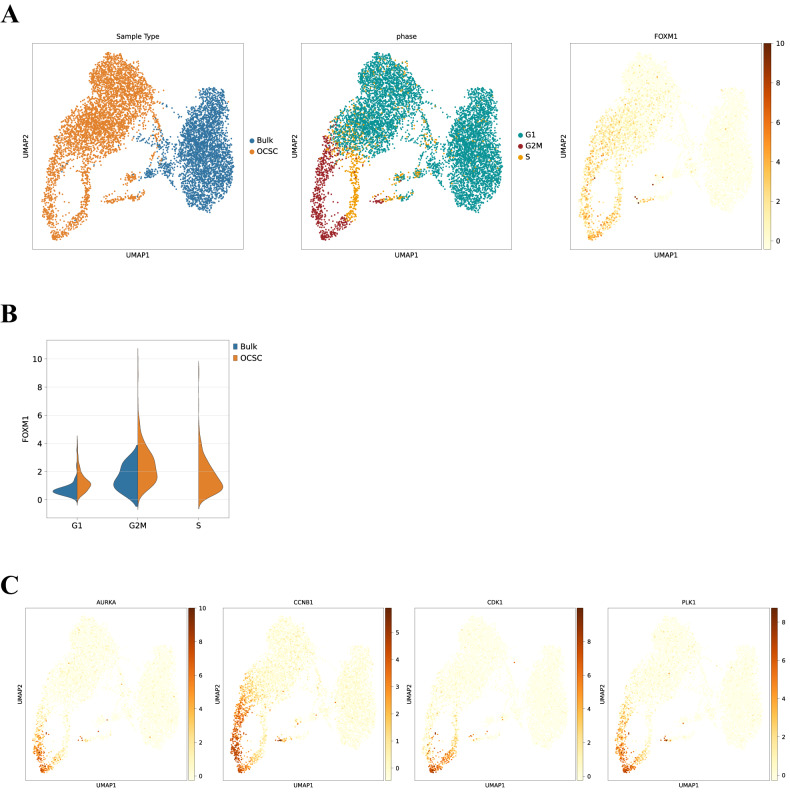
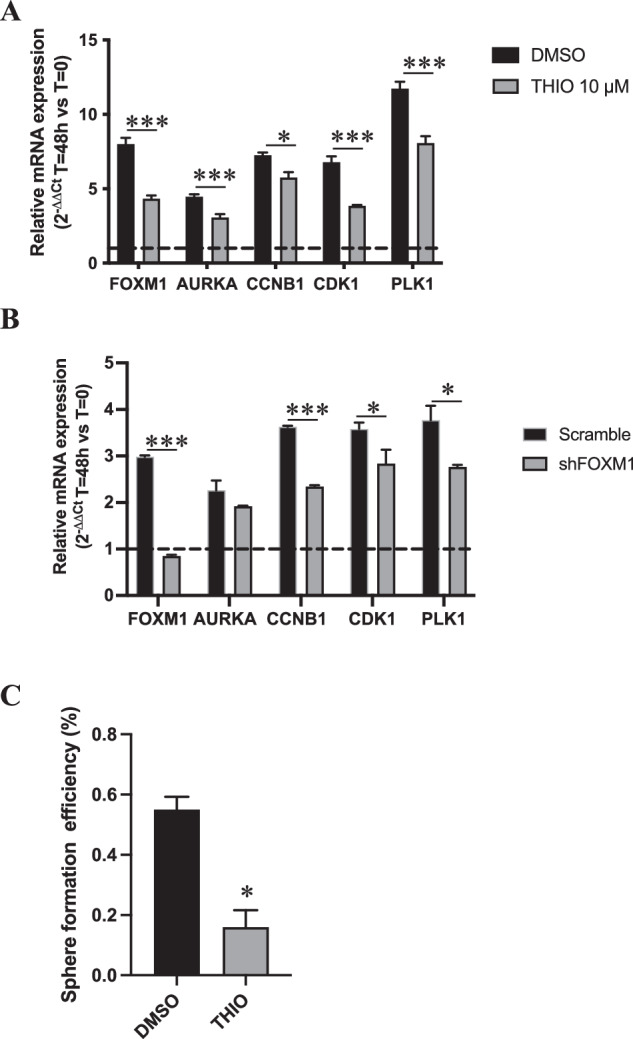
In ovarian tumors, the omental microenvironment profoundly influences the behavior of cancer cells and sustains the acquisition of stem-like traits, with major impacts on tumor aggressiveness and relapse. Here, we leverage a patient-derived platform of organotypic cultures to study the crosstalk between the tumor microenvironment and ovarian cancer stem cells. We discovered that the pro-tumorigenic transcription factor FOXM1 is specifically induced by the microenvironment in ovarian cancer stem cells, through activation of FAK/YAP signaling. The microenvironment-induced FOXM1 sustains stemness, and its inactivation reduces cancer stem cells survival in the omental niche and enhances their response to the PARP inhibitor Olaparib. By unveiling the novel role of FOXM1 in ovarian cancer stemness, our findings highlight patient-derived organotypic co-cultures as a powerful tool to capture clinically relevant mechanisms of the microenvironment/cancer stem cells crosstalk, contributing to the identification of tumor vulnerabilities.


Conflict of interest statement

The authors declare no competing interests.

Figures

Fig. 1
Fig. 1. The TME induces transcriptional reprogramming in bulk OC cells and OCSC and activates FOXM1 pathway in OCSC.
A Schematic representation of the patient-derived organotypic model. CMFDA-labeled bulk OC cells and OCSC are FACS-isolated after 48 h of co-culture with TME (fibroblasts and mesothelial cells) and subjected to RNA sequencing. Created with BioRender.com. B Hierarchical clustering analysis of differentially expressed genes in bulk OC and OCSC of 6 HGSOC samples (OC1-6) with or without the interaction with tumor microenvironment (TME). The heatmap shows gene expression change (log2 ratios) as per the legend. C Venn diagrams showing the number of DEGs regulated by TME in bulk OC and OCSC (hypergeometric test p = 2.377e−19). DEGs are listed in Supplementary Tables S2 and S3. Bubble plots showing results of the Canonical Pathways Analysis of Ingenuity Pathways Analysis (IPA) in bulk OC (D) and OCSC (E). Bubble size represents the inverse of Logarithmic (-Log) of significance (q-value); for each pathway, ratio is the number of genes in our list over the total number of genes in the specific pathway. Only pathways with q-value ≤ 0.05 are shown. F Bubble plot showing the results of Upstream Regulator Analysis of IPA. Upstream modulators are predicted to be modulated by contact with TME in OCSC and are listed in Supplementary Table S4. Bubble size is proportional to inverse of Logarithmic (-Log) of significance [e.g., -Log(p-value), p-value < 0.05; Student’s t test] of z-score. Bubble colors refer to activation z-score, as per the legend. Only modulators with coherent expression trend with the activation z-score are shown. G mRNA expression of FOXM1 and its target genes (AURKA, Aurora Kinase A, CCNB1, Cyclin B1, CDK1, Cyclin-dependent Kinase 1, PLK1, Polo-like Kinase 1) was analyzed by qRT-PCR in 4 of the 6 patients profiled in panel B (OC1-4). Data are represented as a relative mRNA expression (2-ΔΔCt) of bulk OC cells (in black) and OCSC (in gray) co-cultured with TME for 48 h (T = 48 h) compared to cells grown in the absence of TME (T = 0, dashed line). The dots represent each gene’s relative mRNA expression in each sample, while bars and whiskers represent its mean ± SEM among the 4 samples analyzed. Comparisons between experimental groups were done with two-sided Student’s t test; *p < 0.05, ***p < 0.005.
Fig. 2
Fig. 2. Single cell transcriptomics reveal FOXM1 as an OCSC-specific gene closely related to cell cycle progression.
A UMAP representation of single cell data, mapping either the sample type (left panel), inferred cell cycle phases (middle panel) and FOXM1 expression (right panel). B Violin plot representing the level of expression of the FOXM1 gene in FOXM1 positive cells in the considered sample types (bulk OC in blue and OCSC in orange) divided by cell cycle phases (x axis). C UMAP representation of single cell data, mapping the expression of cell cycle related genes (AURKA, Aurora Kinase A, CCNB1, Cyclin B1, CDK1, Cyclin-dependent Kinase 1, PLK1, Polo-like Kinase 1).
Fig. 3
Fig. 3. FOXM1 sustains stemness in OC.
A Viability of OC1 primary cells measured after 72 h of treatment with vehicle (DMSO) or 3 different doses of FOXM1 inhibitor Thiostrepton. B SFE in OC1 primary sample treated with vehicle (DMSO) or with 3 different doses of FOXM1 inhibitor Thiostrepton. Comparisons between experimental groups were done with two-sided Student’s t test; **p < 0.01, ***p < 0.005. C Sphere formation assay performed on TYK-nu cells expressing either a control shRNA (Scramble) or 2 different shRNAs against FOXM1 (shFOXM1-C and E). Comparisons between experimental groups were done with two-sided Student’s t test; ***p < 0.005. D Nude mice were transplanted subcutaneously with decreasing numbers of either TYK-nu Scramble or TYK-nu shFOXM1-C cells, tumor take was assessed 21 days after injection (see Supplementary Fig. 3E) and an extreme limiting dilution assay (ELDA) was carried out to calculate the stem cell frequency (p = 0.000267).
Fig. 4
Fig. 4. Contact with TME induces FOXM1 signaling in OCSC through FAK/YAP signaling.
A Cell lysates from TYK-nu and from primary sample OC1 cultured as bulk cells or OCSC were immunoblotted for FOXM1, pFAK and FAK, while vinculin was used as loading control. B Immunofluorescence for FAK (in red) and pFAK (in gray) on GFP+ TYK-nu OCSC (in green) alone (upper panel) or co-cultured with TME (lower panel). Nuclei were counterstained with DAPI (blue). Scale bar: 50 μm. C Immunofluorescence for FAK (in red) and pFAK (in gray) on GFP+ OCSC from primary sample OC1 (in green) alone (upper panels) or co-cultured with TME (lower panels). Nuclei were counterstained with DAPI (blue). Scale bar: 50 μm. D mRNA expression of FOXM1 was analyzed by qRT-PCR in TYK-nu OCSC and in OCSC from primary sample OC5 cultured with TME for 24 h and treated with vehicle (DMSO, black) or with Verteporfin 3 μM (VP, gray). Data are represented as a relative mRNA expression (2-ΔΔCt), compared to OCSC treated with DMSO. Comparisons between experimental groups were done with two-sided Student’s t test; ***p < 0.005. E mRNA expression of FOXM1 was analyzed by qRT-PCR in TYK-nu OCSC and in OCSC from primary sample OC5 cultured with TME for 24 h and treated with vehicle (DMSO, black) or with Defactinib 1 μM (DEF, gray). Data are represented as a relative mRNA expression (2-ΔΔCt), compared to OCSC treated with DMSO. Comparisons between experimental groups were done with two-sided Student’s t test; ***p < 0.005. F Immunofluorescence for YAP (in gray) on GFP+ TYK-nu OCSC (in green) co-cultured with TME for 24 h and treated with vehicle (DMSO) or with Defactinib 1 μM (DEF). Nuclei were counterstained with DAPI (blue). Scale bar: 50 μm. G Quantification of the experiment shown in panel E. Each dot represents the percentage of OCSC positive for nuclear YAP signaling in a field. The graph shows mean ± SD of at least 5 fields. Comparisons between experimental groups were done with two-sided Student’s t test; ***p < 0.005.
Fig. 5
Fig. 5. TME stimulates the activation of FOXM1 pathway in OCSC.
A mRNA expression of FOXM1 and of its target genes (AURKA, CCNB1, CDK1 and PLK1) was analyzed by qRT-PCR in OC1 OCSC cultured with TME for 48 h and treated with vehicle (DMSO, black) or with Thiostrepton 10 μM (gray). Data are represented as a relative mRNA expression (2-ΔΔCt), compared to cells grown in absence of TME (dashed line). Comparisons between experimental groups were done with two-sided Student’s t test; *p < 0.05, ***p < 0.005. B mRNA expression of FOXM1 and of its target genes (AURKA, CCNB1, CDK1 and PLK1) was analyzed by qRT-PCR in TYK-nu Scramble (black) or shFOXM1 (gray) OCSC cultured with TME for 48 h. Data are represented as a relative mRNA expression (2-ΔΔCt), compared to Scramble OCSC not cultured with TME (dashed line). Comparisons between experimental groups were done with two-sided Student’s t test; *p < 0.05, ***p < 0.005. C OC1 OCSC FACS-sorted after co-culture with TME in presence or absence of Thiostrepton 10 μM (experiment shown in panel A), were subjected to a sphere formation assay in absence of further treatments. Comparisons between experimental groups were done with two-sided Student’s t test; *p < 0.05.
Fig. 6
Fig. 6. FOXM1 inhibition decreases survival of OCSC cultured on TME and synergizes with PARP inhibitors.
A RFP positive TYK-nu bulk and OCSC were cultured on TME in presence of Thiostrepton 10 μM, and RFP positive area was measured after 6 days of treatment. Data are expressed as mean RFP+ area ±SEM from 3 independent experiments. Comparisons between experimental groups were done with two-sided Student’s t test; ***p < 0.005. B Representative pictures from one of the experiments analyzed in panel A. Scale bar: 500 μm. GFP positive bulk and OCSC from primary samples OC6 (C) and OC10 (D) were cultured on TME in the presence of 10 μM Thiostrepton, and GFP positive area was measured after 6 days of treatment. Data are expressed as mean GFP+ area ±SD from one representative experiment (n = 3). Comparisons between experimental groups were done with two-sided Student’s t test; *p < 0.05, ***p < 0.005. E RFP positive TYK-nu OCSC were cultured on TME and treated with 3 different doses of Thiostrepton (5, 10 and 15 μM) and 4 doses of Olaparib (2.5, 5, 10 and 15 μM), alone or in combination. RFP positive area was measured after 6 days of treatment. The combinatorial matrix shows the synergy distribution for the drug combinations according to the Gaddum’s non-interaction (HSA) model, calculated using the SynergyFinder Web Application. The intensity of red color reflects the strength of synergism of each drug concentration. The panel shows the result of one representative experiment (n = 3). GFP positive OCSC from OC9 (F) and OC10 (G) primary sample were cultured on TME and treated with 3 different doses of Thiostrepton (5, 10 and 15 μM) and 3 doses of Olaparib (2.5, 5 and 10 μM), alone or in combination. GFP positive area was measured after 6 days of treatment. The combinatorial matrix shows the synergism distribution for the drug combinations according to the Gaddum’s non-interaction (HSA) model, calculated using the SynergyFinder Web Application.

References

    1. Marchetti C, De Felice F, Romito A, Iacobelli V, Sassu CM, Corrado G, et al. Chemotherapy resistance in epithelial ovarian cancer: Mechanisms and emerging treatments. Semin Cancer Biol. 2021;77:144–66. doi: 10.1016/j.semcancer.2021.08.011. - DOI - PubMed
    1. Bray F, Ferlay J, Soerjomataram I, Siegel RL, Torre LA, Jemal A. Global cancer statistics 2018: GLOBOCAN estimates of incidence and mortality worldwide for 36 cancers in 185 countries. CA Cancer J Clin. 2018;68:394–424. doi: 10.3322/caac.21492. - DOI - PubMed
    1. Ritch SJ, Telleria CM. The Transcoelomic Ecosystem and Epithelial Ovarian Cancer Dissemination. Front Endocrinol. 2022;13:886533. doi: 10.3389/fendo.2022.886533. - DOI - PMC - PubMed
    1. Lupia M, Cavallaro U. Ovarian cancer stem cells: Still an elusive entity? Mol Cancer. 2017;16:64. - PMC - PubMed
    1. Nwani NG, Sima LE, Nieves-Neira W, Matei D. Targeting the Microenvironment in High Grade Serous Ovarian Cancer. Cancers (Basel) 2018;10:266. doi: 10.3390/cancers10080266. - DOI - PMC - PubMed

Publication types

MeSH terms