. 2024 May 28;15(1):4529.
doi: 10.1038/s41467-024-47218-3.

An isoform quantitative trait locus in SBNO2 links genetic susceptibility to Crohn's disease with defective antimicrobial activity

Affiliations

An isoform quantitative trait locus in SBNO2 links genetic susceptibility to Crohn's disease with defective antimicrobial activity

Dominik Aschenbrenner et al. Nat Commun. .

Abstract

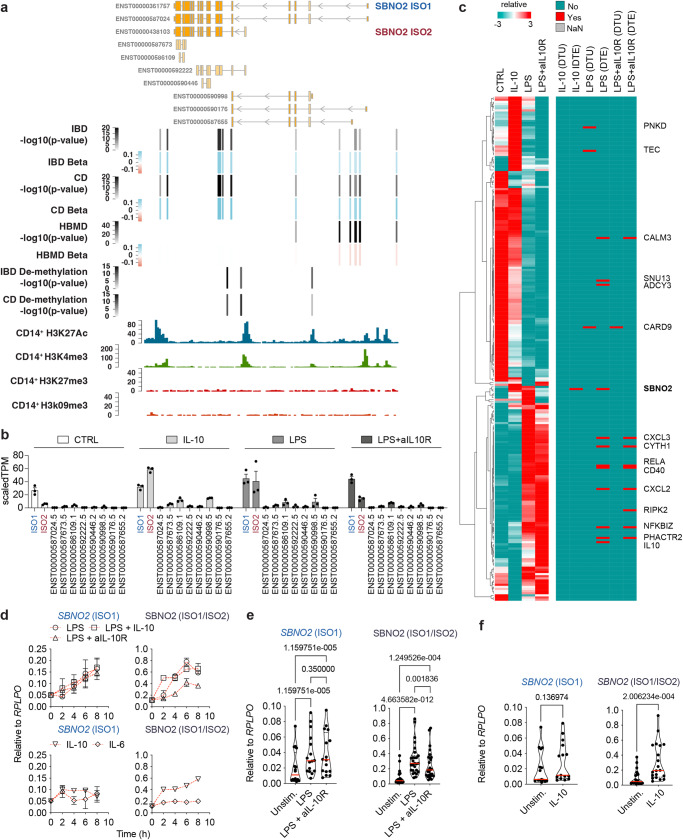
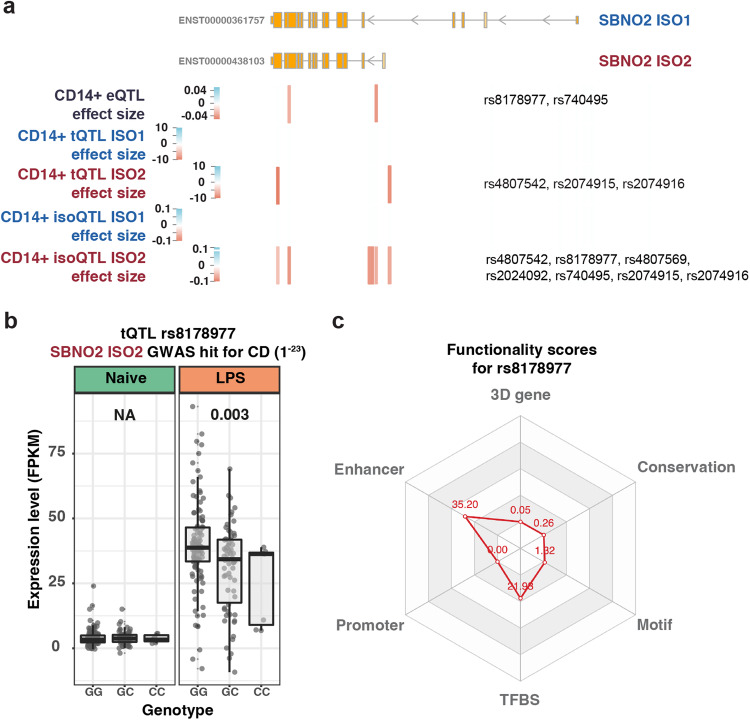
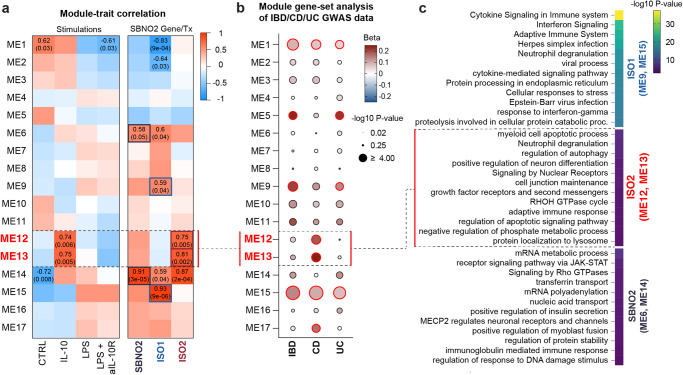
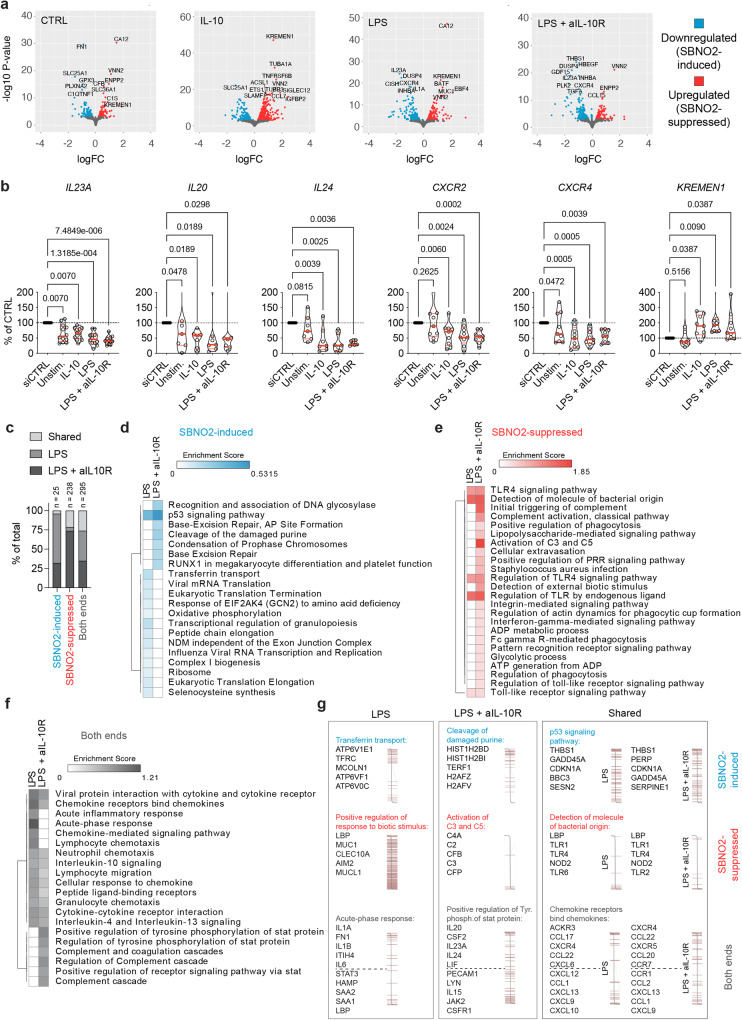
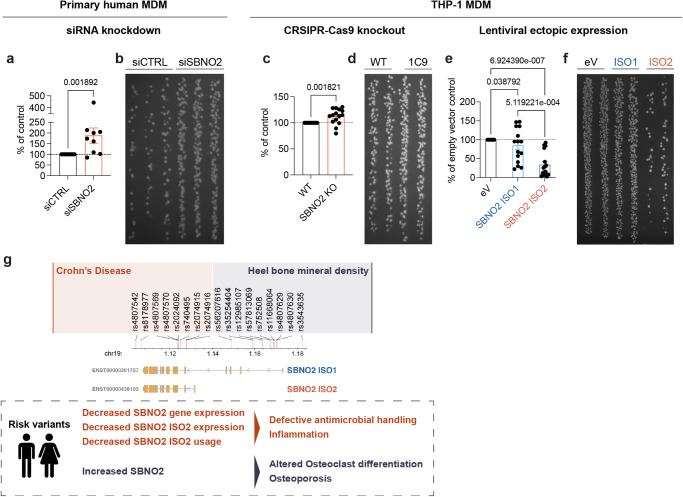
Despite major advances in linking single genetic variants to single causal genes, the significance of genetic variation on transcript-level regulation of expression, transcript-specific functions, and relevance to human disease has been poorly investigated. Strawberry notch homolog 2 (SBNO2) is a candidate gene in a susceptibility locus with different variants associated with Crohn's disease and bone mineral density. The SBNO2 locus is also differentially methylated in Crohn's disease but the functional mechanisms are unknown. Here we show that the isoforms of SBNO2 are differentially regulated by lipopolysaccharide and IL-10. We identify Crohn's disease associated isoform quantitative trait loci that negatively regulate the expression of the noncanonical isoform 2 corresponding with the methylation signals at the isoform 2 promoter in IBD and CD. The two isoforms of SBNO2 drive differential gene networks with isoform 2 dominantly impacting antimicrobial activity in macrophages. Our data highlight the role of isoform quantitative trait loci to understand disease susceptibility and resolve underlying mechanisms of disease.


Conflict of interest statement

H.H.U. has received research support or consultancy fees from UCB Pharma, Janssen, Eli Lilly, MiroBio, Celgene and AbbVie. D.A. was supported by a UCB Pharma fellowship. M.P., L.D., and M.A. are employed by and shareholders of UCB Pharma. S.P. is an employee and shareholder of Glaxo Smith Kline. D.A. is an employee and shareholder of Novartis Pharma AG. This article reflects the authors’ personal opinions and not that of their employer. The remaining authors declare no competing interests.

Figures

Fig. 1
Fig. 1. Location, phenotype-genotype association, directionality of genetic variation in SBNO2, and differential regulation of SBNO2 isoform expression.
a Schematic showing the SBNO2 gene locus, GWAS-based phenotype-genotype association, genomic location, p-value (bars and grey colouring), and beta (bars and blue-red colouring) based on the OpenTargets database for variants with significant associations to the SBNO2 gene locus and with significant associations to IBD and/or CD and changes in heel bone mineral density (HBMD). Genomic location of IBD-associated and CD-associated demethylation p-values at the SBNO2 locus are indicated. ENCODE CD14+ monocyte histone modification ChIP-seq tracks are aligned to illustrate accessibility and promoter locations in the SBNO2 locus. b Regulation of SBNO2 transcript expression in human primary MDM following 8 h stimulation with IL-10, LPS, or LPS+aIL-10R analysed by RNA-seq (n = 3, error bars: SEM). c Identification of stimulation-dependent differential transcript expression and usage of confident IBD risk genes within monocyte-derived macrophages. The heatmap shows the row scaled gene expression of those n = 238 confident IBD risk genes (out of n = 280, including SBNO2) that are expressed in monocyte-derived macrophages in unstimulated (CTRL), IL-10-, LPS-, and LPS + aIL10R-stimulated conditions as identified by RNA-seq. The right map highlights those genes in red that where identified to show differential transcript usage (DTU) or differential transcript expression (DTE) (padj < 0.05, FDR) in the respective stimulation condition based on staged DRIMseq, DEXseq, and stageR analysis. d Kinetics of SBNO2 ISO1 (left) and ISO1/ISO2 (right) expression in CD14+ monocytes following stimulation with IL-6, IL-10, LPS, or LPS+aIL-10R measured by RT-qPCR (n = 2, error bars: SEM, 2 independent experiments). e Regulation of SBNO2 ISO1 (left) and ISO1/ISO2 (right) expression in MDM following stimulation with LPS, or LPS + aIL-10R analysed by RT-qPCR (ISO1: n = 16, 5 independent experiments, ISO1/ISO2: n = 27, 10 independent experiments, error bars: SEM, non-parametric, two-sided, Friedman test). f Regulation of SBNO2 ISO1 (left) and ISO1/ISO2 (right) expression in MDM following stimulation with IL-10 analysed by RT-qPCR (ISO1: n = 14, 5 independent experiments, ISO1/ISO2: n = 20, 7 independent experiments, non-parametric, two-sided, Mann-Whitney test) shown as relative expression. Source data are provided as a Source Data file for Fig. 1b–f.
Fig. 2
Fig. 2. SBNO2 gene expression and transcript usage is regulated by genetic variation.
a Schematic showing the SBNO2 gene locus, location of variants with GWAS-based association with IBD/CD in SBNO2, and respective location and effect size of SBNO2 ISO1 and ISO2 tQTLs, and ISO1 and ISO2 isoQTLs in LPS-stimulated CD14+ monocytes. b Example of an IBD-associated variant (rs8178977) with a tQTL specifically affecting ISO2 expression in LPS-stimulated CD14+ monocytes. Box plots depict the interquartile range as the lower and upper bounds, respectively. The whiskers represent minimum and maximum, and the centre depicts the median. eQTL analysis was performed with FastQTL and QTLtools using a linear regression. To allow comparison with output of the regression model the optimal number of PC was used to regress out expression changes attributable to the effect of the non-genetic covariates in local association plots. c 3D SNP score was applied to evaluate the functional significance of rs8178977 in 6 categories including 3D interacting genes, enhancer state, promoter state, transcription factor binding sites, sequence motifs altered, and conservation categories. The score for a SNP is calculated using the number of hits in each functional category in human monocytes from the GTEx project and a Poisson distribution model. Source data are provided as a Source Data file for Fig. 2b.
Fig. 3
Fig. 3. Definition of functional gene modules associated with SBNO2 gene and isoform expression in human primary MDM.
a Correlation of the 17 identified WGCNA modules of genes (y-axis) with stimulations, genes, and transcripts of interest (x-axis). Correlation coefficients and p-values are indicated for modules with p-values ≤ 0.05 (Pearson correlation, two-sided test, uncorrected p-values). b MAGMA-based gene-set heritability analysis on WGCNA modules for IBD, CD, and UC. The dot blot illustrates the directionality of association as colour code and the enrichment significance (-log10 p-value) as dot size. Red circular borders around individual dots indicate p-values < 0.05 (one-sided test, uncorrected p-values, as implemented in MAGMA). c Enrichment of GO pathway terms based on those gene modules that were found correlated with ISO1 (ME9 and ME15), ISO2 (ME12 and ME13), and ISO1 and ISO2 (ME6 and ME14) expression (hypergeometric test, Bonferroni correction, padj < 0.05). Source data are provided as a Source Data file for (b, c).
Fig. 4
Fig. 4. siRNA-mediated knockdown of SBNO2 in primary human MDM.
a Volcano plots illustrate differential gene expression following siRNA-mediated SBNO2 knockdown in unstimulated MDM and MDM following 8 h stimulation with IL-10, LPS, or LPS + aIL-10R analysed by RNA-seq and DESeq2 (n = 3, log2 fold change (log2fc) > 0.5, padj < 0.05, FDR). b RT-qPCR validation of target genes of interest found differentially regulated by SBNO2 knockdown in RNA-seq experiments (Independent experiments/donors: IL23A: n = 6/12; IL20, IL24: n = 3/7; CXCR2, CXCR4, KREMEN1: n = 4/9; non-parametric, two-sided, Friedman test). c The bar graph illustrates the overlap of functional pathways (GO Biologic Processes, KEGG pathways, and Reactome Pathways) based on STRING database functional enrichment analysis of SBNO2 knockdown differentially regulated genes in LPS- and LPS + aIL-10R-stimulated MDM. The total number of enriched pathways is indicated. df The heatmap shows the enrichment score of STRING database functional enrichment analysis showing the (e) top 10 downregulated/SBNO2-induced pathways, (f) top 10 upregulated/SBNO2-suppressed pathways, and top 10 enriched pathways without polarity in the dataset based on DESeq2 log2 fold change differential expression ranking. g Examples of enriched functional pathway terms and list of respective top 5 SBNO2-regulated pathway genes (enrichment score). The distribution according to DESeq2 log2 fold change expression across the data are visualized. Source data are provided as a Source Data file for Fig. 4b.
Fig. 5
Fig. 5. Modulation of SBNO2 expression regulates intracellular bacterial killing in primary human MDM and THP-1 MDM.
a Gentamycin protection assay (GPA) in primary MCSF-differentiated human MDM upon siRNA-mediated SBNO2 knockdown using Salmonella typhimurium infection. The bar graph shows S. typhimurium colonies from lysed siSBNO2-treated MDM following overnight culture as % of colonies from lysed control siRNA-treated MDM (n = 9, 3 independent experiments, error bars: Mean with SEM, non-parametric, two-sided, Mann-Whitney test). b Representative LB-agar image showing S. typhimurium colonies from lysed primary MDM following overnight culture (dilution 1:10) according to (a). c GPA in PMA-differentiated WT THP-1 and CRSPR-Cas9 knockout THP-1 (single cell clone 1C9) PMA-differentiated MDM (n = 15, 3 independent experiments, error bars: Mean with SD, non-parametric, two-sided, Mann-Whitney test). d Representative LB-agar image showing S. typhimurium colonies from lysed THP-1 MDM following overnight culture (dilution 1:100) according to (c). e GPA in PMA-differentiated THP-1 MDM upon ectopic expression of SBNO2 isoforms ISO1 and ISO2. Results are shown relative to the number of S. typhimurium colonies obtained from lysed empty vector (eV) expressing THP-1 MDM (n = 15, 6 independent experiments, error bars: Mean with SD, non-parametric, two-sided, Kruskal-Wallis test). f Representative LB-agar image showing S. typhimurium colonies from lysed THP-1 MDM following overnight culture (dilution 1:10) according to (e). g Graphical summary of the model for SBNO2 isoform-specific disease risk and anti-microbial activity in Crohn’s disease, and altered osteoclast differentiation in osteoporosis. Source data are provided as a Source Data file for Fig. 5a–f.

References

    1. Mountjoy E, et al. An open approach to systematically prioritize causal variants and genes at all published human GWAS trait-associated loci. Nat. Genet. 2021;53:1527–1533. doi: 10.1038/s41588-021-00945-5. - DOI - PMC - PubMed
    1. Bolton, C. et al. An integrated taxonomy for monogenic inflammatory bowel disease. Gastroenterology162, 859–876 (2021). - PMC - PubMed
    1. Jostins L, et al. Host-microbe interactions have shaped the genetic architecture of inflammatory bowel disease. Nature. 2012;491:119–124. doi: 10.1038/nature11582. - DOI - PMC - PubMed
    1. Umeno J, et al. Meta-analysis of published studies identified eight additional common susceptibility loci for Crohn’s disease and ulcerative colitis. Inflamm. Bowel Dis. 2011;17:2407–2415. doi: 10.1002/ibd.21651. - DOI - PubMed
    1. Huang H, et al. Fine-mapping inflammatory bowel disease loci to single-variant resolution. Nature. 2017;547:173–178. doi: 10.1038/nature22969. - DOI - PMC - PubMed