. 2024 May 28;15(1):4205.
doi: 10.1038/s41467-024-48465-0.

Human movement and environmental barriers shape the emergence of dengue

Affiliations

Human movement and environmental barriers shape the emergence of dengue

Vinyas Harish et al. Nat Commun. .

Abstract

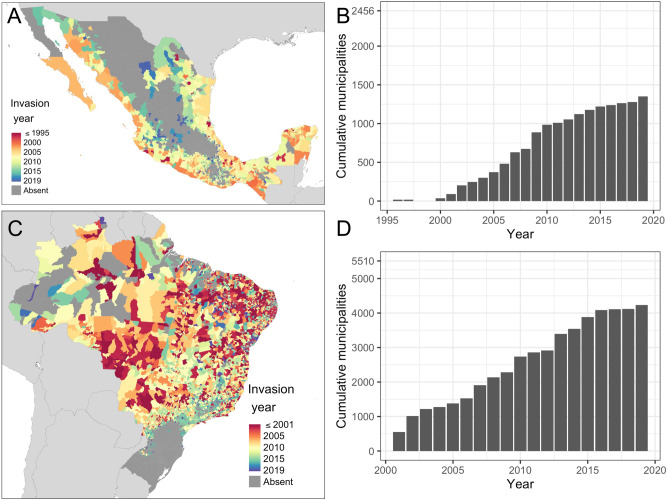
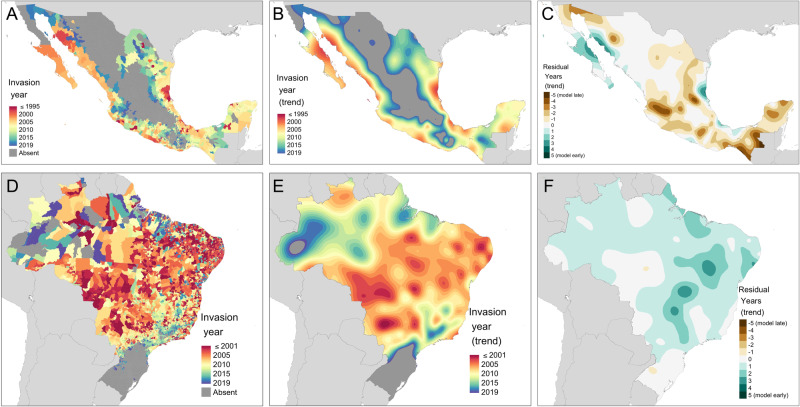
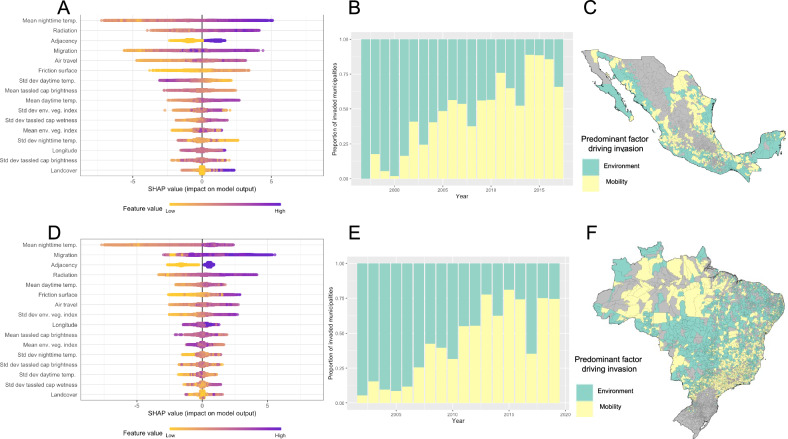
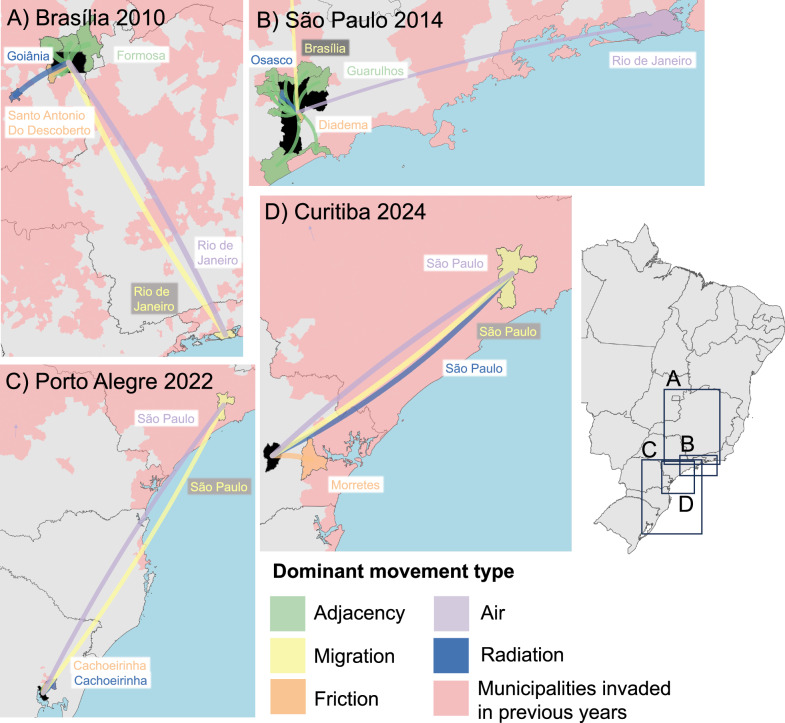
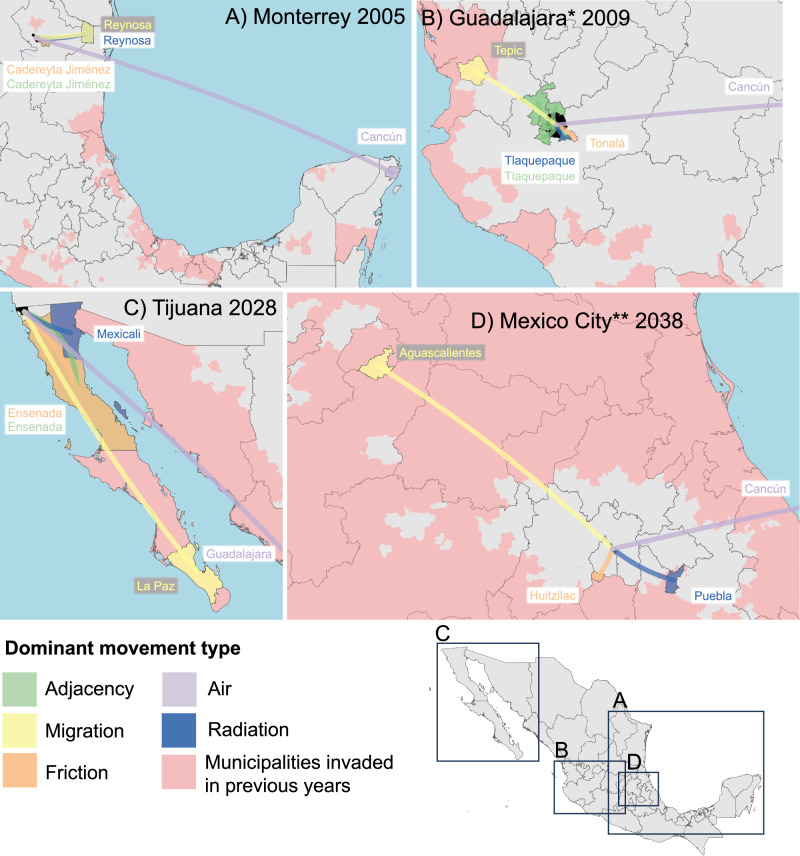
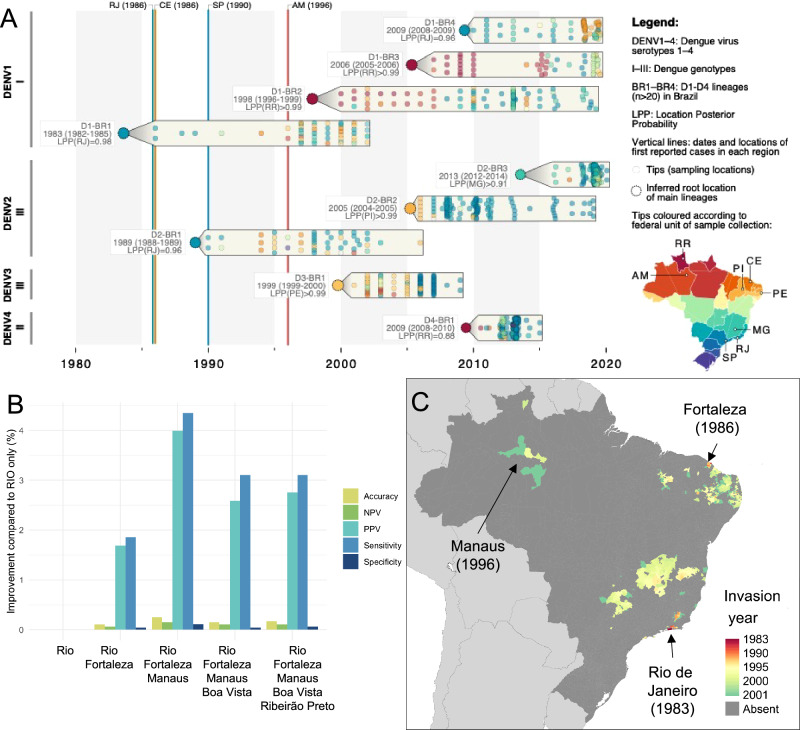
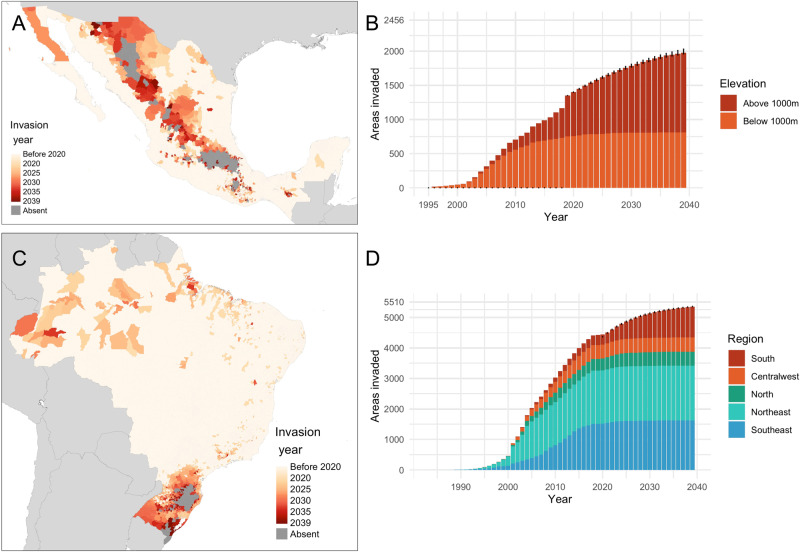
Understanding how emerging infectious diseases spread within and between countries is essential to contain future pandemics. Spread to new areas requires connectivity between one or more sources and a suitable local environment, but how these two factors interact at different stages of disease emergence remains largely unknown. Further, no analytical framework exists to examine their roles. Here we develop a dynamic modelling approach for infectious diseases that explicitly models both connectivity via human movement and environmental suitability interactions. We apply it to better understand recently observed (1995-2019) patterns as well as predict past unobserved (1983-2000) and future (2020-2039) spread of dengue in Mexico and Brazil. We find that these models can accurately reconstruct long-term spread pathways, determine historical origins, and identify specific routes of invasion. We find early dengue invasion is more heavily influenced by environmental factors, resulting in patchy non-contiguous spread, while short and long-distance connectivity becomes more important in later stages. Our results have immediate practical applications for forecasting and containing the spread of dengue and emergence of new serotypes. Given current and future trends in human mobility, climate, and zoonotic spillover, understanding the interplay between connectivity and environmental suitability will be increasingly necessary to contain emerging and re-emerging pathogens.


Conflict of interest statement

K.K. is the founder and CEO of BlueDot, a B corporation that tracks emerging infectious diseases. M.D. is employed at BlueDot and V.H. was a paid intern at BlueDot in 2018. I.B. consults to BlueDot and to the NHL Players’ Association. All other authors report no competing interests.

Figures

Fig. 1
Fig. 1. Spatiotemporal distribution of reported dengue-invaded municipalities (Mexico: 1995-2019, Brazil 2001–2019).
Distribution of reported dengue-invaded municipalities over space (A, C) and time (B, D) for Mexico (A, B) and Brazil (C, D). A municipality is defined as invaded in the year it first exceeds an optimised cumulative incidence threshold (2 cases per 100,000 residents in Mexico, 20 cases per 100,000 residents Brazil, see “Methods” section). Source of Administrative boundaries: The Global Administrative Unit Layers (GAUL) dataset, implemented by FAO within the CountrySTAT and Agricultural Market Information System (AMIS) projects. Source data are provided as a Source Data file.
Fig. 2
Fig. 2. Predicted year of dengue invasion.
Predicted year of invasion for Mexico (AC) and Brazil (DF) since the beginning of national dengue surveillance (Mexico: 1995–2019, Brazil 2001–2019). A, D give raw municipality-level predictions while B, E summarise spread trends using thin-plate splines. C, F show smoothed trends of model residuals where brown colours show areas where dengue was reported before predicted (or never predicted- assigned the value −5) by the model and green vice versa. Source of Administrative boundaries: The Global Administrative Unit Layers (GAUL) dataset, implemented by FAO within the CountrySTAT and Agricultural Market Information System (AMIS) projects. Source data are provided as a Source Data file.
Fig. 3
Fig. 3. Feature importance summaries.
Feature importance of gradient-boosted decision tree models for Mexico (A) and Brazil (D) using Shapley value summary plots. Colours indicate the relative values of each feature (rows) and their impact on model prediction (positive values = increased invasion risk). Features are ordered by mean impact on model output with the top variable conferring the most impact. Temp. temperature, Std dev standard deviation, env. veg. index environmental vegetation index. Timeseries plots and maps show if the contribution to the model-predicted invasion risk is greater for all environmental features or all mobility features for the year in which each municipality was invaded for Mexico (B, C) and Brazil (E, F). Source of Administrative boundaries: The Global Administrative Unit Layers (GAUL) dataset, implemented by FAO within the CountrySTAT and Agricultural Market Information System (AMIS) projects. Source data are provided as a Source Data file.
Fig. 4
Fig. 4. Routes of dengue importation in major municipalities, Brazil.
Predicted routes of dengue importation for select large cities in the past (A, B) and future (C, D) in Brazil. Maps show all previously invaded municipalities (red) and the most connected previously invaded municipality for each different type of human movement included in the spread model for the year in which each city was (or is predicted to be) invaded. The invaded municipality is shaded in black. Source of Administrative boundaries: The Global Administrative Unit Layers (GAUL) dataset, implemented by FAO within the CountrySTAT and Agricultural Market Information System (AMIS) projects. Source data are provided as a Source Data file.
Fig. 5
Fig. 5. Routes of dengue importation in major municipalities, Mexico.
Predicted routes of dengue importation for select large cities in the past (A, B) and future (C, D) in Mexico. Maps show all previously invaded municipalities (red) and the most connected previously invaded municipality for each different type of human movement included in the spread model for the year in which each city was (or is predicted to be) invaded. The invaded municipality is shaded in black. * Zapopan municipality. ** Nezahualcóyotl municipality. Source of Administrative boundaries: The Global Administrative Unit Layers (GAUL) dataset, implemented by FAO within the CountrySTAT and Agricultural Market Information System (AMIS) projects. Source data are provided as a Source Data file.
Fig. 6
Fig. 6. Predicted historical expansion of dengue in Brazil (1983–2001).
Plausible origins of dengue introduction are identified from phylogenetic (horizontal clades) and sporadic outbreak reports (vertical lines) records in (A). The fit of the spread model to the observed distribution in the year 2001 when initiated with different combinations of these sources is shown in (B) (only best-performing model with 1–5 sources shown) with predictions of the best fitting model up to 2001 shown in (C). NPV negative predictive value, PPV positive predictive value. Source of Administrative boundaries: The Global Administrative Unit Layers (GAUL) dataset, implemented by FAO within the CountrySTAT and Agricultural Market Information System (AMIS) projects. Source data are provided as a Source Data file.
Fig. 7
Fig. 7. Predicted future spread of dengue in Mexico and Brazil 2020–2039.
A, C show the spatial distribution while B and D show the breakdown of invaded municipalities over time with respect to elevation in Mexico and geographic region in Brazil respectively. Error bars in B and D show the 95% credible intervals for the total number of municipalities invaded per year for each year from 2020 onwards based on an ensemble of five temporal survival models. Source of Administrative boundaries: The Global Administrative Unit Layers (GAUL) dataset, implemented by FAO within the CountrySTAT and Agricultural Market Information System (AMIS) projects. Source data are provided as a Source Data file.

References

    1. World Health Organization. International Health Regulations (2005) (World Health Organization, 2016).
    1. Bedford J, et al. A new twenty-first century science for effective epidemic response. Nature. 2019;575:130–136. doi: 10.1038/s41586-019-1717-y. - DOI - PMC - PubMed
    1. Morens DM, Folkers GK, Fauci AS. The challenge of emerging and re-emerging infectious diseases. Nature. 2004;430:242–249. doi: 10.1038/nature02759. - DOI - PMC - PubMed
    1. Brady OJ, et al. The association between Zika virus infection and microcephaly in Brazil 2015–2017: An observational analysis of over 4 million births. PLOS Med. 2019;16:e1002755. doi: 10.1371/journal.pmed.1002755. - DOI - PMC - PubMed
    1. Brady OJ, et al. Refining the global spatial limits of dengue virus transmission by evidence-based consensus. PLoS Negl. Trop. Dis. 2012;6:e1760. doi: 10.1371/journal.pntd.0001760. - DOI - PMC - PubMed