Randomized Controlled Trial
. 2024 May 28;15(1):4155.
doi: 10.1038/s41467-024-48355-5.

Gut microbiome remodeling and metabolomic profile improves in response to protein pacing with intermittent fasting versus continuous caloric restriction

Affiliations
Randomized Controlled Trial

Gut microbiome remodeling and metabolomic profile improves in response to protein pacing with intermittent fasting versus continuous caloric restriction

Alex E Mohr et al. Nat Commun. .

Abstract

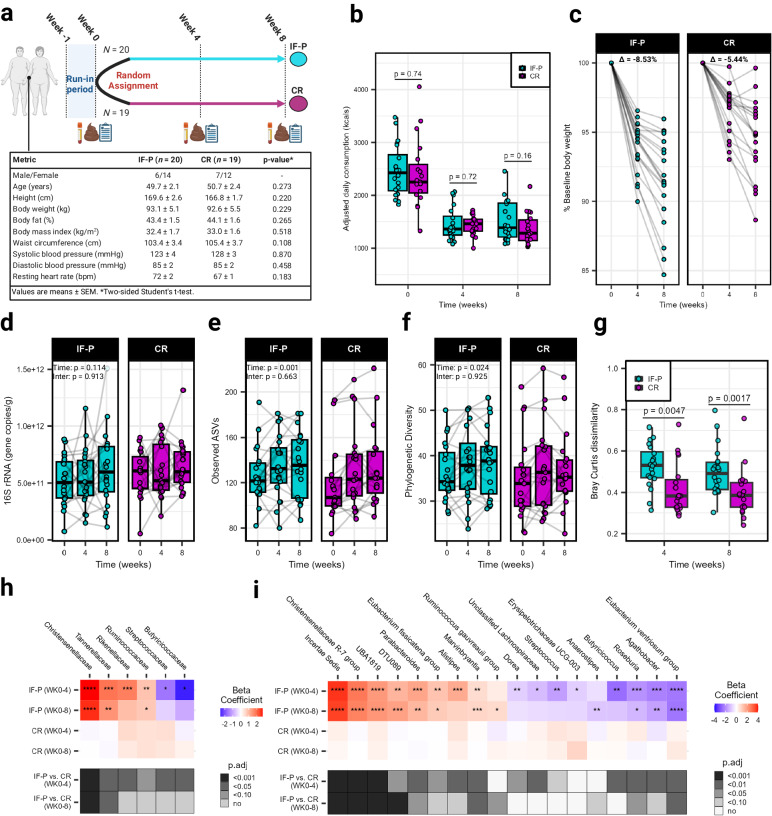
The gut microbiome (GM) modulates body weight/composition and gastrointestinal functioning; therefore, approaches targeting resident gut microbes have attracted considerable interest. Intermittent fasting (IF) and protein pacing (P) regimens are effective in facilitating weight loss (WL) and enhancing body composition. However, the interrelationships between IF- and P-induced WL and the GM are unknown. The current randomized controlled study describes distinct fecal microbial and plasma metabolomic signatures between combined IF-P (n = 21) versus a heart-healthy, calorie-restricted (CR, n = 20) diet matched for overall energy intake in free-living human participants (women = 27; men = 14) with overweight/obesity for 8 weeks. Gut symptomatology improves and abundance of Christensenellaceae microbes and circulating cytokines and amino acid metabolites favoring fat oxidation increase with IF-P (p < 0.05), whereas metabolites associated with a longevity-related metabolic pathway increase with CR (p < 0.05). Differences indicate GM and metabolomic factors play a role in WL maintenance and body composition. This novel work provides insight into the GM and metabolomic profile of participants following an IF-P or CR diet and highlights important differences in microbial assembly associated with WL and body composition responsiveness. These data may inform future GM-focused precision nutrition recommendations using larger sample sizes of longer duration. Trial registration, March 6, 2020 (ClinicalTrials.gov as NCT04327141), based on a previous randomized intervention trial.


Conflict of interest statement

P.J.A. is a consultant for Isagenix International LLC, the study’s sponsor, he is an advisory board member of the International Protein Board (iPB), and he receives financial compensation for books and keynote presentations on protein pacing (www.paularciero.com). Eric Gumpricht is employed by Isagenix International, LLC, the funding source for this research. Isagenix International, LLC had no role in the study design, data collection, analysis, or decision to publish. No authors have financial interests regarding the outcomes of this investigation. The other authors declare no competing interests.

Figures

Fig. 1
Fig. 1. Study characteristics and changes in the gut microbiome (GM) between intermittent fasting with protein pacing (IF-P) and continuous caloric restriction (CR) diet groups over eight weeks.
a Study design with baseline participant characteristics. A registered dietitian counseled individuals from both groups each week. Time points with data collection are shown for both IF-P and CR participants. Icons created using BioRender.com. b Total daily caloric intake at each time point was not significantly different between IF-P and CR diet groups (two-sided Student’s t-test, p < 0.05). Adjusted values are displayed by dividing total weekly intake by seven, to account for the fasting periods of IF-P. c IF-P participants lost significantly more weight over time versus CR participants. Points connected by line represent percent of weight compared to baseline weight for each participant. d Overall gut microbial colonization, as demonstrated by qPCR-based quantification of 16S rRNA gene copies per gram wet weight was unaffected by time or intervention (linear-mixed effects [LME] model, two-sided p > 0.05). Alpha diversity metrics, e observed amplicon sequence variants (ASVs), and f Phylogenetic diversity at the ASV level significantly increased over time, independent of the intervention. g Intra-individual changes in GM community structure from baseline to weeks four and eight in IF-P participants shifted significantly throughout the IF-P intervention compared to CR as measured by the Bray-Curtis dissimilarity index (two-sided Wilcoxon rank-sum test). All box and whiskers plots display the box ranging from the first to the third quartile, and the center the median value, while the whiskers extend from each quartile to the minimum or maximum values. Heatmap of significant changes in h family- and i genus-level bacteria by intervention. Colors indicate the within-group change beta coefficients over time for each cell, and asterisks denote significance. Black-white annotations on the bottom denote the significance of between-group change difference (by MaAsLin2 group × time interactions; p-values were corrected to produce adjusted values [p.adj] using the Benjamini–Hochberg method). For all panels, IF-P: n = 20, CR: n = 19. Source data are provided as a Source Data file.
Fig. 2
Fig. 2. Differences in plasma cytokine marker concentrations between the IF-P and CR diet groups.
a IL-4, b IL-6, c IL-8, and d IL-13: Each panel shows the cytokine concentration levels. Significant time effects and interaction effects (group × time) were detected using linear-mixed effects models (LME, two-sided p < 0.05), indicating differential changes over the intervention period. IF-P participants exhibited significant increases in cytokine levels compared to baseline, as evidenced by pairwise comparisons adjusted for multiple testing using the Benjamini–Hochberg method (two-sided p.adj < 0.10). All box and whiskers plots display the box ranging from the first to the third quartile, and the center the median value, while the whiskers extend from each quartile to the minimum or maximum values. For all panels, IF-P: n = 20, CR: n = 19. Source data are provided as a Source Data file.
Fig. 3
Fig. 3. Differences in circulating metabolite signatures and metabolic pathways between the IF-P and CR diet groups.
a Abundance and log fold-change of significant plasma metabolites between IF-P and CR groups as determined by a general linear model (GLM) adjusted for age, sex, and time. All GLM analyses utilized two-sided p-values, with multiple testing corrections applied using the Benjamini–Hochberg method (p.adj). Metabolome pathway analysis was conducted for b IF-P and c CR using all reliably detected metabolites showing significantly altered pathways (p.adj < 0.10) with moderate and above impact (>0.10). Impact scores were calculated using a hypergeometric test, while significance was assessed via a test of relative betweenness centrality, emphasizing the changes in metabolic network connectivity. For all panels, IF-P: n = 20, CR: n = 19. Source data are provided as a Source Data file.
Fig. 4
Fig. 4. Factors derived from the integration of the gut microbiome and plasma metabolome.
a The cumulative proportion of total variance explained (R2) and proportion of total variance explained by eight individual latent factors for each omic layer. b Spearman correlation matrix of the eight latent factors and clinical anthropometric and dietary covariates. Each circle represents a separate association, with the size indicating the significance (-log10 (p-values)) and the color representing the effect size (hue) with its direction (red: positive; blue: negative). All correlations are calculated using two-sided tests. Asterisks within a circle denote significance after adjustment with the Benjamini–Hochberg method. c Scatter plot of Factors 1 and 6, with each dot representing a sample colored by intervention. Box and whisker plots illustrate significant differences between groups after adjusting for multiple testing using the Benjamini–Hochberg method (Wilcoxon rank-sum test; top = Factor 1, p.adj = 3.2e-04; right = Factor 6, p.adj = 0.007). The plots show boxes ranging from the first to the third quartile and the median at the center, with whiskers extending to the minimum and maximum values. d Factor 1 and 6 loadings of genera and metabolites with the largest weights annotated. Symbols: *p.adj < 0.10, **p.adj < 0.01, ***p.adj < 0.001, ****p.adj < 1.0e-04. For all panels, IF-P: n = 20, CR: n = 19. Source data are provided as a Source Data file.
Fig. 5
Fig. 5. Gut microbiome composition and metabolic differences in weight loss responsiveness to a IF-P diet.
a Relative weight loss over the eight-week intervention for each participant in the IF-P group. b NMDS ordination showed the personalized trajectories of participants’ microbiomes over time. Dotted lines connect the same individual and point toward the final sample collection. No significant time or group × time interaction effects for alpha diversity metrics, c observed species, and d the Shannon index. Box and whiskers plots display the box ranging from the first to the third quartile, and the center the median value, while the whiskers extend from each quartile to the minimum or maximum values. Volcano plots displaying differential abundance between High and Low weight loss responders for e microbial species and f functional pathways. Significant features were more enriched in High and Low weight loss responders colored orange and light blue, respectively. g Alluvial plot displaying the fecal metabolite profile at the subclass level (Human Microbiome Database). Most abundant metabolite subclasses displayed (i.e., ≥1%). Metabolome pathway analysis for h High and i Low weight loss responders using all reliably detected fecal metabolites showing altered pathways with moderate and above impact (>0.10). Impact was calculated using a hypergeometric test, while significance was determined using a test of relative betweenness centrality. j Grid-fused least absolute shrinkage and selection operator (GFLASSO) regression of species from differential abundance analysis displayed correlative relationships with fecal metabolites. Species with greater abundance in High (High > Low) and Low (Low > High) weight loss responders are separate‘. For all panels, High: n = 5, Low: n = 5. Source data are provided as a Source Data file.
Fig. 6
Fig. 6. Survey of a case-study participant’s gut microbiome over a year-long period on an IF-P weight loss and maintenance regimen.
Change in alpha diversity metrics a observed species and b Shannon index with percentage of baseline body weight. c Bray-Curtis dissimilarity at the species level with d top PERMANOVA model coefficients (analysis: species~time). e Alluvial plot displaying the variation in abundance of the 20 most prevalent bacteria over time. For visual clarity, the less abundant taxa are not displayed. f Canberra distance of fecal metabolome with g top PERMANOVA model coefficients (analysis: pathway~time). h Pathway analysis of fecal metabolites comparing baseline to subsequent sample collections. Data are plotted as -log10(p) versus pathway impact. Node size corresponds to the proportion of metabolites captured in each pathway set, while node color signifies significance. Impact was calculated using a hypergeometric test, while significance was determined using a test of relative betweenness centrality. No p-value adjustments were made. Source data are provided as a Source Data file.

References

    1. Asnicar F, et al. Microbiome connections with host metabolism and habitual diet from 1,098 deeply phenotyped individuals. Nat. Med. 2021;27:321–332. doi: 10.1038/s41591-020-01183-8. - DOI - PMC - PubMed
    1. Li M, et al. Gut microbiota-bile acid crosstalk contributes to the rebound weight gain after calorie restriction in mice. Nat. Commun. 2022;13:2060. doi: 10.1038/s41467-022-29589-7. - DOI - PMC - PubMed
    1. Machado ACD, et al. Diet and feeding pattern modulate diurnal dynamics of the ileal microbiome and transcriptome. Cell Rep. 2022;40:111008. doi: 10.1016/j.celrep.2022.111008. - DOI - PMC - PubMed
    1. von Schwartzenberg RJ, et al. Caloric restriction disrupts the microbiota and colonization resistance. Nature. 2021;595:272–277. doi: 10.1038/s41586-021-03663-4. - DOI - PMC - PubMed
    1. Maifeld A, et al. Fasting alters the gut microbiome reducing blood pressure and body weight in metabolic syndrome patients. Nat. Commun. 2021;12:1970. doi: 10.1038/s41467-021-22097-0. - DOI - PMC - PubMed

Publication types

MeSH terms

Substances

Associated data