. 2024 May 28;15(5):366.
doi: 10.1038/s41419-024-06735-1.

Targeting ARNT attenuates chemoresistance through destabilizing p38α-MAPK signaling in glioblastoma

Affiliations

Targeting ARNT attenuates chemoresistance through destabilizing p38α-MAPK signaling in glioblastoma

Wahafu Alafate et al. Cell Death Dis. .

Abstract

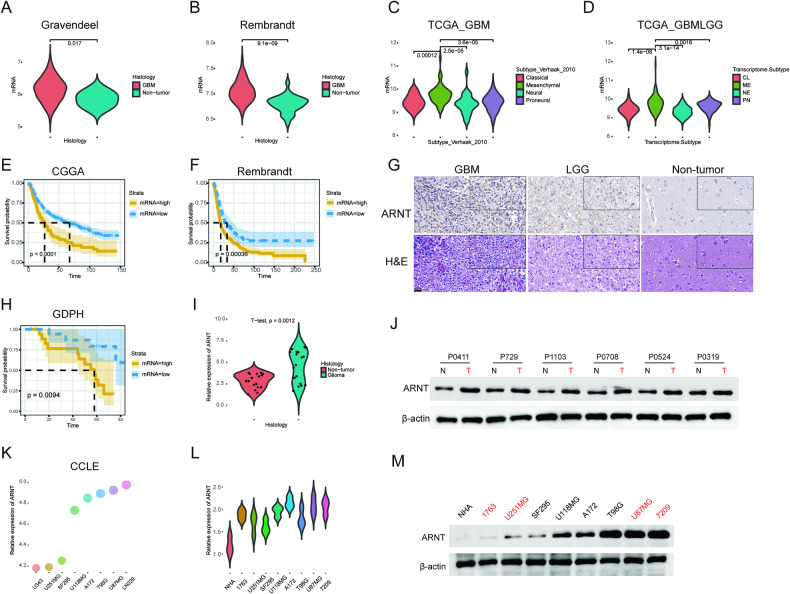
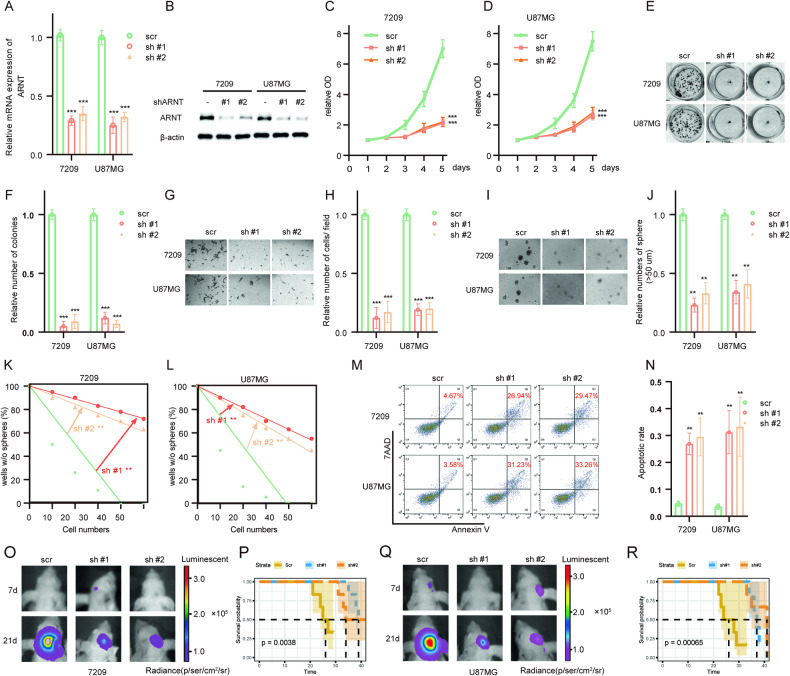
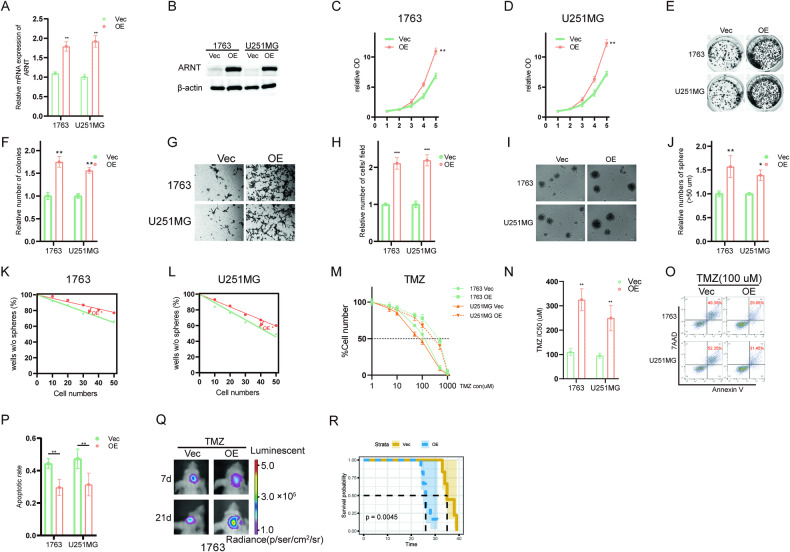
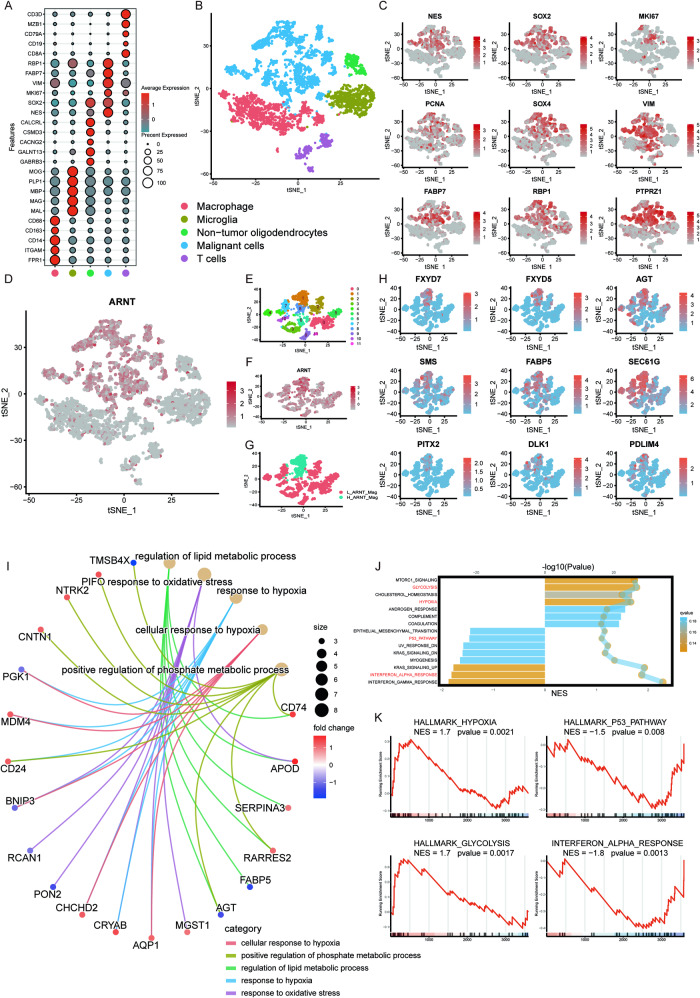
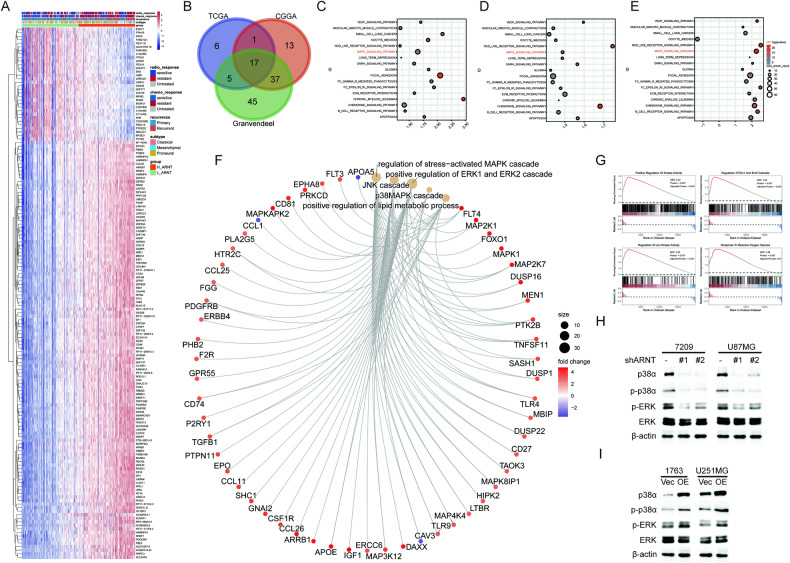
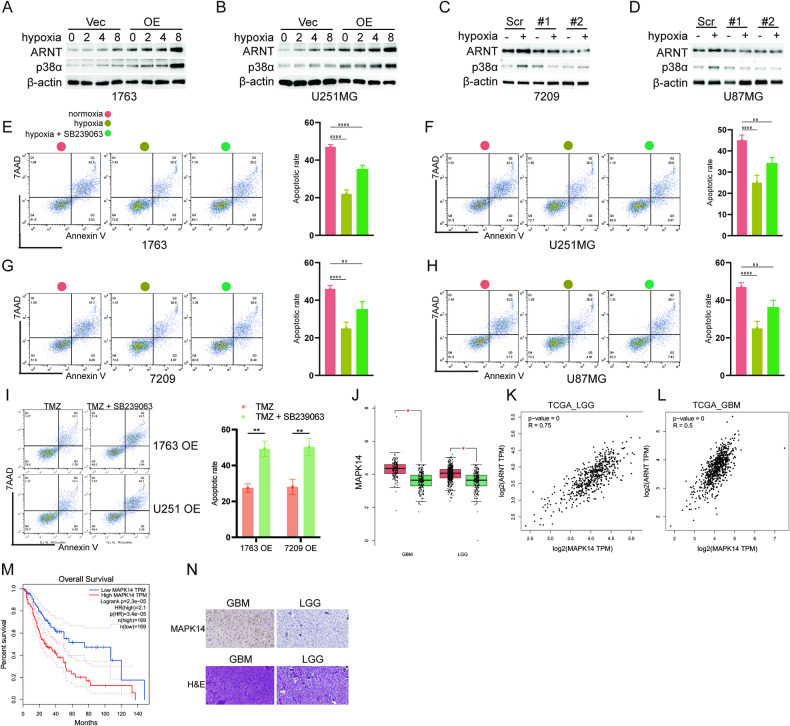
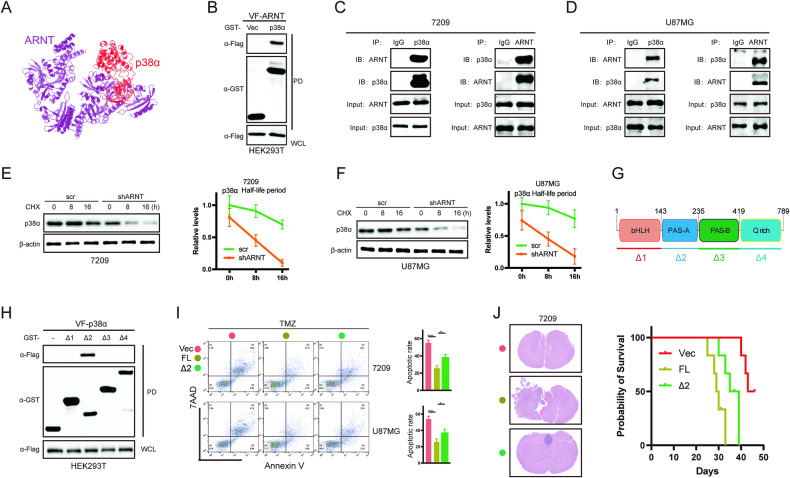
Glioblastoma (GBM) is the most aggressive and lethal brain tumor in adults. This study aimed to investigate the functional significance of aryl hydrocarbon receptor nuclear translocator (ARNT) in the pathogenesis of GBM. Analysis of public datasets revealed ARNT is upregulated in GBM tissues compared to lower grade gliomas or normal brain tissues. Higher ARNT expression correlated with the mesenchymal subtype and poorer survival in GBM patients. Silencing ARNT using lentiviral shRNAs attenuated the proliferative, invasive, and stem-like capabilities of GBM cell lines, while ARNT overexpression enhanced these malignant phenotypes. Single-cell RNA sequencing uncovered that ARNT is highly expressed in a stem-like subpopulation and is involved in regulating glycolysis, hypoxia response, and stress pathways. Mechanistic studies found ARNT activates p38 mitogen-activated protein kinase (MAPK) signaling to promote chemoresistance in GBM cells. Disrupting the ARNT/p38α protein interaction via the ARNT PAS-A domain restored temozolomide sensitivity. Overall, this study demonstrates ARNT functions as an oncogenic driver in GBM pathogenesis and represents a promising therapeutic target.


Conflict of interest statement

The authors declare no competing interests.

Figures

Fig. 1
Fig. 1. ARNT is significantly upregulated in GBM patients.
A Analysis of ARNT gene expression in GBM versus non-tumor tissue using the Gravendeel database. Expression was compared between groups using the Student’s t test. B Analysis of ARNT gene expression in GBM versus non-tumor tissue using the Rembrandt database. Expression was compared between groups using the Student’s t test. C Analysis of ARNT gene expression in different WHO molecular GBM subtypes using the TCGA_GBM database. Expression was compared between subtypes using the Wilcoxon test. D Analysis of ARNT gene expression in GBM versus lower grade gliomas using the TCGA_GBMLGG database. Expression was compared between groups using the Wilcoxon test. E Kaplan–Meier survival analysis of GBM patients stratified by ARNT expression using the CGGA database. Groups were compared using the log-rank test. F Kaplan–Meier survival analysis of GBM patients stratified by ARNT expression using the Rembrandt database. Groups were compared using the log-rank test. G Representative immunohistochemistry images of ARNT staining in glioma samples from the GDPH Glioma database. Epilepsy brain tissue was used as a negative control. H Kaplan–Meier survival analysis of GBM patients stratified by ARNT mRNA level obtained from patients’ samples. I qRT-PCR analysis of ARNT mRNA expression in glioma tumors versus adjacent tissue using the GDPH Glioma database. Expression was compared between groups using the Student’s t test. J Western blot analysis of ARNT protein levels in patient tissue samples. β-actin was used as a loading control. K Analysis of ARNT gene expression in GBM cell lines from the CCLE database. L qRT-PCR analysis of ARNT mRNA expression in primary GBM cells, commercial GBM lines, and normal human astrocytes (NHA). M Western blot analysis of ARNT protein levels in cultured cell lines. β-actin was used as a loading control.
Fig. 2
Fig. 2. Silencing ARNT attenuates the malignancy of glioma cell lines.
A qRT-PCR analysis of ARNT mRNA expression in 7209 and U87MG cells transfected with lentiviral shARNT #1, #2 or negative control. B Western blot analysis of ARNT protein expression in 7209 and U87MG cells transduced with lentiviral shARNT #1, #2 or control. C, D CCK8 proliferation assays of 7209 and U87MG cells after ARNT knockdown. E, F Colony formation assays of 7209 and U87MG cells after transduction with lentiviral shARNT #1, #2 or control. G, H Transwell invasion assays of 7209 and U87MG cells transduced with lentiviral shARNT #1, #2 or control. I, J Sphere formation assays of 7209 and U87MG cells after ARNT knockdown. K, L Limited dilution assays were performed on 7209 and U87MG cells transduced with lentiviruses expressing shARNT #1, shARNT #2, or negative control shRNA. M, N Flow cytometry analysis of apoptosis in 7209 and U87MG cells transduced with lentiviral shARNT #1, #2 or negative control. Cells were stained with Annexin V and propidium iodide. O Luciferase-expressing 7209 cells, with or without ARNT depletion, were intracranially injected into nude mice (n = 6 for each group). The luminescence intensity of tumors in representative mice at the indicated time points is depicted. P Kaplan–Meier analysis of 7209 tumor-bearing mice. Q Luciferase-expressing U87MG cells, with or without ARNT depletion, were intracranially injected into nude mice (n = 6 for each group). The luminescence intensity of tumors in representative mice at the indicated time points is depicted. R Kaplan–Meier analysis of U87MG tumor-bearing mice. Statistical significance was determined by Student’s t test, *p < 0.05 was considered significant.
Fig. 3
Fig. 3. ARNT overexpression enhances TMZ resistance in GBM.
A qRT-PCR analysis of ARNT mRNA expression in 1763 and U251MG cells transduced with lentiviral ARNT or empty vector control. B Western blot analysis of ARNT protein levels in 1763 and U251MG cells after transduction with lentiviral ARNT or control vector. C, D CCK8 proliferation assays of 1763 and U251MG cells after ARNT overexpression. E, F Colony formation and sphere formation assays of 1763 and U251MG cells transduced with lentiviral ARNT or control vector. G, H Transwell invasion assays of 1763 and U251MG cells after ARNT overexpression. I, J Sphere formation assays of 1763 and U251MG cells transduced with lentiviral ARNT or control vector. K, L Limited dilution assays of 1763 and U251MG cells after ARNT overexpression. M, N Dose-response curves of 1763 and U251MG cells treated with TMZ after transduction with lentiviral ARNT or control vector. Cell viability was assessed by CCK8 assay. O, P Flow cytometry analysis of apoptosis in 1763 and U251MG cells transduced with lentiviral ARNT or control vector. Cells were stained with Annexin V and propidium iodide. Q Luciferase-expressing 1763 cells, with or without ARNT overexpression, were intracranially injected into nude mice (n = 6 for each group), then treated with 30 mg/kg of TMZ. The luminescence intensity of tumors in representative mice at the indicated time points is depicted. R Kaplan–Meier analysis was performed on 1763 tumor-bearing mice. Statistical significance was determined by one-way ANOVA followed by Dunnett’s post-test, *p < 0.05 was considered significant.
Fig. 4
Fig. 4. Functional roles of ARNT depicted in single-cell RNA sequencing.
A Bubble plot showing differentially expressed genes across indicated cell clusters. B t-SNE plot depicting spatial distribution of various cell types in tumor and adjacent cells, colored by identity. C Expression of cancer stem cell markers in distinct clusters. D ARNT gene expression across clusters. E Clustering of malignant cells. F ARNT gene expression in relation to tumor malignancy across all malignant cells. G t-SNE plot dividing malignant cells into two categories based on ARNT expression. H Top 9 differentially expressed genes with highest expression in ARNT-high malignant cells. I Gene ontology analysis of differentially expressed genes in the ARNT-upregulated group. J Bubble plots of significantly enriched signaling pathways in malignant cells. K GSEA showing positive correlation between ARNT and hypoxia/glycolysis pathways and negative correlation with p53/alpha-response pathways.
Fig. 5
Fig. 5. ARNT regulates p38/MAPK signaling.
A Hierarchical clustering analysis of differentially expressed genes in ARNT-high versus ARNT-low GBMs. B Venn diagram showing 17 overlapping signaling pathways correlated with high ARNT expression and tumor malignancy. CE GSEA enrichment plots using transcriptome data from CGGA, TCGA, and Gravendeel GBM cohorts. F Gene ontology analysis of differentially expressed genes from RNA-seq of 1763-ARNT overexpressing cells versus control. G GSEA analysis of 1763-ARNT RNA-seq data showing positive correlation between ARNT and p38/MAPK signaling. H Western blots of p38, p-p38, p-ERK, and total ERK in 7209 and U87MG cells after shARNT knockdown. I Western blots of p38, p-p38, p-ERK, and total ERK in 1763 and U251-ARNT overexpressing cells versus control. β-actin was used as a loading control.
Fig. 6
Fig. 6. Hypoxia induces TMZ resistance in a p38α/MAPK-dependent manner.
A, B Western blots showing ARNT and p38α expression in 1763 and U251-ARNT overexpression cells versus vector control under hypoxia. C, D Western blots showing ARNT and p38α expression in 7209 and U87-shARNT cells versus control under normoxia or hypoxia (8 h). EH Flow cytometry analyzing annexin V/propidium iodide staining and apoptosis in 1763, U251, 7209, and U87 cells after TMZ treatment under normoxia, hypoxia, or hypoxia + p38 inhibitor SB239063. I Flow cytometry analyzing annexin V/propidium iodide staining and apoptosis in 1763 and U251 overexpression with or without p38 inhibitor SB239063. J MAPK14 gene expression in GBM, LGG, and normal tissue from GEPIA database (*p < 0.05, Student’s t test). K, L Correlation between MAPK14 and ARNT expression analyzed by GEPIA online tool (R = Pearson correlation coefficient). M Kaplan-Meier analysis of MAPK14 in TCGA-GBMLGG database from GEPIA. N Representative ARNT IHC images in GBM and LGG from GDPH glioma samples.
Fig. 7
Fig. 7. Disrupting ARNT/p38α protein complex attenuates chemoresistance in GBM cells.
A In silico modeling of ARNT (purple) in complex with p38α (red) by Cluspro. B GST-pulldown assay validating ARNT-p38α interaction. C, D Co-immunoprecipitation using ARNT or p38α antibodies in 7209 and U87MG cells. Nonspecific IgG used as negative control. E, F p38α protein levels in 7209 and U87MG cells pretreated with or without shARNT after cycloheximide (CHX) treatment. β-actin was a loading control. G Schematic of ARNT protein structural domains. H GST-pulldown assay verifying interaction of ARNT domains with p38α. I Flow cytometry analyzing 7209 and U87MG cells after TMZ treatment and transduction with vector, full-length ARNT, or ARNT PAS-A domain. J Left panel H&E images of mouse brain sections after intracranial xenograft transplantation under different conditions. Right panel Kaplan–Meier survival analyses of the xenograft mouse model under the indicated conditions.

Similar articles

Cited by

References

    1. Guo QL, Dai XL, Yin MY, Cheng HW, Qian HS, Wang H, et al. Nanosensitizers for sonodynamic therapy for glioblastoma multiforme: current progress and future perspectives. Mil Med Res. 2022;9:26. - PMC - PubMed
    1. Domenech M, Hernandez A, Plaja A, Martinez-Balibrea E, Balana C. Hypoxia: the cornerstone of glioblastoma. Int J Mol Sci. 2021;22:12608. doi: 10.3390/ijms222212608. - DOI - PMC - PubMed
    1. Khan I, Baig MH, Mahfooz S, Imran MA, Khan MI, Dong JJ, et al. Nanomedicine for glioblastoma: progress and future prospects. Semin Cancer Biol. 2022;86:172–86. doi: 10.1016/j.semcancer.2022.06.007. - DOI - PubMed
    1. Alafate W, Xu D, Wu W, Xiang J, Ma X, Xie W, et al. Loss of PLK2 induces acquired resistance to temozolomide in GBM via activation of notch signaling. J Exp Clin Cancer Res. 2020;39:239. doi: 10.1186/s13046-020-01750-4. - DOI - PMC - PubMed
    1. Cheng J, Meng J, Zhu L, Peng Y. Exosomal noncoding RNAs in Glioma: biological functions and potential clinical applications. Mol Cancer. 2020;19:66. doi: 10.1186/s12943-020-01189-3. - DOI - PMC - PubMed

Publication types

MeSH terms

Substances