. 2024 May 28;15(1):4546.
doi: 10.1038/s41467-024-48507-7.

Multi-omics in nasal epithelium reveals three axes of dysregulation for asthma risk in the African Diaspora populations

Affiliations

Multi-omics in nasal epithelium reveals three axes of dysregulation for asthma risk in the African Diaspora populations

Brooke Szczesny et al. Nat Commun. .

Abstract

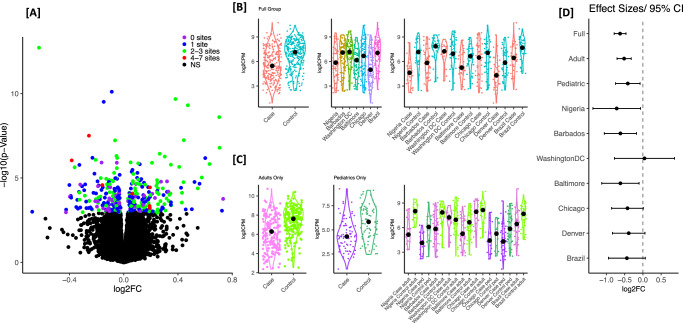
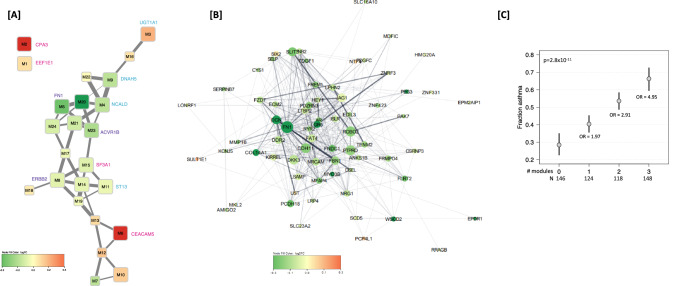
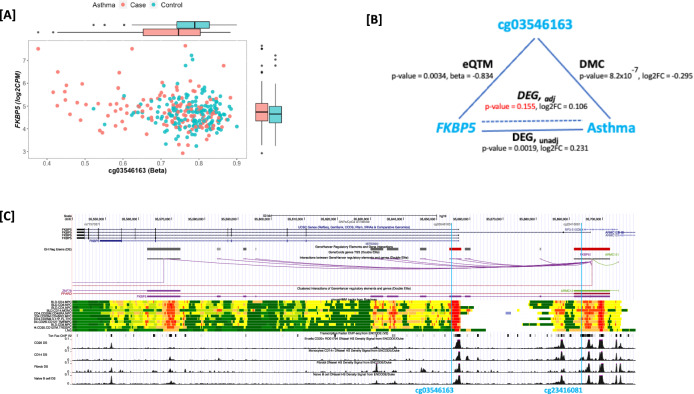
Asthma has striking disparities across ancestral groups, but the molecular underpinning of these differences is poorly understood and minimally studied. A goal of the Consortium on Asthma among African-ancestry Populations in the Americas (CAAPA) is to understand multi-omic signatures of asthma focusing on populations of African ancestry. RNASeq and DNA methylation data are generated from nasal epithelium including cases (current asthma, N = 253) and controls (never-asthma, N = 283) from 7 different geographic sites to identify differentially expressed genes (DEGs) and gene networks. We identify 389 DEGs; the top DEG, FN1, was downregulated in cases (q = 3.26 × 10⁻⁹) and encodes fibronectin which plays a role in wound healing. The top three gene expression modules implicate networks related to immune response (CEACAM5; p = 9.62 × 10⁻¹⁶ and CPA3; p = 2.39 × 10⁻¹⁴) and wound healing (FN1; p = 7.63 × 10⁻⁹). Multi-omic analysis identifies FKBP5, a co-chaperone of glucocorticoid receptor signaling known to be involved in drug response in asthma, where the association between nasal epithelium gene expression is likely regulated by methylation and is associated with increased use of inhaled corticosteroids. This work reveals molecular dysregulation on three axes - increased Th2 inflammation, decreased capacity for wound healing, and impaired drug response - that may play a critical role in asthma within the African Diaspora.


Conflict of interest statement

K.C.B. declares Royalties from UpToDate. The remaining authors declare no competing interests.

Figures

Fig. 1
Fig. 1. Summary of the DEG analysis for active asthma in CAAPA.
Panel A Volcano plot of DEG analysis for asthma in the full combined group (N = 253 cases, N = 283 controls) from all 7 sites. Color represents the number of sites where the uncorrected significance for the DEG analysis within the site was p-value < 0.05, and genes that did not cross FDR of 0.05 in full combined analysis are retained as black. Panel B Combined gene expression for top gene FN1 by site. Panel C Gene expression for top gene FN1 stratified by adult vs. pediatrics. Panel D DEG effect sizes (log2 fold change and the 95% confidence interval) for top gene FN1 looking at the full combined analysis, analysis stratified by adults vs. pediatrics and the analysis within each site. CAAPA sites are ordered based on average African ancestry (%YRI) from highest (Nigeria) to lowest (Brazil). The test used in the DEG analysis was a moderated two-sided t-statistic. Source data are provided as a Source Data file.
Fig. 2
Fig. 2. Differential module expression based on the N = 1326 DEGs with FDR < 0.15 for active asthma.
Panel A Module connectivity network for the 24 modules. Each node represents a module, and each edge represents a significant positive Pearson pairwise correlation of module expression (correlation >0.5). Node color intensity corresponds to log2FC in DE Module analysis for asthma (red upregulated in cases, green downregulated in cases). Differentially expressed modules are larger in size (q < 0.05). Edge weight indicates correlation (wider edges higher correlation of module expression). Panel B STRING network retrieved for genes assigned to module M5 with hub gene FN1. Each node represents a gene and each edge represents a protein-protein interaction with a stringdb score >0.15. Node color intensity corresponds to log2FC in DE analysis of asthma (red upregulated in cases, green downregulated in cases). Node size was made proportional to the number of interactions of the node divided by maximum number of interactions of a node in the gene module (dg/max dg of module). Unconnected nodes were not included. Edge weight and transparency indicate stringdb score (wider, darker edges indicate higher score). Panel C Fraction of asthma cases and ORs for asthma if an individual was in the upper median for any one, any two and all three modules (M4, M5, M6). Fitted probabilities (gray dots) and 95% confidence intervals (black lines) were derived from a logistic model with number of modules as an additive predictor. Source data are provided as a Source Data file.
Fig. 3
Fig. 3. Epigenetic mechanism relating gene expression to asthma for FKBP5.
Panel A Scatter plot of methylation (beta) values at cg03546163 vs gene expression (log2 CPM) values for FKBP5 and box plots showing median, lower and upper quartiles, whiskers extending to the furthest data point no more than 1.5 times the distance between the lower and upper quartiles, and outliers, by asthma case and control status for N = 298 individuals. Panel B Effect sizes and unadjusted p-values from two-sided multivariate linear regression models for DMC analysis (cg03546163 and asthma, N = 331), eQTM analysis (cg03546163 and FKBP5 expression, N = 298) and DEG (FKBP5 expression and asthma, N = 298) analysis pre- and post-adjustment for methylation at the CpG (labeled DEG, unadj and DEG, adj). Panel C UCSC Genome Browser view of the FKBP5 locus, indicating locations of cg03546163 (pcHiC) and cg23416081 (5 kb of TSS) showing interaction between the GeneHancer regulatory elements at these two regions. Publicly available data from tracks displayed includes location of exonic and intronic gene regions from the UCSC gene annotation; regulatory elements, genes and their interactions from GeneHancer, in detailed and clustered views; chromHMM tracks from Roadmap; transcription factor CHIP-seq from ENCODE; and DNAse hypersensitivity density signal from ENCODE for CD20 + B-cells, CD14+ monocytes, fibroblasts and naïve B-cells. Source data are provided as a Source Data file.

References

    1. World Health Organization. Asthma Fact Sheets. https://www.who.int/news-room/fact-sheets/detail/asthma Accessed 5/10/2024.
    1. Akinbami, L. J., Moorman, J. E. & Liu, X. Asthma prevalence, health care use, and mortality: United States, 2005-2009. 1–14 (National Health Statistics Report, 2011). - PubMed
    1. Barnes KC. Genomewide association studies in allergy and the influence of ethnicity. Curr. Opin. allergy Clin. Immunol. 2010;10:427–433. - PMC - PubMed
    1. Barnes KC, Grant AV, Hansel NN, Gao P, Dunston GM. African Americans with asthma: genetic insights. Proc. Am. Thorac. Soc. 2007;4:58–68. - PMC - PubMed
    1. Guilbert T, et al. Racial Disparities in Asthma-Related Health Outcomes in Children with Severe/Difficult-to-Treat Asthma. J. Allergy Clin. Immunol. Pr. 2019;7:568–577. - PubMed