. 2024 May 28;14(1):216.
doi: 10.1038/s41398-024-02952-6.

Mice with deficiency in Pcdh15, a gene associated with bipolar disorders, exhibit significantly elevated diurnal amplitudes of locomotion and body temperature

Affiliations

Mice with deficiency in Pcdh15, a gene associated with bipolar disorders, exhibit significantly elevated diurnal amplitudes of locomotion and body temperature

Daisuke Mori et al. Transl Psychiatry. .

Abstract

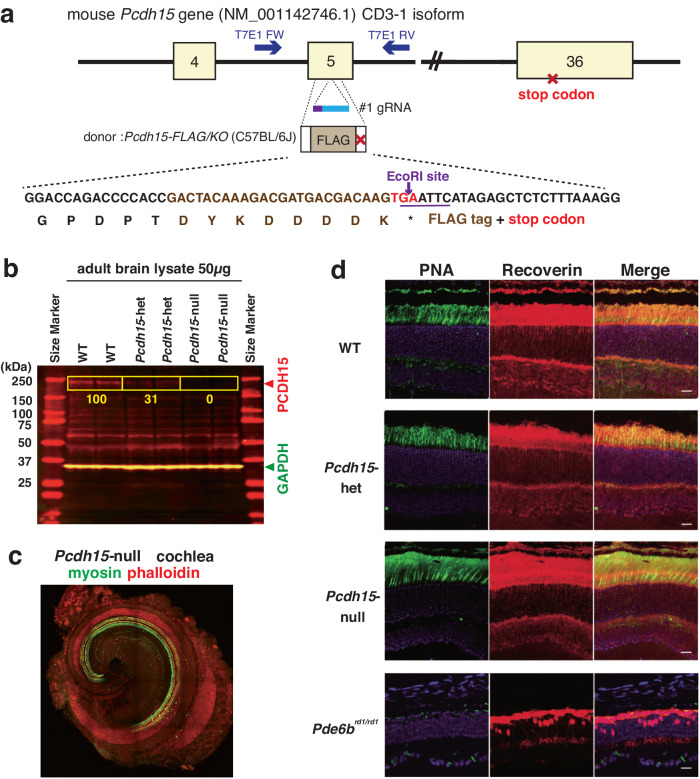
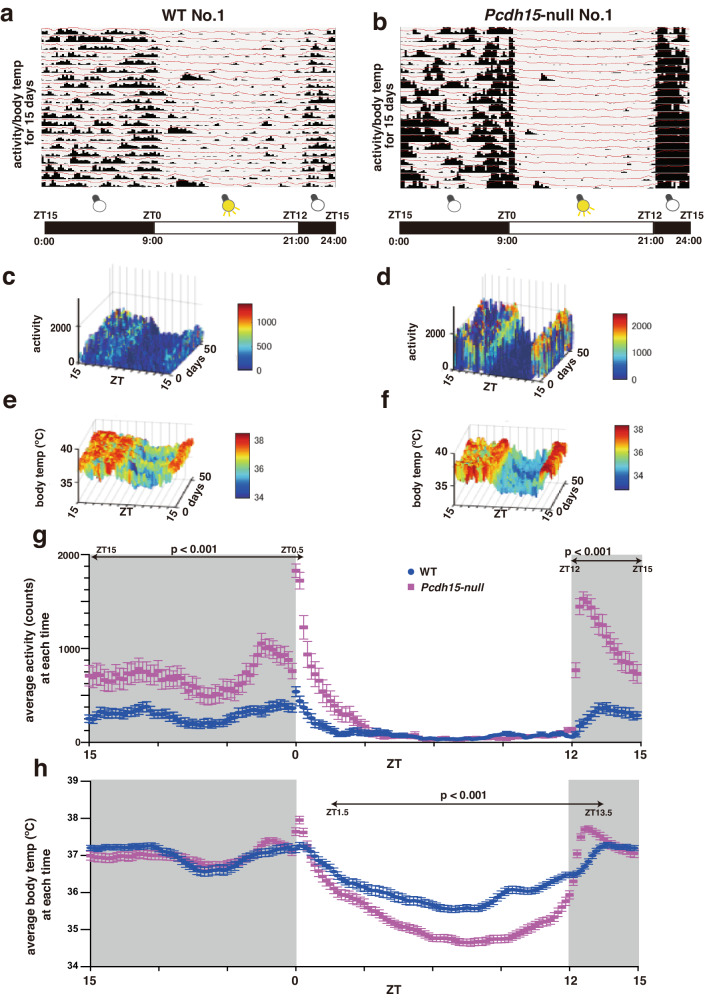
Genetic factors significantly affect the pathogenesis of psychiatric disorders. However, the specific pathogenic mechanisms underlying these effects are not fully understood. Recent extensive genomic studies have implicated the protocadherin-related 15 (PCDH15) gene in the onset of psychiatric disorders, such as bipolar disorder (BD). To further investigate the pathogenesis of these psychiatric disorders, we developed a mouse model lacking Pcdh15. Notably, although PCDH15 is primarily identified as the causative gene of Usher syndrome, which presents with visual and auditory impairments, our mice with Pcdh15 homozygous deletion (Pcdh15-null) did not exhibit observable structural abnormalities in either the retina or the inner ear. The Pcdh15-null mice showed very high levels of spontaneous motor activity which was too disturbed to perform standard behavioral testing. However, the Pcdh15 heterozygous deletion mice (Pcdh15-het) exhibited enhanced spontaneous locomotor activity, reduced prepulse inhibition, and diminished cliff avoidance behavior. These observations agreed with the symptoms observed in patients with various psychiatric disorders and several mouse models of psychiatric diseases. Specifically, the hyperactivity may mirror the manic episodes in BD. To obtain a more physiological, long-term quantification of the hyperactive phenotype, we implanted nano tag® sensor chips in the animals, to enable the continuous monitoring of both activity and body temperature. During the light-off period, Pcdh15-null exhibited elevated activity and body temperature compared with wild-type (WT) mice. However, we observed a decreased body temperature during the light-on period. Comprehensive brain activity was visualized using c-Fos mapping, which was assessed during the activity and temperature peak and trough. There was a stark contrast between the distribution of c-Fos expression in Pcdh15-null and WT brains during both the light-on and light-off periods. These results provide valuable insights into the neural basis of the behavioral and thermal characteristics of Pcdh15-deletion mice. Therefore, Pcdh15-deletion mice can be a novel model for BD with mania and other psychiatric disorders, with a strong genetic component that satisfies both construct and surface validity.


Conflict of interest statement

The authors declare no competing interests

Figures

Fig. 1
Fig. 1. Generation of Pcdh15-deletion model mice by the CRISPR–Cas9 system.
a Schematic representation illustrating the strategy employed for deleting the mouse Pcdh15 gene using the CRISPR–Cas9 system. The CRISPR–Cas9 knock-in approach aimed to insert a FLAG tag and a stop codon into the Mus musculus Pcdh15 (NCBI: NM_001142746.1, 9150 bp mRNA) exon 5 (594-754). A specific EcoRI digestion site was introduced solely in the mutant allele to enable genotyping through polymerase chain reaction. b Immunoblotting analysis confirming the deletion of full-length PCDH15 in the brains of Pcdh15-deletion mice. Each lane contains 50 μg of whole-brain extracts from adult WT, Pcdh15-het, and Pcdh15-null. Signal detection and quantification were performed using the Odyssey system by LI-COR Biosciences (Lincoln, Nebraska, US). The calculated molecular weight of the PCDH15 CD3 isoform is approximately 183 kDa, denoted by the red signal. The green signal represents the internal control GAPDH. c Confocal microscope image showing the structure of the inner ear in Pcdh15-null immediately after birth. Myosin (green) and phalloidin (red) co-staining reveals the cochlear morphology. d Immunohistochemical staining of the retina from Pcdh15-null. Retinas from 4-week-old Pcdh15-null, Pcdh15-het, and WT were stained with peanut agglutinin (PNA; green) and Recoverin (red). Normal formation of the photoreceptor and bipolar cell layers is observed in all genotypes, compared with Pde6brd1/rd1 mice that display retinal degeneration [28]. Pcdh15 protocadherin related 15, Pcdh15-het Pcdh15 heterozygous deletion mice, Pcdh15-null Pcdh15 homozygous deletion mice, WT wild-type mice.
Fig. 2
Fig. 2. Behavioral analyses of Pcdh15-het.
a Locomotor activity test results depicting total activity during a 2-h measurement period (left), and activity recorded every 5 min (right). b Results of the prepulse inhibition (PPI) test. n = 15 for male WT mice, n = 15 for male Pcdh15-het in panels a and b. The data of locomotor activity test and PPI were analyzed using a two-way ANOVA. c Cliff avoidance test outcomes illustrating the percentage of cliff avoidance reaction (left) and the latency of falling from a cliff (right). n = 14 for male WT, n = 14 for male Pcdh15-het in panel 2c. Data are presented as the mean ± standard error of the mean (SEM). Student’s t-test was used for these analyses. ∗∗p < 0.01; ∗p < 0.05 indicate statistical significance. For additional information, please refer to Table 1.
Fig. 3
Fig. 3. Long-term activity and body temperature measurement with a miniature accelerometer: nano tag.
a, b The presented data spans the light–dark (L–D) cycle of a mouse model, where the nano tag was intraperitoneally implanted and visualized through the nano tag Viewer software. Data for the first 15 days are displayed. The horizontal axis represents the time from ZT15 (00:00) to ZT15 (00:00) of the following day. The vertical axis histograms indicate activity levels per 5 min, whereas the line graphs depict body temperature. a represents WT No. 1 and b represents Pcdh15-null No. 1. Data for the other WT and Pcdh15-null (No. 2, 3, and 4) are shown in Supplementary Figure 4. cf Three-dimensional surface plots created using MATLAB software (The MathWorks Inc., Natick, Massachusetts, USA) illustrate the activity and temperature fluctuations across time for the entire monitoring period. The color bars denote the intensity of each parameter: c activity in WT; d activity in Pcdh15-null; e body temperature in WT; and f body temperature in Pcdh15-null. g, h Mean ± SEM of 6-week data obtained from four WT and four Pcdh15-null; the data were measured throughout the L–D cycle and plotted against time. The vertical axis represents activity (g) or body temperature (h) in 10-min intervals, whereas the horizontal axis depicts time within a 24-h period. A statistical analysis of the activity levels or body temperature at each time point was conducted via multiple t-tests using the GraphPad Prism 8 software, indicating significant time intervals with P < 0.001. In terms of activity levels, Pcdh15-null mice exhibited increased activity compared with the controls at all time points from lights off until 30 min after the lights were turned back on. Regarding body temperature, significant differences were observed at all time points from 1 h 30 min after lights on to 1 h 30 min after lights off. ZT Zeitgeber time.
Fig. 4
Fig. 4. c-Fos mapping in the Pcdh15-null whole brain.
ad Results of automated analysis of c-Fos-positive cell distribution in mouse brains collected at ZT13 or ZT7. n = 3 for WT and n = 3 for Pcdh15-null. q value voxel maps comparing WT with Pcdh15-null (a) at ZT13 and (c) at ZT7. A-P: distance from bregma in mm. Bar plots illustrating the log2 fold-change in each brain region (b) at ZT13 and (d) at ZT7. Red voxels and bars indicate q < 0.05 and z > 0. Green voxels and bars indicate q < 0.05 and z < 0.

Similar articles

Cited by

References

    1. Andreassen OA, Hindley GFL, Frei O, Smeland OB. New insights from the last decade of research in psychiatric genetics: discoveries, challenges and clinical implications. World Psychiatry. 2023;22:4–24. doi: 10.1002/wps.21034. - DOI - PMC - PubMed
    1. Georgieva L, Rees E, Moran JL, Chambert KD, Milanova V, Craddock N, et al. De novo CNVs in bipolar affective disorder and schizophrenia. Hum Mol Genet. 2014;23:6677–83. doi: 10.1093/hmg/ddu379. - DOI - PMC - PubMed
    1. Noor A, Lionel AC, Cohen-Woods S, Moghimi N, Rucker J, Fennell A, et al. Copy number variant study of bipolar disorder in Canadian and UK populations implicates synaptic genes. Am J Med Genet B Neuropsychiatr Genet. 2014;165B:303–13. doi: 10.1002/ajmg.b.32232. - DOI - PubMed
    1. Kushima I, Nakatochi M, Aleksic B, Okada T, Kimura H, Kato H, et al. Cross-disorder analysis of genic and regulatory copy number variations in bipolar disorder, schizophrenia, and autism spectrum disorder. Biol Psychiatry. 2022;92:362–74. doi: 10.1016/j.biopsych.2022.04.003. - DOI - PubMed
    1. Sotomayor M, Weihofen WA, Gaudet R, Corey DP. Structure of a force-conveying cadherin bond essential for inner-ear mechanotransduction. Nature. 2012;492:128–32. doi: 10.1038/nature11590. - DOI - PMC - PubMed