. 2024 May 28;9(1):93.
doi: 10.1038/s41541-024-00886-0.

SARS-CoV-2-specific immune responses converge in kidney disease patients and controls with hybrid immunity

Collaborators, Affiliations

SARS-CoV-2-specific immune responses converge in kidney disease patients and controls with hybrid immunity

Muriel Aguilar-Bretones et al. NPJ Vaccines. .

Abstract

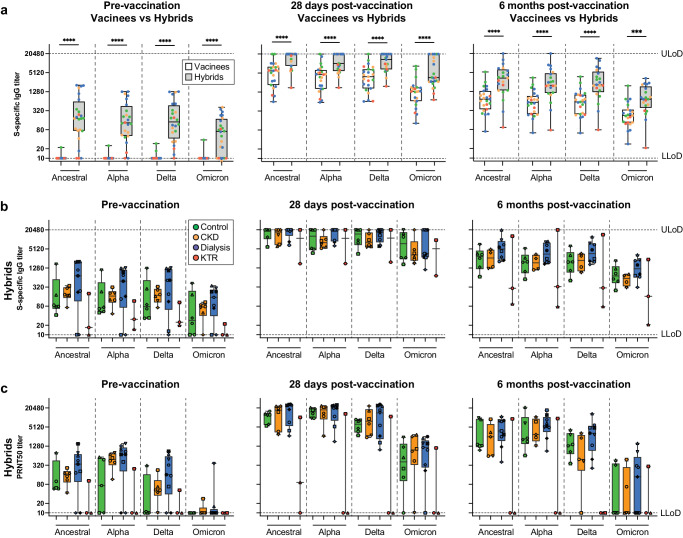
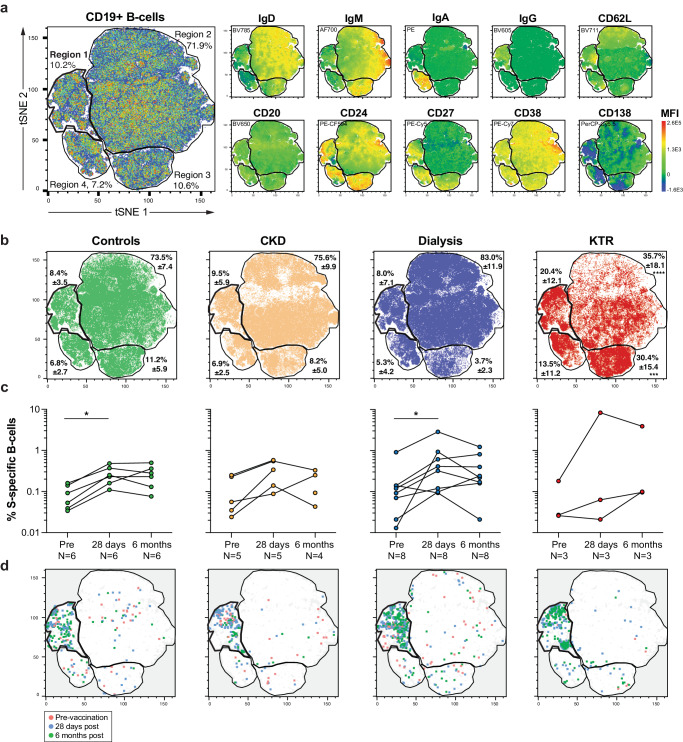
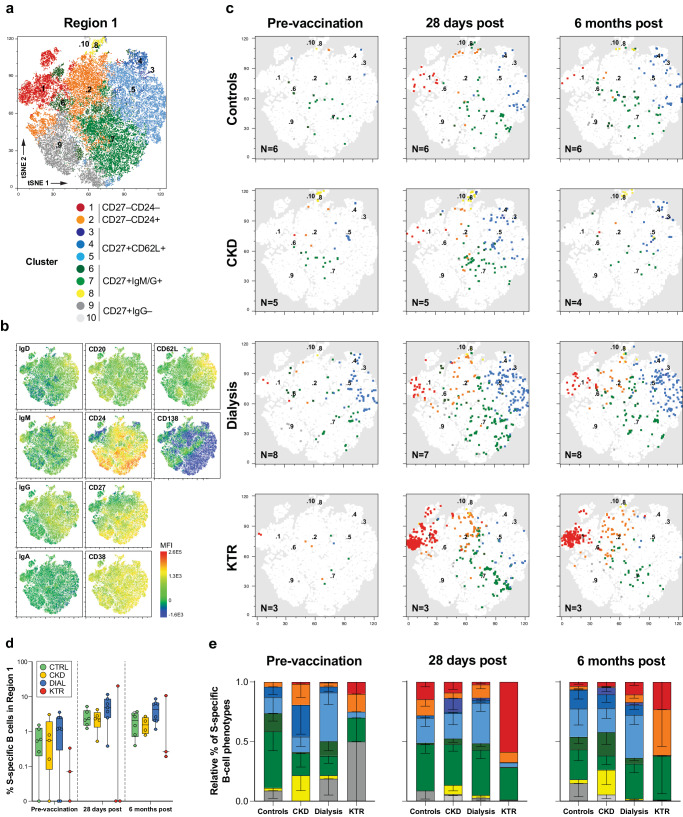
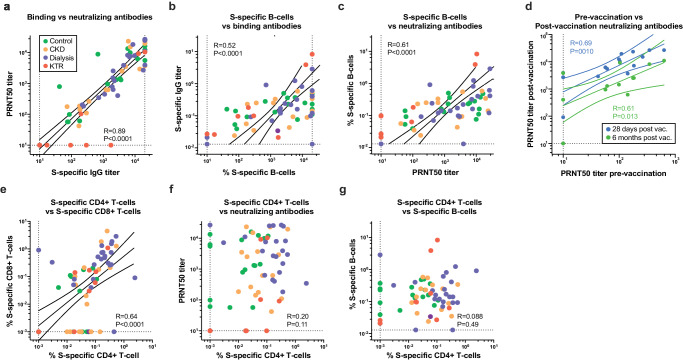
Healthy individuals with hybrid immunity, due to a SARS-CoV-2 infection prior to first vaccination, have stronger immune responses compared to those who were exclusively vaccinated. However, little is known about the characteristics of antibody, B- and T-cell responses in kidney disease patients with hybrid immunity. Here, we explored differences between kidney disease patients and controls with hybrid immunity after asymptomatic or mild coronavirus disease-2019 (COVID-19). We studied the kinetics, magnitude, breadth and phenotype of SARS-CoV-2-specific immune responses against primary mRNA-1273 vaccination in patients with chronic kidney disease or on dialysis, kidney transplant recipients, and controls with hybrid immunity. Although vaccination alone is less immunogenic in kidney disease patients, mRNA-1273 induced a robust immune response in patients with prior SARS-CoV-2 infection. In contrast, kidney disease patients with hybrid immunity develop SARS-CoV-2 antibody, B- and T-cell responses that are equally strong or stronger than controls. Phenotypic analysis showed that Spike (S)-specific B-cells varied between groups in lymph node-homing and memory phenotypes, yet S-specific T-cell responses were phenotypically consistent across groups. The heterogeneity amongst immune responses in hybrid immune kidney patients warrants further studies in larger cohorts to unravel markers of long-term protection that can be used for the design of targeted vaccine regimens.


Conflict of interest statement

The authors declare no competing interests.

Figures

Fig. 1
Fig. 1. Hybrid immunity induces higher serum SARS-CoV-2 binding and neutralizing antibody titers then vaccination alone.
a Longitudinal serum spike (S)-specific IgG titers of SARS-CoV-2 variants in vaccinees without (white box), and with prior COVID-19 (hybrids, grey box) sampled before, and 28 days and 6 months after vaccination. Groups are color-coded similar to panels b and c. b S-specific IgG titers to SARS-CoV-2 variants in hybrid immune controls (green), chronic kidney disease patients (CKD, yellow), patients on dialysis (blue) and kidney transplant recipients (KTR, red). The 50% effective concentration serum S-specific IgG titers were determined by ELISA. c) The serum antibody titers of a 50% plaque reduction neutralization test (PRNT50) using clinical virus isolates of each variant. Symbols, central line, box and whiskers represent individual patients, the mean, interquartile range and minimum or maximum values, respectively. Horizontal dotted lines indicate the upper (ULoD) and lower limits of detection (LLoD). Significant differences calculated by Mann–Whitney-U test are indicated (***p < 0.005 and ****p < 0.001).
Fig. 2
Fig. 2. Kinetics and phenotypic analysis of S-specific B-cells in kidney disease patients and controls.
a A pseudo-colored B-cell density plot (from red to blue, highest to the lowest density of events) of multicolor flow cytometry data after dimensionality reduction by t-distributed stochastic neighbor embedding (t-SNE) from concatenated, normalized, live, single CD19+ events from all individuals and timepoints (left panel) based on the expression of the 10 indicated markers as determined by the mean fluorescent intensity (MFI, right panels). Four dominant regions (Region 1-4) are outlined. b Mean and standard deviation of the frequency of events over the 4 regions per study group. Significant differences determined using two-way ANOVA and Tukey’s multiple comparison test are indicated (***p < 0.005 and ****p < 0.0001). c Longitudinal frequencies of live single S-specific CD19+ B-cells identified by classical gating in controls, CKD, dialysis and KTR pre-, 28 days and 6 months post-vaccination. Significant differences determined by Wilcoxon test for paired data are indicated (*p < 0.05). d) S-specific B-cells were overlayed on the t-SNE plot and depicted separately per study group and color-coded timepoint (red, blue and green).
Fig. 3
Fig. 3. S-specific B-cells in hybrid kidney disease patients and controls display subtle phenotypical variations.
a t-SNE-based dimensional reduction plots of concatenated B-cells in region 1 (Fig. 2a). Clusters identified by unsupervised cluster analysis using FlowSOM are numbered in the center of each cluster and color coded according to their phenotypic resemblance; CD27+ B-cells with low Ig expression (cluster 9,10; greys), class-switched CD27+ memory populations (cluster 6-8; yellow/greens), CD62L+ lymph node homing (cluster 3–5; blues) and CD27– extrafolicular memory populations (cluster 1,2; orange and red). b S-specific B-cells of hybrid controls, CKD and dialysis patients, and KTR overlayed on the t-SNE plot, color coded per cluster. c) Distribution of isotype, memory and lymph node homing marker expression shown as the mean fluorescent intensity (MFI) on the t-SNE map. d Frequency of S-specific B-cells within region 1. The central line, box, and whiskers represent the mean, interquartile range, and minimum or maximum values, respectively. e Relative mean frequencies (boxes) and standard error of mean (whiskers) of S-specific B-cell phenotypes in region 1, color-coded similar to panel a. Samples without S-specific B-cells in region 1 were omitted from this analysis.
Fig. 4
Fig. 4. S-specific T-cells are phenotypically diverse but similar between groups and over time.
a t-SNE-based dimensional reduction plot of concatenated T-cells, clustered based on the relative expression of phenotypic, memory, activation, inhibition and senescence markers, color coded per cluster. b Heatmap of relative marker expression per cluster. c) Populations of naive and memory CD4+ and CD8+ T-cells, and γδT-cells are outlined based on differential expression of CD4, CD8, TCRγδ, CD45RA and CCR7 shown by the mean fluorescent intensity (MFI). d Distribution of concatenated T-cells per patient group. e S-specific CD4+ , CD8+ T-cells and γδT-cells are overlayed and color coded per patient group or f per time point. g The frequency of memory CD4+ and h) CD8+ T-cells. The symbols, central line, box and whiskers represent individual patients, mean, interquartile range and minumum and maximum values, respectively. Significant differences calculated by Mann-Whitney-U test are indicated (*p < 0.05 and ***p < 0.005).
Fig. 5
Fig. 5. B- and T-cell responses correlated within their own compartment, but do not correlate with each other.
a–g Linear regression was performed on 10log-transformed data from all available patients and timepoints. Spearman rank correlation was used to calculate R and significance. For binding IgG titers and PRNT50, data of the ancestral lineage is shown. Only for significant correlations, regression, and 95% confidence intervals are plotted. Horizontal and vertical dotted lines depict the LLoD and ULoD.

References

    1. Boyarsky BJ, et al. Early national and center-level changes to kidney transplantation in the United States during the COVID-19 epidemic. Am. J. Transpl. 2020;20:3131–3139. doi: 10.1111/ajt.16167. - DOI - PMC - PubMed
    1. Ravanan R, et al. SARS-CoV-2 infection and early mortality of waitlisted and solid organ transplant recipients in England: A national cohort study. Am. J. Transplant. 2020;20:3008–3018. doi: 10.1111/ajt.16247. - DOI - PMC - PubMed
    1. Sanders JSF, et al. The RECOVAC Immune-response Study: The Immunogenicity, Tolerability, and Safety of COVID-19 Vaccination in Patients With Chronic Kidney Disease, on Dialysis, or Living With a Kidney Transplant. Transplantation. 2022;106:821–834. doi: 10.1097/TP.0000000000003983. - DOI - PMC - PubMed
    1. Caillard S, Thaunat O. COVID-19 vaccination in kidney transplant recipients. Nat. Rev. Nephrol. 2021;17:785–787. doi: 10.1038/s41581-021-00491-7. - DOI - PMC - PubMed
    1. Grupper A, et al. Humoral Response to the Pfizer BNT162b2 Vaccine in Patients Undergoing Maintenance Hemodialysis. Clin. J. Am. Soc. Nephrol. 2021;16:1037–1042. doi: 10.2215/CJN.03500321. - DOI - PMC - PubMed