

Density-mediated foraging behavioral responses of Rhyzopertha dominica (Coleoptera: Bostrichidae) and Tribolium castaneum (Coleoptera: Tenebrionidae)
- PMID: 38806558
- PMCID: PMC11133452
- DOI: 10.1038/s41598-024-62277-8
Density-mediated foraging behavioral responses of Rhyzopertha dominica (Coleoptera: Bostrichidae) and Tribolium castaneum (Coleoptera: Tenebrionidae)
Abstract
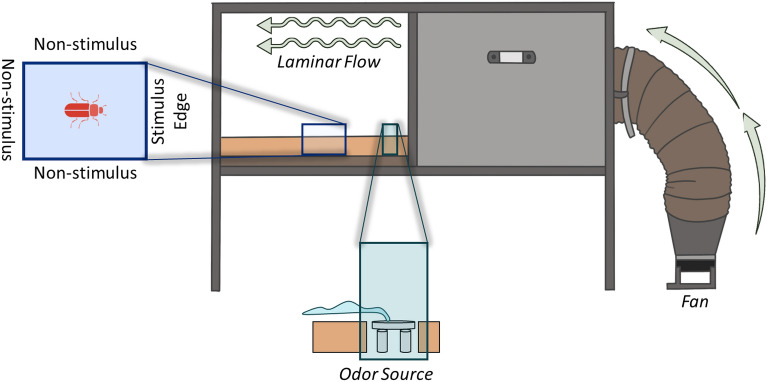
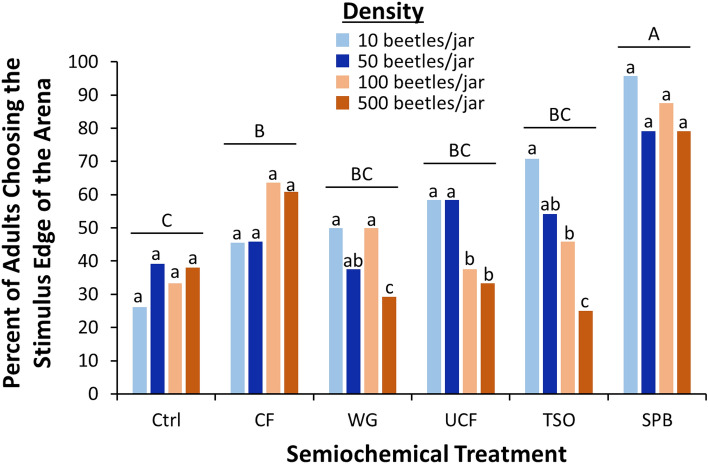
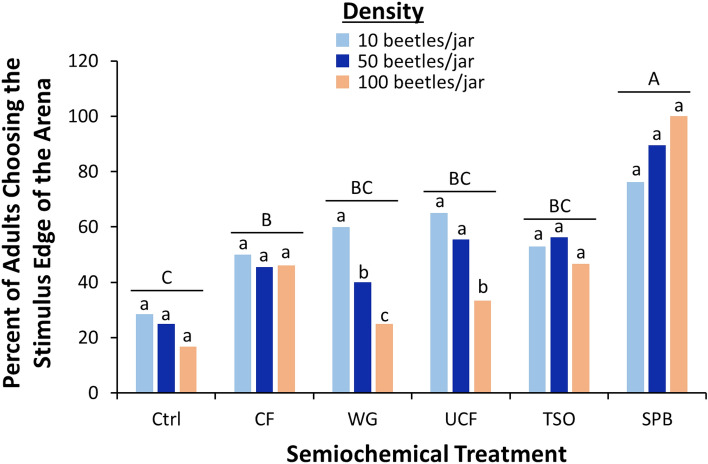
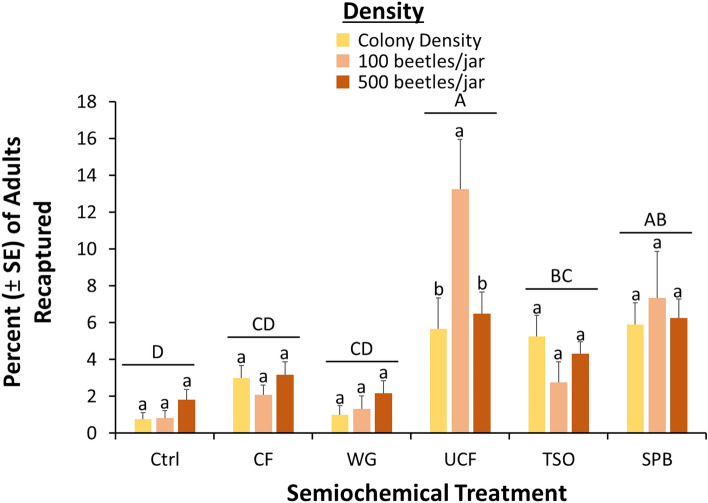
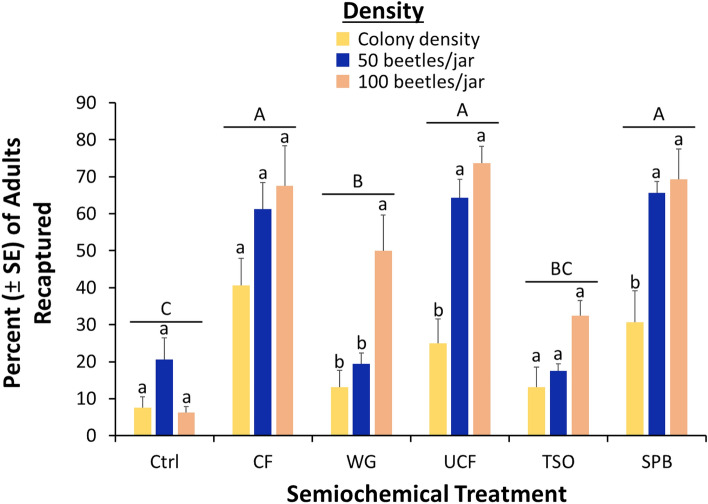
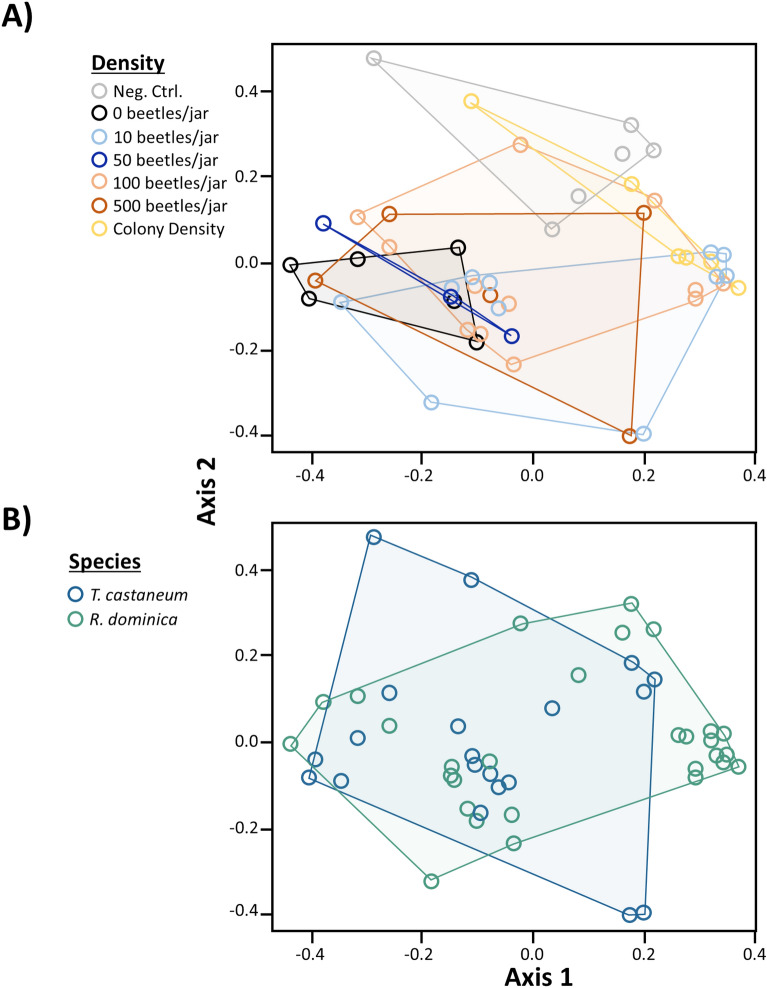
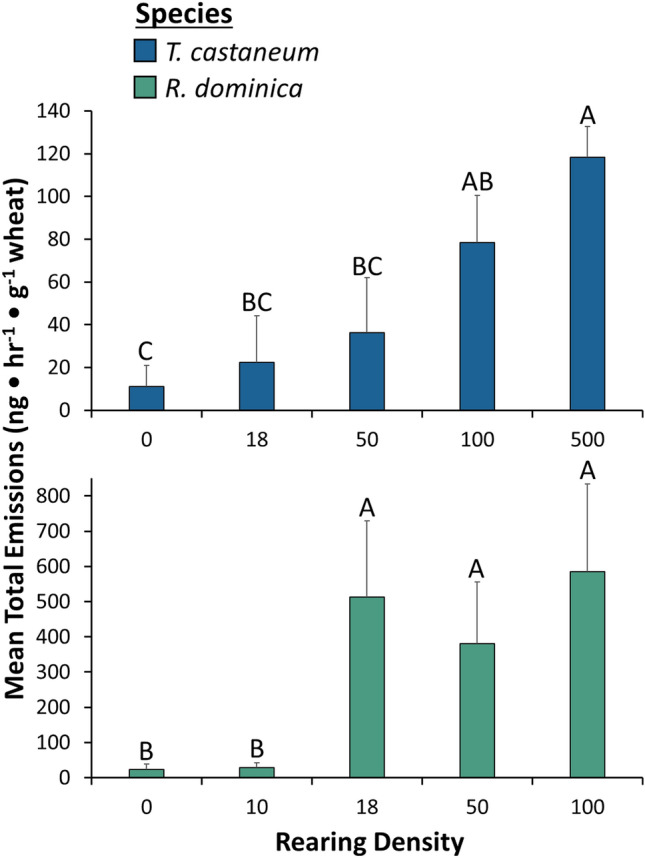
Tribolium castaneum and Rhyzopertha dominica are cosmopolitan, destructive postharvest pests. Although research has investigated how high densities of T. castaneum affect attraction to the aggregation pheromone by conspecifics, research into the behavioral response of both species to food cues after high density exposure has been lacking despite its importance to foraging ecology. Our goal was to manipulate and observe the effects of crowding on the behavioral response of both species to common food and pheromonal stimuli and to determine how the headspace emission patterns from grain differed under increasing densities. Densities of colonies for both species was altered (10-500 adults) on a fixed quantity of food (10 g of flour or whole wheat), then the behavioral response to common food and pheromonal cues was evaluated in a wind tunnel and release-recapture experiment, while volatiles were examined through gas chromatography coupled with mass spectrometry. Importantly, at least for T. castaneum, crowded conditions attenuate attraction to food-based stimuli, but not pheromonal stimuli. Crowding seemed to have no effect on R. dominica attraction to food and pheromonal stimuli in the wind tunnel, but exposure to high density cues did elicit 2.1-3.8-fold higher captures in traps. The relative composition and abundance of headspace volatiles emitted varied significantly with different densities of beetles and was also species-specific. Overall, our results have implications for expanding our understanding of the foraging ecology of two economically important pests.
Keywords: Integrated pest management; Lesser grain borer; Red flour beetle; Semiochemicals; Stored products; Taxis.
© 2024. This is a U.S. Government work and not under copyright protection in the US; foreign copyright protection may apply.
Conflict of interest statement
The authors declare no competing interests.
Figures
Similar articles
-
Walking Responses of Tribolium castaneum (Coleoptera: Tenebrionidae) to Its Aggregation Pheromone and Odors of Wheat Infestations.J Econ Entomol. 2017 Jun 1;110(3):1351-1358. doi: 10.1093/jee/tox051. J Econ Entomol. 2017. PMID: 28334232
-
The behavioral response to the putative necromones from dead Tribolium castaneum (Coleoptera: Tenebrionidae) in traps by conspecifics as a function of density and time since capture.Environ Entomol. 2023 Dec 15;52(6):1020-1032. doi: 10.1093/ee/nvad098. Environ Entomol. 2023. PMID: 37757446
-
Microbial Volatile Organic Compounds from Tempered and Incubated Grain Mediate Attraction by a Primary but Not Secondary Stored Product Insect Pest in Wheat.J Chem Ecol. 2022 Jan;48(1):27-40. doi: 10.1007/s10886-021-01312-8. Epub 2021 Sep 20. J Chem Ecol. 2022. PMID: 34542783 Free PMC article.
-
Mobility of Phosphine-Susceptible and -Resistant Rhyzopertha dominica (Coleoptera: Bostrichidae) and Tribolium castaneum (Coleoptera: Tenebrionidae) After Exposure to Controlled Release Materials With Existing and Novel Active Ingredients.J Econ Entomol. 2022 Jun 8;115(3):888-903. doi: 10.1093/jee/toac033. J Econ Entomol. 2022. PMID: 35429272
-
Semiochemistry of the Scarabaeoidea.J Chem Ecol. 2014 Feb;40(2):190-210. doi: 10.1007/s10886-014-0377-5. Epub 2014 Jan 29. J Chem Ecol. 2014. PMID: 24474404 Review.
Cited by
-
Challenges in Assessing Repellency via the Behavioral Response by the Global Pest Tribolium castaneum to Protect Stored Grains.Insects. 2024 Aug 20;15(8):626. doi: 10.3390/insects15080626. Insects. 2024. PMID: 39194830 Free PMC article.
-
Synthesis of the aggregation pheromone of Tribolium castaneum.Beilstein J Org Chem. 2025 Mar 6;21:510-514. doi: 10.3762/bjoc.21.38. eCollection 2025. Beilstein J Org Chem. 2025. PMID: 40079019 Free PMC article.
References
-
- Getz WM. A hypothesis regarding the abruptness of density dependence and the growth rate of populations. Ecology. 1996;77:2014–2026. doi: 10.2307/2265697. - DOI
-
- Lauer MJ, James AS, Krupa J. Male density, female density and inter-sexual conflict in a stream-dwelling insect. Anim. Behav. 1996;52:929–939. doi: 10.1006/anbe.1996.0241. - DOI
-
- Gunton RM, Pöyry J. Scale-specific spatial density dependence in parasitoids: A multi-factor meta-analysis. Funct. Ecol. 2016;30:1501–1510. doi: 10.1111/1365-2435.12627. - DOI
-
- Thierry M, Hrček J, Lewis OT. Mechanisms structuring host–parasitoid networks in a global warming context: A review. Ecol. Entomol. 2019;44:581–592. doi: 10.1111/een.12750. - DOI
MeSH terms
Substances
Supplementary concepts
Grants and funding
LinkOut - more resources
Full Text Sources
