. 2024 May 28;14(1):12270.
doi: 10.1038/s41598-024-62913-3.

Integration of single-cell sequencing and bulk RNA-seq to identify and develop a prognostic signature related to colorectal cancer stem cells

Affiliations

Integration of single-cell sequencing and bulk RNA-seq to identify and develop a prognostic signature related to colorectal cancer stem cells

Jiale Wu et al. Sci Rep. .

Abstract

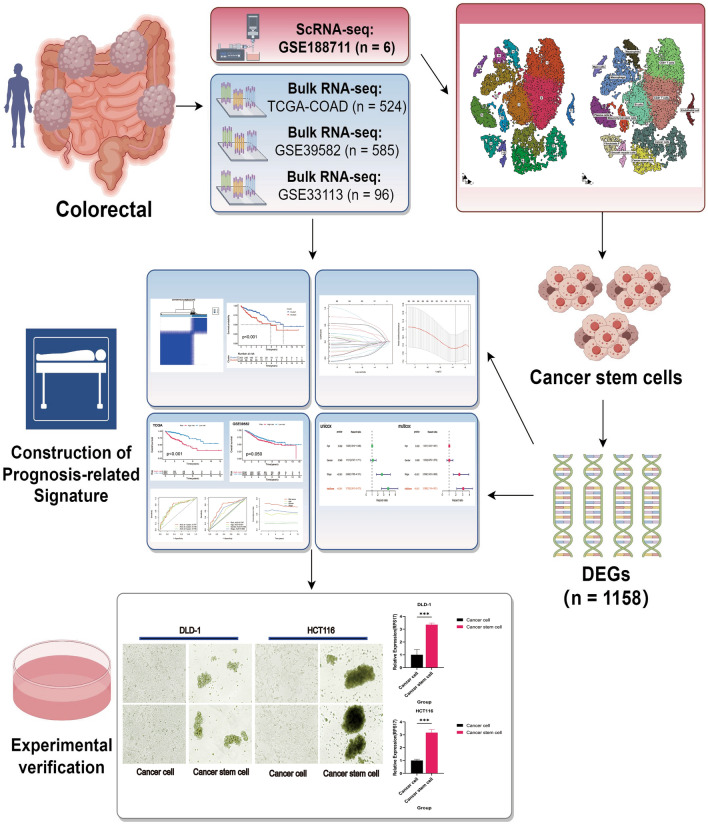
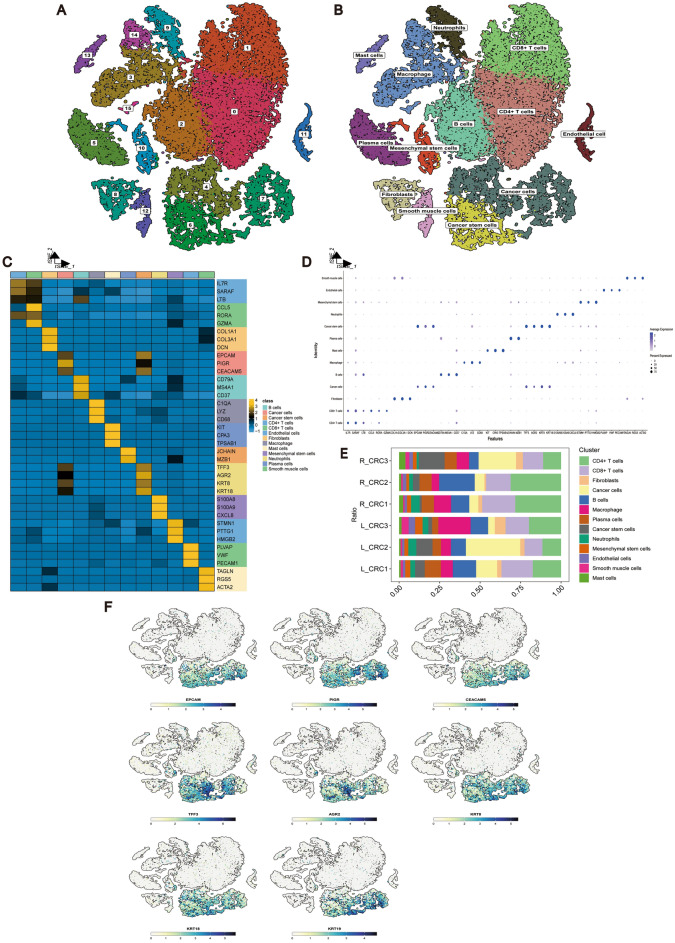
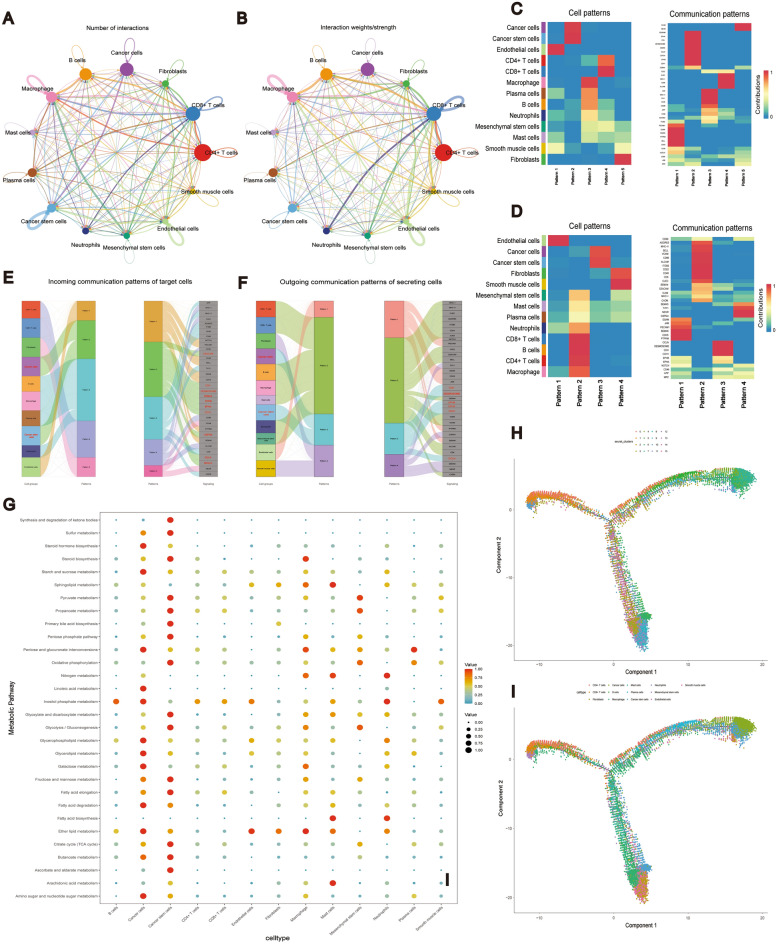
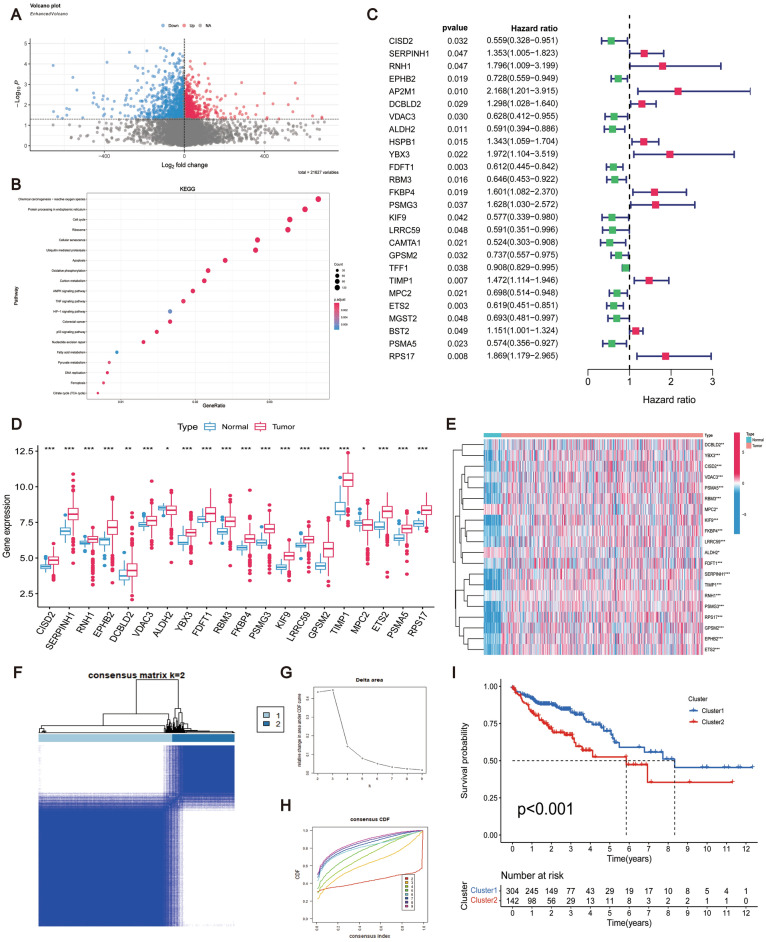
The prognosis for patients with colorectal cancer (CRC) remains worse than expected due to metastasis, recurrence, and resistance to chemotherapy. Colorectal cancer stem cells (CRCSCs) play a vital role in tumor metastasis, recurrence, and chemotherapy resistance. However, there are currently no prognostic markers based on CRCSCs-related genes available for clinical use. In this study, single-cell transcriptome sequencing was employed to distinguish cancer stem cells (CSCs) in the CRC microenvironment and analyze their properties at the single-cell level. Subsequently, data from TCGA and GEO databases were utilized to develop a prognostic risk model for CRCSCs-related genes and validate its diagnostic performance. Additionally, functional enrichment, immune response, and chemotherapeutic drug sensitivity of the relevant genes in the risk model were investigated. Lastly, the key gene RPS17 in the risk model was identified as a potential prognostic marker and therapeutic target for further comprehensive studies. Our findings provide new insights into the prognostic treatment of CRC and offer novel perspectives for a systematic and comprehensive understanding of CRC development.

Keywords: Colorectal cancer; Colorectal cancer stem cell; Prognostic signature; RPS17; Single-cell transcriptome sequencing.


Conflict of interest statement

The authors declare no competing interests.

Figures

Figure 1
Figure 1
Flowchart material for this study was drawn by Figdraw.
Figure 2
Figure 2
scRNA-seq to identify cell types of CRC samples. (A) scRNA-seq data yielded t-SNE plot for 15 Clusters. (B) scRNA-seq data yielded t-SNE plot for 13 cell types. (C) Heatmap showing markers for 13 cell types. (D) Scatterplot showing markers for 13 cell types. (E) Distribution of 13 cell types in different samples of scRNA-seq data. (F) Cancer cells and CSCs marker gene t-SNE plot. 13 cell types of distribution plot.
Figure 3
Figure 3
Analysis of cellular communication, metabolism, and differentiation. (A) Circle diagram of the number of interactions of the 13 cell types. (B) Circle diagram of the specific gravity of interactions of the 13 cell types. (C) Heat map of the incoming pattern of signaling between the 13 cell types. (D) Heat map of the outgoing pattern of signaling between the 13 cell types. (E) Flow diagram of the incoming pattern of signaling between the 13 cell types; (F) conduction efferent pattern river diagram. (G) We scored the enrichment of KEGG metabolic pathways for 13 cell types and selected the top 30 metabolically relevant pathways for scatter plot presentation. (H) Mock time series analysis to explore the differentiation changes of 15 Clusters. (I) Mock time series analysis to explore the differentiation changes of 13 cell types, with Cancer stem cells as the starting point.
Figure 4
Figure 4
CRCSCs differential gene screening and survival significance study. (A) 1158 colorectal CSCs differential genes from scRNA-seq data for volcano plot visualization. (B) Scatterplot of GO functional analysis of differential genes. (C) Forest plot demonstrating the screening of 26 prognostically relevant genes after univariate COX regression scores (P < 0.05). Among the 26 genes associated with prognosis, 20 genes that were differentially expressed in CRC were extracted and shown as (D) box plots and (E) heat maps, respectively. (P < 0.05). (F) Prognosis-related consensus clustering matrix at K = 2. (G) Relative changes in the area under the CDF curves at K = 2–9. (H) Empirical CDF plots at K = 2–9. (I) Survival difference analysis between Cluster1 and Cluster2 (P < 0.05).
Figure 5
Figure 5
Construction of CRCSCs-related prognostic risk model. (A) Lasso regression screening of CRCSCs-related genes at the nadir of cross-validation. (B) Lasso regression trajectory of each independent variable. (C,D) Prognostic risk model scores differentiate the analysis of survival differences between high-risk and low-risk groups, with TCGA as the Training group and GSE39582 as the Testing group, the overall survival of patients in the high-risk group was significantly lower than that in the low-risk group (P < 0.05). (E) The progression-free survival analysis of the prognostic risk model was also significantly different. (F,G) and (H) show the risk heatmap, the risk score plot, and the scatterplot of the risk distribution for the Training group, respectively. While (I), (J), and (K) show the risk heatmap, risk score curve plot, and risk distribution scatter plot for the Testing group. (L) Shows the survival difference analysis between the high-risk group and the low-risk group within the clinical stage I–II (P < 0.05). (M) Shows the survival difference analysis between the high-risk group and the low-risk group within the clinical stage III-IV (P < 0.05).
Figure 6
Figure 6
Validation of the prognostic performance of the prognostic risk model. (A) Principal component analysis demonstrating the ability of the risk model scores to discriminate between samples in the Training group. (B) Principal component analysis demonstrating the ability of the risk model scores to discriminate between samples in the Testing group. (C) The TCGA dataset yields ROC curves validating the predictive performance of the risk model over the 1-year, 3-year, and 5-year periods, with AUCs of 0.747, 0.738, and 0.738, respectively. (D) ROC curves incorporating traditional clinical factors in the TCGA group validated the predictive performance of the risk model, with risk scores: 0.747; age: 0.646; gender: 0.468; stage: 0.623; T: 0.555; M: 0.593; N: 0.588. (E) The GEO dataset yields ROC curves validating the predictive performance of the risk model over the 1-year, 3-year, and 5-year periods, with AUCs of 0.616, 0.568 and 0.562, respectively, respectively. (F) ROC curves incorporating traditional clinical factors in the GEO group validated the predictive performance of the risk model, with Risk Score: 0.617; Age: 0.612; Gender: 0.525; Stage: 0.640; T: 0.467; M: 0.486; N: 0.457. (G) Nomogram plot to validate that the risk model scores with good prognostic performance. (H) Standard curve showing that 1-, 3-year performance would be more accurate than 5-year. (I) Successively combined traditional clinical factors in univariate Cox regression (HR = 3.442 (2.224–5.376)) and (J) multifactorial Cox regression analyses (HR = 3.024 (2.119–4.823)), P < 0.001.
Figure 7
Figure 7
Functional analysis of the prognostic risk model. (A) Results of GO functional enrichment analysis showed (P < 0.05, R = 1) that the biological processes of the risk model are active in the Wnt pathway, the cellular fractions are enriched in collagen-containing extracellular matrix, and the molecular functions are active in signaling receptor activator activities. (B) Showing the corresponding circle diagrams. (C) and (D) show the Hallmark enrichment analysis of the patients of high-risk group and the patients of low-risk group, respectively. As a result, high-risk patients were mainly enriched for EMT process, and low-risk patients were negatively correlated with E2F activity.
Figure 8
Figure 8
Immunological correlation analysis of prognostic risk models. (A) TIDE scores between high-risk and low-risk groups, TIDE scores of patients in high-risk group were significantly lower than those of patients in low-risk group. (B) Immunological correlation responses predicting prognostic risk models were enriched for the presence of T cells CD4 memory resting, NK cells activated, Cytolytic activity, and HLA. (C) Immune infiltration of the prognostic risk model with significant differences in T cells CD4 memory resting, NK cells activated, Macrophages M2, and Neutrophils, and (D) Immunological infiltration of the 16 CRCSCs-related genes comprising the prognostic risk model on immune infiltration correlation.
Figure 9
Figure 9
Chemotherapeutic drug sensitivity analysis. (AF) There was a significant difference in the sensitivity of the high-risk and low-risk groups, as differentiated by the prognostic risk model scores, to cisplatin, Esketamine, (5Z)-7-Oxozeaenol, AC220 (Quizartinib), Genentech Cpd 10, and XAV939 with cisplatin, (5Z)-7-Oxozeaenol, Esketamine, and XAV939 were more sensitive in patients in the high-risk group.
Figure 10
Figure 10
Validation of CRCSC-related genes by qRT-PCR. (A) Scatterplot identifies mtry = 4 as the optimal parameter for constructing the Random Forest model. (B) Random forest analysis highlights RPS17, TIMP1, ALDH2, FDFT1, PSMG3 and PSMA5 as key genes with stable contribution scores and significant model importance. (C,D) Morphological evidence of CSC enrichment in DLD-1 and HCT116 cells following a 7-day enrichment protocol. (E,F) qRT-PCR validation of increased ALDH1A1 expression in enriched CRCSCs (P < 0.05). (G,H) qRT-PCR validation of elevated NOTCH expression in enriched CRCSCs (P < 0.05).
Figure 11
Figure 11
Experimental and mechanistic prediction of RPS17 expression in CRC. (A) qRT-PCR confirmed the high expression of RPS17 in CRC cell lines compared to normal colorectal epithelial cells, NCM460 for normal colorectal epithelial cells, and DLD-1, HCT116, HCT15, HT-29 and SW620 for CRC group cell lines, P < 0.05. (B) Western blot immunoblotting showed significantly elevated protein levels of RPS17 in CRC cells. (C) Western blot immunoblot statistical analysis plots with one-way ANOVA. (D) Differential analysis demonstrating that RPS17 is highly expressed in CRC. (E) Pairwise differential expression demonstrating that RPS17 is highly expressed in CRC. (F) Survival differential analysis demonstrating that the overall survival rate of patients with high expression of RPS17 is significantly lower than that of patients with low expression. (G) GO results show that RPS17 is enriched in DNA packaging during biological processes, and that cellular components are enriched in collagen-containing extracellular matrix and are active in the molecular function of protein heterodimerization activity, corresponding to the circle diagrams demonstrated in the (G). (H) Violin diagrams demonstrates that high expression of RPS17 leads to a decrease in both TME scores (including Stromal Score, Immune Score, ESTIMATE Score).

Similar articles

Cited by

References

    1. Sung H, et al. Global Cancer Statistics 2020: GLOBOCAN estimates of incidence and mortality worldwide for 36 cancers in 185 countries. CA Cancer J. Clin. 2021;71:209–249. doi: 10.3322/caac.21660. - DOI - PubMed
    1. Siegel RL, Wagle NS, Cercek A, Smith RA, Jemal A. Colorectal cancer statistics, 2023. CA Cancer J. Clin. 2023;73:233–254. doi: 10.3322/caac.21772. - DOI - PubMed
    1. Stoffel EM, Murphy CC. Epidemiology and mechanisms of the increasing incidence of colon and rectal cancers in young adults. Gastroenterology. 2020;158:341–353. doi: 10.1053/j.gastro.2019.07.055. - DOI - PMC - PubMed
    1. Ciardiello F, et al. Clinical management of metastatic colorectal cancer in the era of precision medicine. CA Cancer J. Clin. 2022;72:372–401. doi: 10.3322/caac.21728. - DOI - PubMed
    1. Patel SG, Karlitz JJ, Yen T, Lieu CH, Boland CR. The rising tide of early-onset colorectal cancer: A comprehensive review of epidemiology, clinical features, biology, risk factors, prevention, and early detection. Lancet Gastroenterol. Hepatol. 2022;7:262–274. doi: 10.1016/S2468-1253(21)00426-X. - DOI - PubMed

MeSH terms

Substances