. 2024 Jun;9(6):1540-1554.
doi: 10.1038/s41564-024-01699-6. Epub 2024 May 28.

Multiple sclerosis patient-derived spontaneous B cells have distinct EBV and host gene expression profiles in active disease

Affiliations

Multiple sclerosis patient-derived spontaneous B cells have distinct EBV and host gene expression profiles in active disease

Samantha S Soldan et al. Nat Microbiol. 2024 Jun.

Abstract

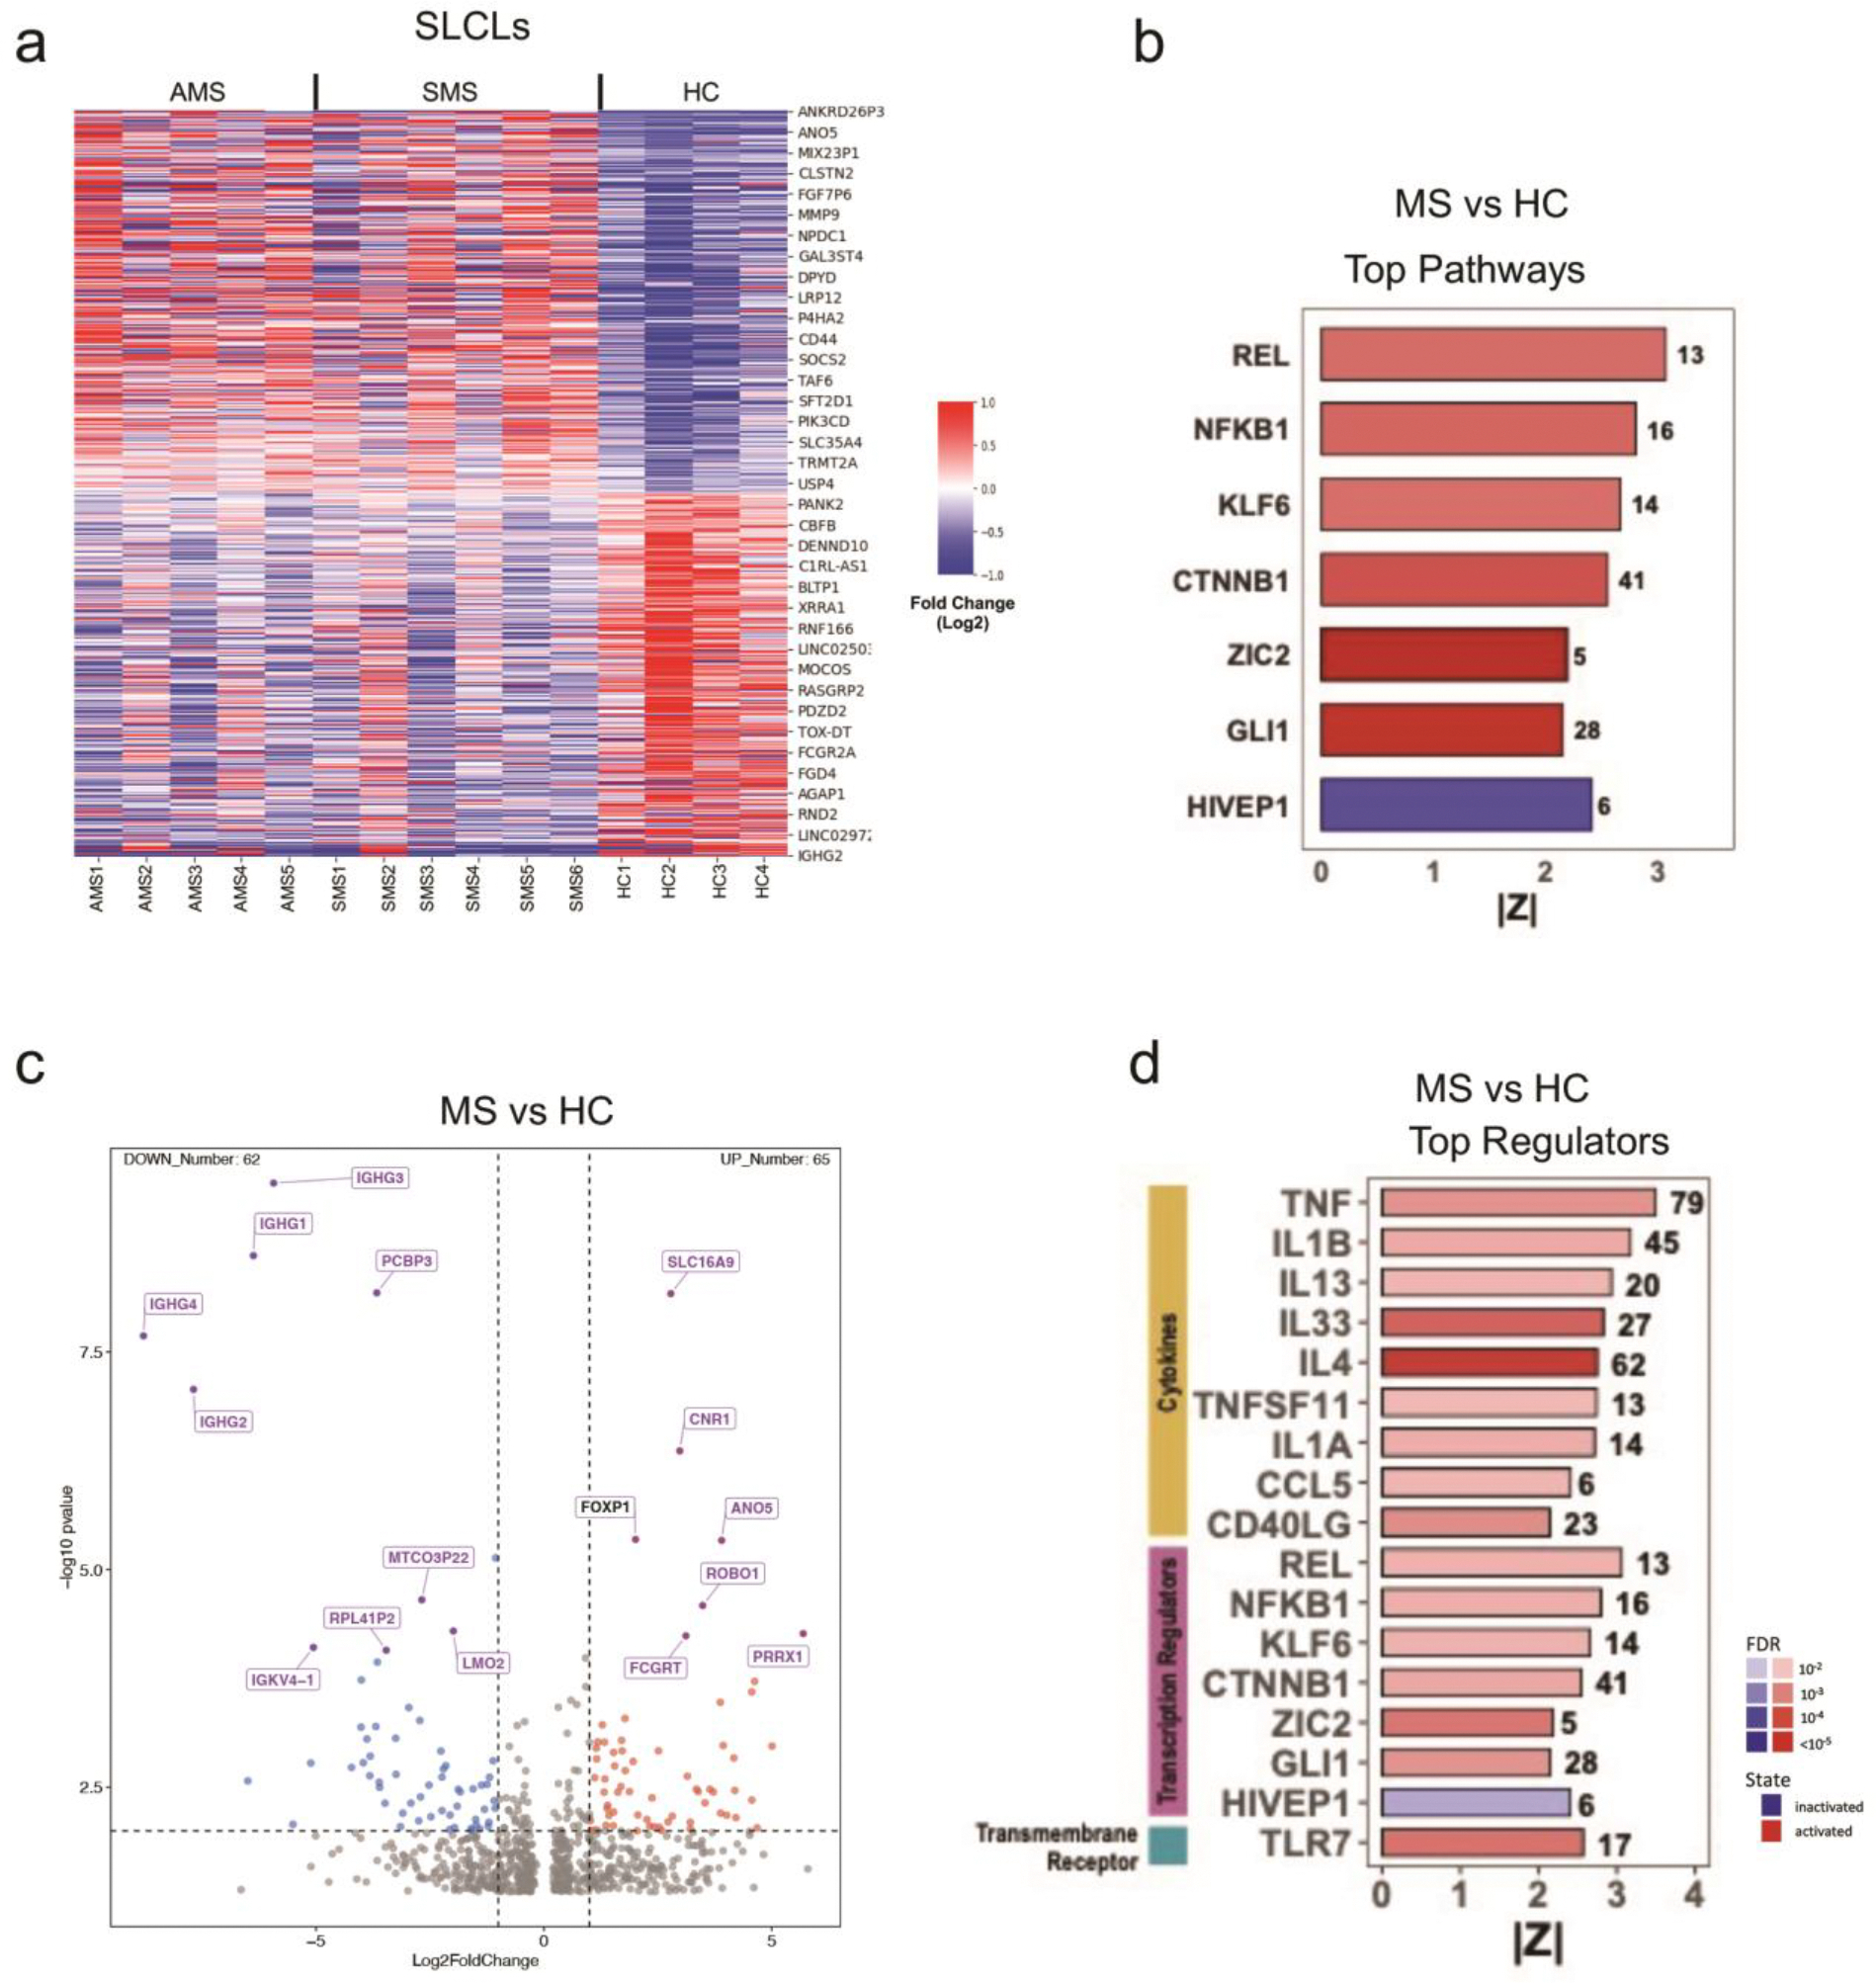
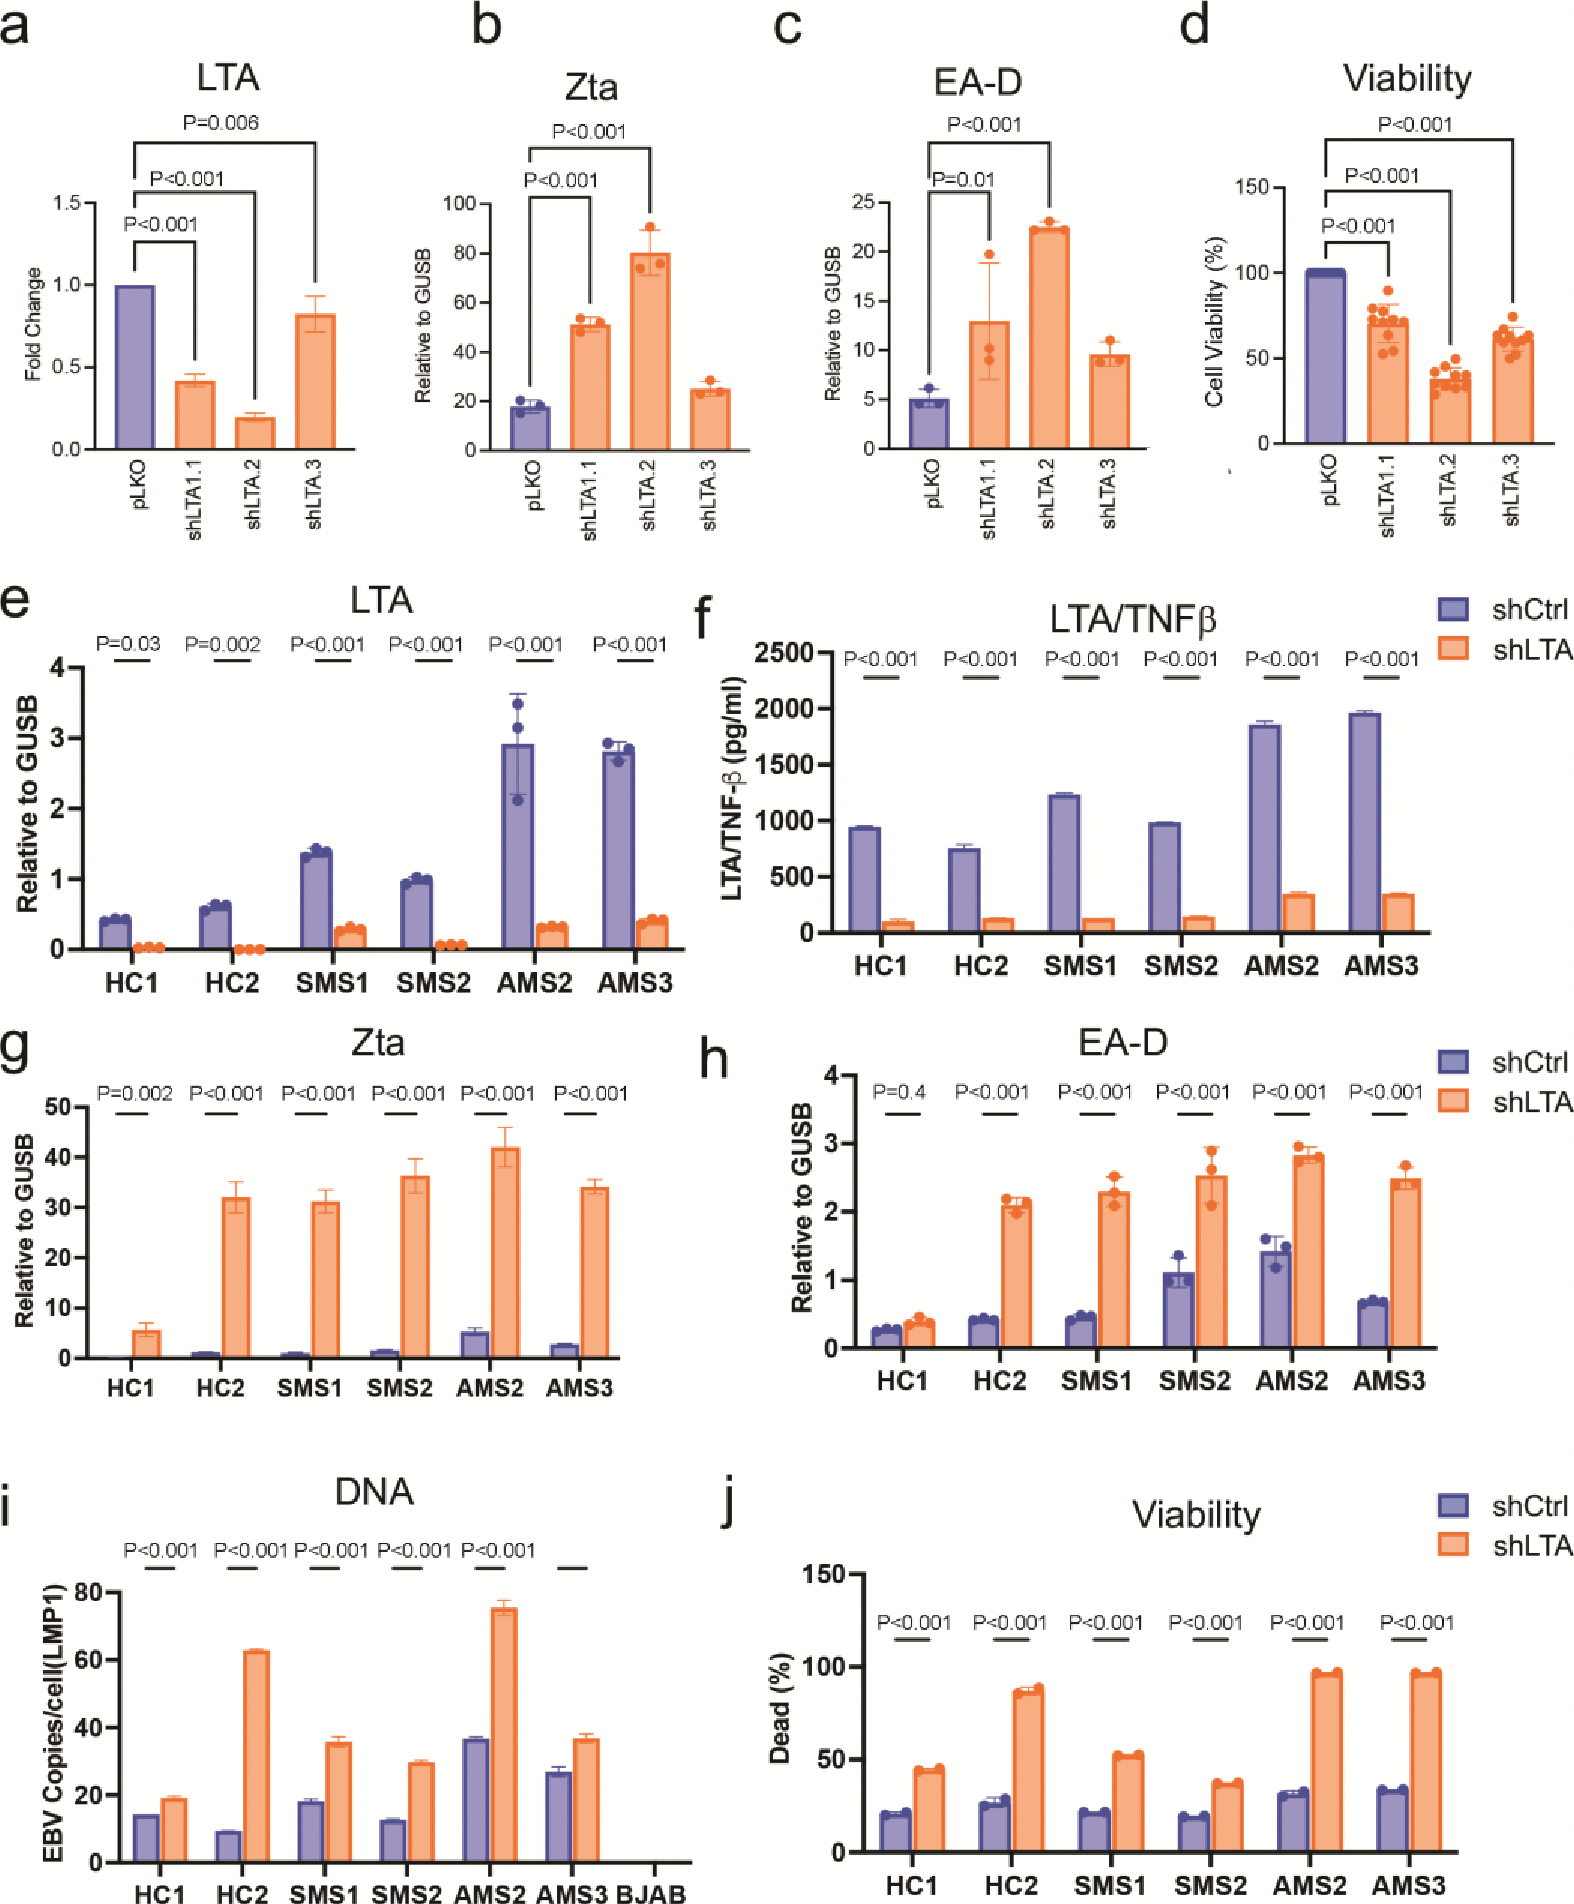
Epstein-Barr virus (EBV) is an aetiologic risk factor for the development of multiple sclerosis (MS). However, the role of EBV-infected B cells in the immunopathology of MS is not well understood. Here we characterized spontaneous lymphoblastoid cell lines (SLCLs) isolated from MS patients and healthy controls (HC) ex vivo to study EBV and host gene expression in the context of an individual's endogenous EBV. SLCLs derived from MS patient B cells during active disease had higher EBV lytic gene expression than SLCLs from MS patients with stable disease or HCs. Host gene expression analysis revealed activation of pathways associated with hypercytokinemia and interferon signalling in MS SLCLs and upregulation of forkhead box protein 1 (FOXP1), which contributes to EBV lytic gene expression. We demonstrate that antiviral approaches targeting EBV replication decreased cytokine production and autologous CD4+ T cell responses in this ex vivo model. These data suggest that dysregulation of intrinsic B cell control of EBV gene expression drives a pro-inflammatory, pathogenic B cell phenotype that can be attenuated by suppressing EBV lytic gene expression.


Conflict of interest statement

Competing Interest Statement

PML is a founder and advisor to Vironika, LLC. PML has served as consultant for GSK and Sanofi. All other authors declare no competing interests.

Figures

Extended Figure 1.
Extended Figure 1.. Characterization of SLCLs.
(a) Proliferation index in SLCLs and LCLs (B95.8), and EBV (−) BJAB cells measured by CFSE (one-way ANOVA followed by Tukey’s multiple comparison test: (HC SLCL, n=4; SMS SLCL, n=6; AMS SLCL n=5; HC LCL, n=8 MS LCL, n=7). (b) Viability of long-term culture of AMS SLCLs compared to HC and SMS SLCLs, LCLs (B95.8), and EBV (−) BJAB cells (Log-rank Mantel-Cox test). (HC SLCL, n=4; SMS SLCL, n=6; AMS SLCL n=5; HC LCL, n=8 MS LCL, n=8). (c) Flow cytometry analysis of EA-D and Zta expression in AMS and SMS and (d) quantitation of flow cytometry using FlowJo software (one-way ANOVA followed by Tukey’s multiple comparison test (HC SLCL, n=4; SMS SLCL, n=6; AMS SLCL n=5; LCL, n=8). (e) Western blot of EBV latent (EBNA1, EBNA2, LMP1, EBNA3C) and lytic (Zta and Ea-D) genes relative to β-actin in EBV B95.8 strain transformed LCLs (HC LCL n=4 MS LCL n=4). (f) RNA-seq summary heatmap showing top EBV lytic genes that are upregulated (red) or downregulated in AMS SLCLs compared to those from HC or SMS SLCLs. (g) RT-qPCR analysis of EBNA1 and LMP1 gene expression in SLCLs compared to LCLs (one-way ANOVA followed by Tukey’s multiple comparison test: (HC SLCL, n=4; SMS SLCL, n=6; AMS SLCL n=5). All data points represent distinct samples tested in triplicate. Data are mean ± SD (DSeq2 Wald Test).
Extended Figure 2.
Extended Figure 2.. Overlap between population and phylogenetic groups of masked genomes.
(a) The top phylogenetic tree is midpoint rooted and ignores branch lengths. (b) The bottom tree is unrooted, emphasizing branch lengths. Branches are colored according to geographic isolation. (HC SLCL, n=4; SMS SLCL, n=6; AMS SLCL n=5). All data points represent distinct samples.
Extended Figure 3.
Extended Figure 3.. Host protein and gene expression in SLCLs compared to LCLs.
(a) Flow cytometry analysis of CD20, Ki67, HLA Class I, and CD45 expression in SLCL HC, SMS, AMS, LCL (B95.8), LCL (Mutu-I), and BJAB. (HC SLCL, n=4; SMS SLCL, n=6; AMS SLCL n = 5, LCL n=16). (b) Principal Component Analysis (PCA) of RNA-Seq comparing SLCLs (green) and LCLs(orange). (c) Volcano plot comparing host gene expression in LCLs vs SLCLs. (d) Gene expression (normalized counts) in LCLs (green) vs SLCLs (red) (DESeq Wald test) (HC SLCL, n=4; SMS SLCL, n=6; AMS SLCL, n = 5; LCL n=15).. All data points represent distinct samples. Stattistical analysis performed using DSeq2 Wald test. Data are mean ± SD.
Extended Figure 4.
Extended Figure 4.. Host gene expression comparing SLCLs between MS and HCs.
(a) Heat map analysis of RNA-seq showing top cellular genes that are upregulated (red) or downregulated (blue) in HC, SMS, and AMS SLCLs (HC SLCL, n=4; SMS SLCL, n=6; AMS SLCL, n = 5,). (b) IPA showing top pathways that are activated (red) or inactivated (blue) in MS SLCLs compared to HC SLCLs (HC SLCL, n=4; SMS SLCL, n=6; AMS SLCL, n = 5,). (c) Volcano plot highlighting differentially regulated host genes in MS SLCLs vs HC SLCLs (HC SLCL, n=4; SMS SLCL, n=6; AMS SLCL n = 5). (d) IPA showing top regulators that are activated (red) or inactivated (blue) in MS SLCLs compared to HC LCLs (HC SLCL, n=4; SMS SLCL, n=6; AMS SLCL n = 5,). Statistical analysis performed using DSeq2. All data points represent distinct samples.
Extended Figure 5.
Extended Figure 5.. Host gene expression comparing Active MS SLCLs to Non-Active SLCLs (SMS SLCLs+ HC SLCLs).
(a) Volcano plot comparing top differentially regulated genes in AMS SLCLs vs non-active SLCLs(HC SLCL, n=4; SMS SLCL, n=6; AMS SLCL, n = 5) DSeq2 Wald Test. (b) Ingenuity pathway analysis showing top pathways that are activated (red) or inactivated (blue) in MS SLCLs compared to HC LCLs (HC SLCL, n=4; SMS SLCL, n=6; AMS SLCL n = 5). (c) IPA showing top regulators that are activated (red) or inactivated (blue) in AMS SLCLs vs non-active SLCLs (HC SLCL, n=4; SMS SLCL, n=6; AMS SLCL, n = 5). (d) Gene expression (normalized counts) in AMS (red), SMS (green) and HC (blue) SLCLs for IL12B and ZMIZ1 (DESeq Wald test) (HC SLCL, n=4; SMS SLCL, n=6; AMS SLCL n = 5). Stattistical analysis performed using DSeq2 Wald Test. All data points represent distinct samples tested. Data for (d) are mean ± SD.
Extended Figure 6.
Extended Figure 6.. Longitudinal analysis and overall comparison of Active MS SLCLs (AMS) with Stable SLCLs (SMS).
(a) Comparison of viral DNA load by ddPCR and (b) EBV LF3 transcript levels by RT-qPCR for SMS2 vs AMS5 (Patient A) and SMS5 vs AS2 (Patient B) (two patients, two timepoints per patient). (c) Heat map comparing all AMS vs SMS showing top 930 differentially regulated genes with p<.05. The gene expression values were log2 normalized and mean-centered to highlight relative changes (SMS n=6; AMS n=5). (d) Gene expression (normalized counts) for all AMS (red) or SMS (green) SLCLs for light chain/immunoglobulin κ, MHC class II DP, MHC class II DR, and IL-6 ((SMS n=6; AMS n=5, DESeq Wald test). All data points represent distinct samples tested from paired-end RNA-seq data set. Data for (d) are mean ± SD.
Extended Figure 7.
Extended Figure 7.. FOXP1 knockdown downregulates EBV lytic gene expression in AMS SLCLs and Mutu-I Burkitt’s lymphoma cells.
(a) RT-qPCR expression of FOXP1 expression relative to GUSB in AMS4 SLCLs treated with 3 individual shRNAs specific for FOXP1 and control shRNA (n=3 per siRNA treatment). (b) Western blot showing of EBV latent (EBNA1 and LMP1) and lytic (EA-D and Zta) genes, and FOXP1 in shRNA control and FOXP1 shRNA treated cells (n=3 per siRNA treatment, TTEST). (c) Western blot showing three biological replicates of shFOXP1 and shCtrl treated Mutu-I cells probed for expression of FOXP1 and EBV lytic gene Zta and EA-D (n=3 per siRNA treatment, TTEST). (d) Zta expression (mean fluorescence intensity) in Mutu-I cells treated with shFOXP1 or shCtrl ((n=3 per siRNA treatment, one-way ANOVA followed by Tukey’s multiple comparison test). All data points represent distinct samples tested in triplicate. Data are mean ± SD.
Extended Figure 8.
Extended Figure 8.. LTA knockdown decreases viability and increases EBV lytic gene expression in SLCLs.
(a-c) AMS2 SLCLs were treated with 3 individual shRNAs specific for LTA or control shRNA (pLKO) and assayed for (a) fold change in LTA RNA expression by RT-qPCR, (b) expression of Zta or (c) EA-D by RT-qPCR, and (d) cell viability. (e-j) HC SLCLs (n=2, triplicate samples per treatment for each cell line); SMS SLCLs (n=2, triplicate samples per treatment for each cell line; and AMS SLCLs (n=2); triplicate samples per treatment for each cell line) treated with shLTA1.1 or shCtrl and assayed for (e) LTA RNA expression by RT-qPCR, (f) LTA/TNFβ protein expression in cell supernatant by ELISA (g) Zta expression by RT-pPCR (h) EA-D expression by RT-qPCR, (i) EBV DNA copies per cell by ddPCR, and (j) cell viability by CellTitreGlo. BJAB used as negative control cell line. (one-way ANOVA followed by Tukey’s multiple comparison test). All data points represent distinct samples tested in triplicate. Data are mean ± SD.
Extended Figure 9.
Extended Figure 9.. Mixed lymphocyte reaction analysis.
(a) IFNγ expression (EliSpot) in CD4+ T cells (1HC SLCL, 1 SMS SLCL, 1AMS SLCL, n=3 for each treatment group) co cultured with autologous SLCLs treated with GCV or DMSO. (one-way ANOVA followed by Tukey’s multiple comparison test). (b) EliSpot analysis of cytokine production during a mixed lymphocyte reaction with three different donor T-cells incubated with HC1 or AMS4 n=3 for each treatment group, one-way ANOVA followed by Tukey’s multiple comparison test). All data points represent distinct samples tested in triplicate. Data are mean ± SD.
Figure 1.
Figure 1.. Generation and growth properties of SLCLs from the PBMC of MS patients and healthy controls (HC).
(a) SLCLs were generated from PBMCs isolated from MS patients (n=11) and healthy controls (n=4) by extended culture of PBMCs without addition of exogenous, lab strain EBV. Three weeks after ex vivo culture, cyclosporin A was added to eliminate residual T -cells. In contrast, LCLs were generated by ex vivo infection with EBV laboratory strain B95.8 and immediate incubation with cyclosporin A. (b) Age of individuals from whom SLCLs were (+) or were not (−) generated (HC n=26; AMS n=11; SMS n=11). The healthy controls from whom we were able to obtain SLCLs were significantly older than the MS patients whose PBMCs yielded SLCLs (one way ANOVA followed by Tukey’s multiple comparison test). (c) EBV DNA copies/cell by (Mann-Whitney test) (HC SLCL n=4; AMS SLCL n=5; SMS SLCL n=6; HC LCL n=8; MS LCL n=8; EBV− n=1). (d) Viability of long-term culture of AMS SLCLs compared to HC and SMS SLCLs, LCLs (B95.8), and EBV (−) BJAB cells (*P<.05, Log-rank Mantel-Cox test) (HC SLCLn=4; AMS SLCL n=5; SMS SLCL n=6; HC LCL n=8; MS LCL n=8; EBV− n=1). All data points represent distinct samples tested in triplicate. (e) Western blot of EBV latent (EBNA1, EBNA2, LMP1, EBNA3C) and lytic (Zta and EA-D) genes relative to β-actin in SLCLs. (f) qRT PCR analysis of EBV lytic gene expression (Zta, EA-D, LF3, and BLLF1) in SLCLs and LCLs (B95.8) from MS patients and controls (HC SLCLn=4; AMS SLCL n=5; SMS SLCL n=6; HC LCL n=8; MS LCL n=8; EBV− n=1). Data are mean ± SD. All data points represent distinct samples.
Figure 2.
Figure 2.. Whole genome NGS sequencing of endogenous EBV in SLCLs from AMS, SMS, and HC.
(a) Copies of EBV genome per 1 M reads. (b) Heterogeneity of EBV sequences found within samples from AMS (n=4), SMS (n=3), and HC (n=2). (c) AMS, SMS, and HC endogenous EBV aligned to the wild-type EBV genome (NC_007605.1). (d) Protein coding variations in EBNA3A identified in MS patients. (e) Heterogeneity in oriP visualized by the number of variations compared to the reference. (f) Sequence alignment comparing variations in region 7780–7816 in oriP. (g) Phylogenetic analysis of EBNA1 from SLCLs and other EBV associated diseases, including: infectious mononucleosis (IM), diffuse large B cell lymphoma (DLBL), NK/T lymphoma, chronic active EBV (CAEBV), eBL (endemic Burkitt’s lymphoma), nasopharyngeal carcinoma (NPC), gastric cancer (EBVaGC), post-transplant lymphoproliferative disorder (PTDL), post-transplant B lymphoma (PTBL). The EBNA1 protein sequences for each category are shown in the upper panel. (h) ChIP assay for EBNA1 binding to the DS, Qp, and cellular HLA locus (CLIC1 gene) in SLCLs. P values were determined for three biological replicates (Two-way ANOVA); AMS (n=3), SMS (n=3), and HC (n=2). Immunoprecipitation was performed with IgG as a control (not shown). All data points represent distinct samples tested in triplicate. Data are mean ± SD.
Figure 3.
Figure 3.. Cell size, surface marker expression and gene expression analysis in SLCLs compared to LCLs.
(a) Cell size as estimated by forward scatter (FSC-A) using flow cytometry in SLCLs (AMS (n=5), SMS (n=6), and HC (n=2)), LCLs (n=16) and Burkitt’s lymphoma cells (Mutu-I and BJAB). (b) Flow cytometry quantitation of CD19, CD21, CD11c, and HLA Class II expression in B cell lines (one-way ANOVA followed by Tukey’s multiple comparison test), Expression measured by mean fluorescence intensity (MFI). (c) Flow cytometry immunophenotyping of B cell memory and plasmablasts using CD24 and CD38 markers (top panel). Quantification of immunophenotyping for LCLs (green) and SLCLs (red) (lower panel). (d) Heatmap cluster analysis of RNA-seq showing top cellular genes that are upregulated (red) or downregulated (blue) in SLCLs vs LCLs (e) Ingenuity pathway analysis (IPA) showing top pathways that are upregulated or downregulated in SLCLs compared to LCLs. (f) IPA showing top regulators that are activated (red) or inactivated (blue) in SLCLs compared to LCLs across select categories of interest. (g) Gene expression (Log2 normalized counts) for notable significantly differentially regulated genes in LCLs (green) compared to SLCLs (red) Statistics generated using the DESeq Wald test (LCL n=15, SLSL n=9). All data points represent distinct samples. Data are mean ± SD.
Figure 4.
Figure 4.. Gene expression in SLCLs from AMS, SMS, and HC.
(a) Heat map summary of RNA-seq data showing top cellular genes that are upregulated (red) or downregulated (blue) in HC (n=4), SMS (n=6), and AMS (n=5) SLCLs. (b) Box plot of CD44 and HAVCR2 normalized counts from RNA-seq for SLCLs from HC, SMS, and AMS (DESeq Wald test). (c) CD44 and HACVR2 cell surface expression by flow cytometry (one-way ANOVA followed by Tukey’s multiple comparison test) AMS (n=5), SMS (n=6), and HC (n=4) SLCL. (d) Volcano plot comparing host gene expression in AMS vs HC SLCLs. (e-f) IPA showing top pathways (e) and regulators (f) that are activated or inactivated in AMS compared to HC SLCLs. All data points represent distinct samples. Data are mean ± SD.
Figure 5.
Figure 5.. shRNA depletion of FoxP1 or LTA affect EBV latency and SLCL viability.
(a) FOXP1 expression (normalized counts) in SLCLs from HC (blue), SMS (green), and AMS (red) (DESeq Wald test) AMS (n=5), SMS (n=6), and HC (n=4) SLCL. (b) RT-qPCR for FOXP1 and Zta in AMS4 SLCL treated in biological triplicates with shCtrl or shFOXP1 (one-way ANOVA followed by Tukey’s multiple comparison test). (c) Western blot for FOXP1, EA-D, ZTA, and β-actin in Mutu-I cells treated with shCtrl and shFOXP1. (d) Quantification of FOXP1, Zta, and EA-D Western blot for FOXP1, EA-D, ZTA, and β-actin in Mutu-I cells treated with control and FOXP1 shRNA (one-way ANOVA followed by Tukey’s multiple comparison test). (e) EBV viral load (copies per cell) in Mutu-I cells treated with control and FOXP1 shRNA ( one-way ANOVA followed by Tukey’s multiple comparison test) (f) LTA expression (normalized counts) in SLCLs from (HC (blue), SMS (green), and AMS (red) AMS (n=5), SMS (n=6), and HC (n=4) SLCL (g) RT-qPCR for Zta and EA-D in Mutu-I cells treated with shCtrl and shFOXP1 ( one-way ANOVA followed by Tukey’s multiple comparison test). (h) EBV viral load (copies per cell) in Mutu-I cells treated with shCtrl or shLTA (p<0.001; one-way ANOVA followed by Tukey’s multiple comparison test). (i) Flow cytometry for Zta in Mutu-I cells treated with shCtrl or shLTA (one-way ANOVA followed by Tukey’s multiple comparison test). (j) Live dead stain (Zombie-NIR) in SLCLs cells treated with shCtrl and shLTA flow histogram (left) and increase (%) in cell death of shLTA compared to shCtrl (right). All data points represent distinct samples tested in triplicate. Data are mean ± SD.
Figure 6.
Figure 6.. Tenofovir alanfenamide (TAF) decrease EBV lytic activity and inflammation in SLCLs from MS patients.
GCV (12.5μM), FOS (100μg/ml), and TAF (5μM) were added to SLCLs and LCLs (B95.8) for five days with medium changed daily in HC SLCLs (n=4), SMS LCLs (n=6), AMS LCLs (n=4), B95.8 transformed LCLs (n=3), Burkitt’s lymphoma cells (Mutu-I), and NaB+TPA induced Mutu-I cells. (a) Zta expression by RT-qPCR EBV (% decrease compared to DMSO treated control) in cells treated with GCV or TAF. (b) Viral load in LCLs and SLCLs treated with TAF (% decrease compared to DMSO treated control). (c) Cell death (% dead compared to DMSO treated control) in cells treated with GCV or TAF. (d) IL-6, GM-CSF, LTA/TNFβ, and IL-10 LTA expression by intracellular cytokine stain for AMS, SMS, and HC SLCLs. (e) IL-6 and LTA/TNF-β expression in SLCLs from two AMS patients and two HC treated with TAF. (f) IFNγ production from autologous CD4+ T cells to SLCLs treated with TAF for five days (one-way ANOVA followed by Tukey’s multiple comparison test). All data points represent distinct samples tested in triplicate. Data are mean ± SD.

Update of

References

    1. Young LS, Yap LF & Murray PG Epstein-Barr virus: more than 50 years old and still providing surprises. Nat Rev Cancer 16, 789–802, doi:10.1038/nrc.2016.92 (2016). - DOI - PubMed
    1. Thorley-Lawson DA EBV Persistence--Introducing the Virus. Curr Top Microbiol Immunol 390, 151–209, doi:10.1007/978-3-319-22822-8_8 (2015). - DOI - PMC - PubMed
    1. Taylor GS, Long HM, Brooks JM, Rickinson AB & Hislop AD The immunology of Epstein-Barr virus-induced disease. Annu Rev Immunol 33, 787–821, doi:10.1146/annurev-immunol-032414-112326 (2015). - DOI - PubMed
    1. Soldan SS & Lieberman PM Epstein-Barr Virus Infection in the Development of Neurological Disorders. Drug Discov Today Dis Models 32, 35–52, doi:10.1016/j.ddmod.2020.01.001 (2020). - DOI - PMC - PubMed
    1. Soldan SS & Lieberman PM Epstein-Barr virus and multiple sclerosis. Nat Rev Microbiol, doi:10.1038/s41579-022-00770-5 (2022). - DOI - PMC - PubMed

MeSH terms

LinkOut - more resources