. 2024 Jul;9(7):1856-1872.
doi: 10.1038/s41564-024-01701-1. Epub 2024 May 28.

Mycobacterium tuberculosis produces D-serine under hypoxia to limit CD8+ T cell-dependent immunity in mice

Affiliations

Mycobacterium tuberculosis produces D-serine under hypoxia to limit CD8+ T cell-dependent immunity in mice

Hongyu Cheng et al. Nat Microbiol. 2024 Jul.

Abstract

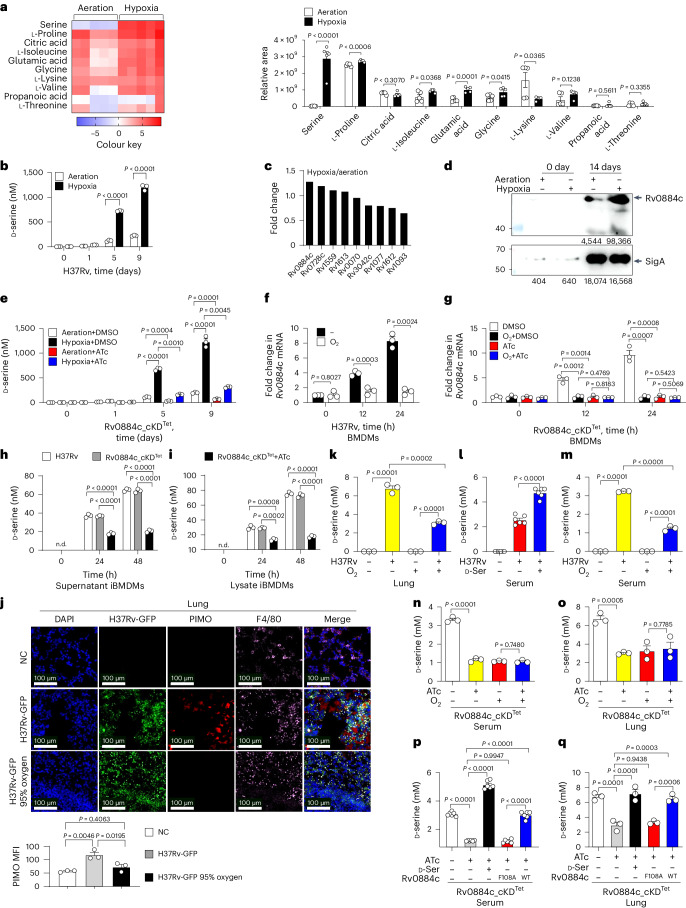
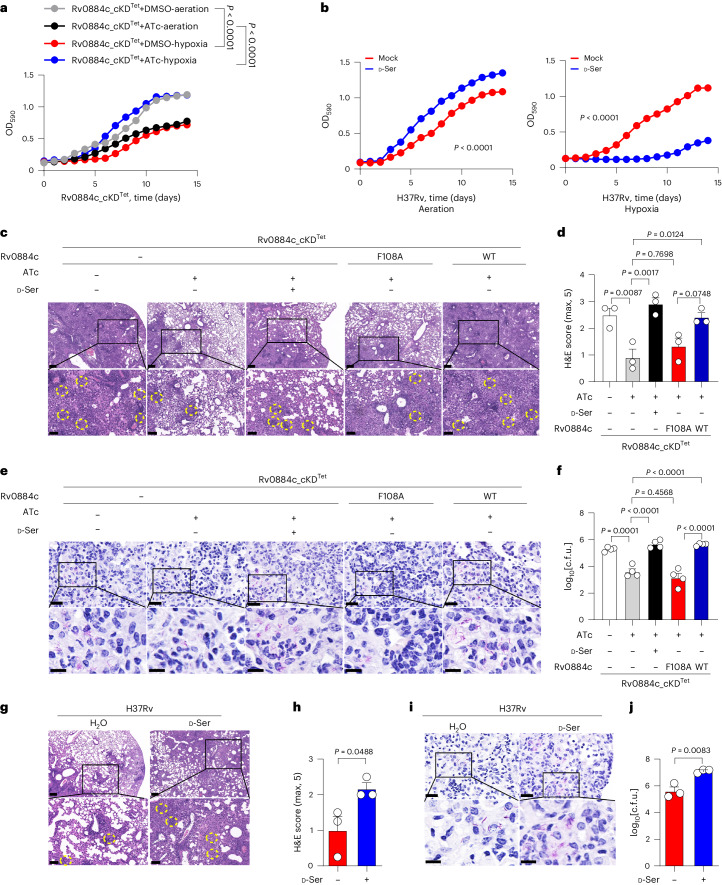
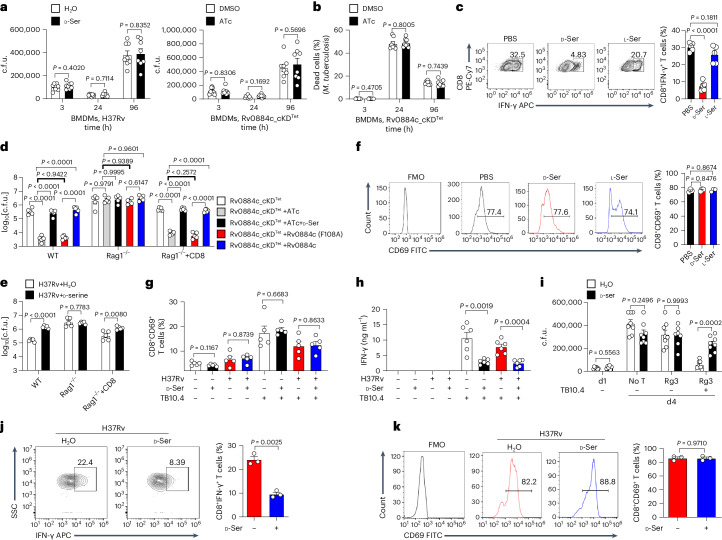
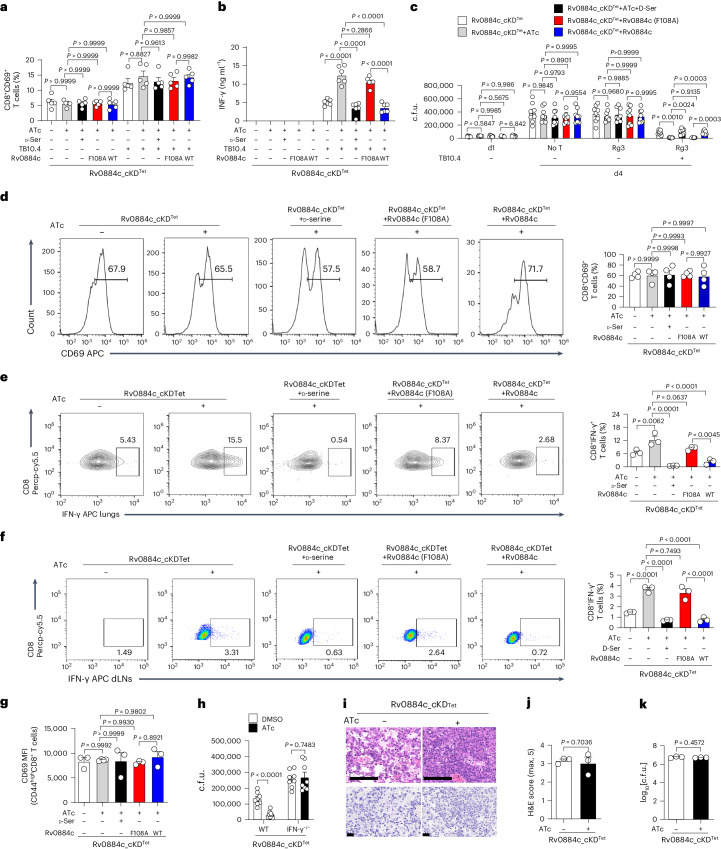
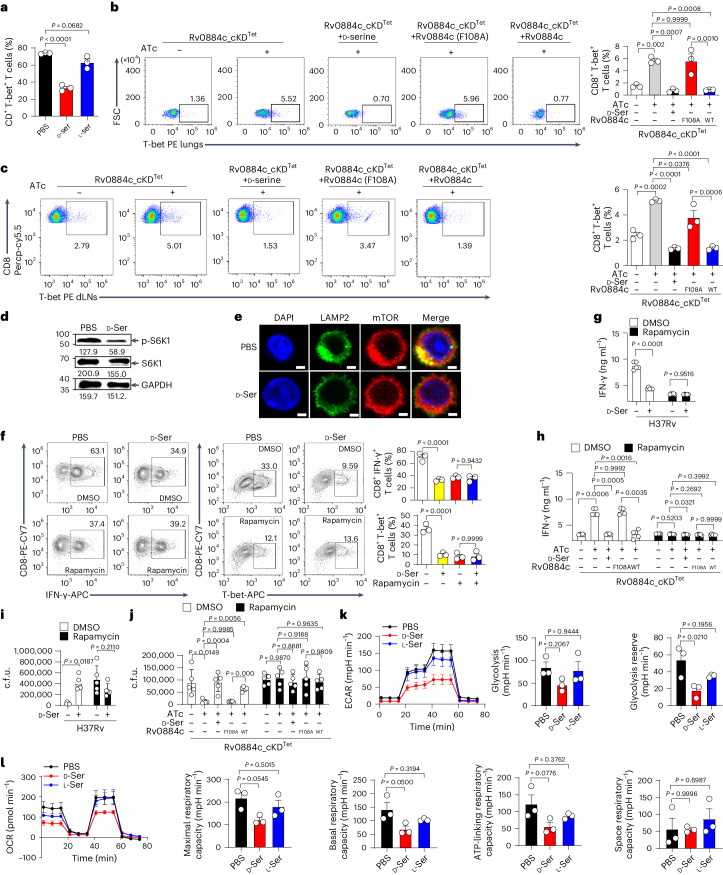
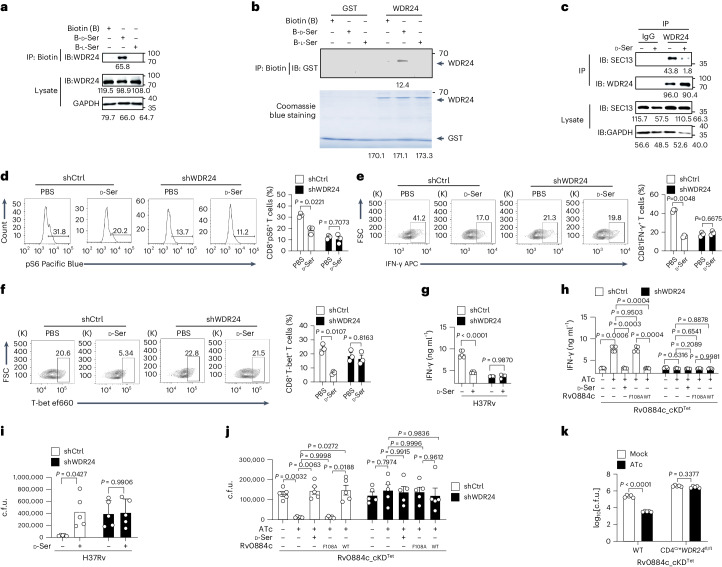
Adaptation to hypoxia is a major challenge for the survival of Mycobacterium tuberculosis (Mtb) in vivo. Interferon (IFN)-γ-producing CD8+ T cells contribute to control of Mtb infection, in part by promoting antimicrobial activities of macrophages. Whether Mtb counters these responses, particularly during hypoxic conditions, remains unknown. Using metabolomic, proteomic and genetic approaches, here we show that Mtb induced Rv0884c (SerC), an Mtb phosphoserine aminotransferase, to produce D-serine. This activity increased Mtb pathogenesis in mice but did not directly affect intramacrophage Mtb survival. Instead, D-serine inhibited IFN-γ production by CD8+ T cells, which indirectly reduced the ability of macrophages to restrict Mtb upon co-culture. Mechanistically, D-serine interacted with WDR24 and inhibited mTORC1 activation in CD8+ T cells. This decreased T-bet expression and reduced IFN-γ production by CD8+ T cells. Our findings suggest an Mtb evasion mechanism where pathogen metabolic adaptation to hypoxia leads to amino acid-dependent suppression of adaptive anti-TB immunity.


Conflict of interest statement

The authors declare no competing interests.

Figures

Fig. 1
Fig. 1. Mycobacterial d-serine is induced by hypoxia through Rv0884c.
a, Heat map (left) and relative area (right) of part of the metabolite differentially secreted from H37Rv incubated under aeration or hypoxia for 14 days. b, Assay of d-serine concentration from culture supernatants of H37Rv incubated under aeration and hypoxia for indicated days. c, Fold change of serine metabolism-related proteins from proteomic profiling of cell lysates from H37Rv under aeration or hypoxia for 14 days. d, Immunoblot (IB) of cell lysate from H37Rv incubated under aeration and hypoxia. Levels of Rv0884c and SigA proteins were quantified using ImageJ and are indicated below blots. e, d-serine concentration in the culture supernatants from Rv0884c_cKDTet strain incubated with or without ATc under aeration and hypoxia for indicated days. f,g, qPCR analysis of Rv0884c mRNA from BMDMs infected with H37Rv (f) or Rv0884c_cKDTet strain treated with DMSO or ATc (g) and incubated in the condition of normal air (−) or 95% O2 (O2) for indicated times. h,i, d-serine concentration in the culture supernatants (h) or cell lysates (i) from iBMDMs infected with H37Rv or Rv0884c_cKDTet strain incubated with or without ATc for indicated times. n.d., not detected. jo, C57BL/6 mice were aerosol-infected with GFP-H37Rv (j,k,m), H37Rv (l) or Rv0884c_cKDTet and then fed with or without doxycycline (n,o) for 4 weeks. Infected mice were exposed to either 95% O2 or normal air for 20 h before being killed. NC, uninfected mice. Lung immunofluorescence staining of PIMO (red), H37Rv (green), F4/80 (pink) and DAPI (blue) was performed. Mean fluorescence intensity (MFI) of PIMO was quantified using ImageJ (j). d-serine concentration in the supernatant of lung homogenates (k,o) and serum (ln) was analysed. p,q, C57BL/6 mice were aerosol-infected with indicated Mtb strains for 4 weeks. d-serine concentration in serum (p) and lung homogenate supernatant (q) was analysed. Data in a, b and dq represent one experiment with at least three independent biological replicates. Results are shown as mean ± s.e.m. Two-tailed unpaired Student’s t-test (a,b,ei,ko) and one-way ANOVA with Tukey’s multiple comparisons test (j,p,q) were used for statistical analysis. Source data
Fig. 2
Fig. 2. Rv0884c/d-serine impairs anti-TB immunity.
a, In vitro growth curve of Rv0884c_cKDTet incubated with or without ATc under aeration or hypoxia at 37 °C for 14 days. b, In vitro growth curve of H37Rv with addition of 10 mM d-serine incubated under aeration (left) or hypoxia (right) at 37 °C for 14 days. cf, C57BL/6 mice were aerosol-infected with ~200 c.f.u. per mouse of Rv0884c_cKDTet with or without ATc, Rv0884c_cKDTet with ATc and d-serine, Rv0884c_cKDTet+Rv0884c (F108A) with ATc, and Rv0884c_cKDTet+Rv0884c with ATc. After 4 weeks of infection, histopathology of lung sections from infected mice was assessed via H&E staining (c; scale bar, 200 μm (top) and 100 μm (bottom)), histology score (d), acid-fast staining (e; scale bar, 20 μm (top) and 10 μm (bottom)) and bacterial load (f). The areas of leucocyte infiltration between conditions are labelled using yellow dotted circles. gj, C57BL/6 mice were aerosol-infected with ~200 c.f.u. per mouse of H37Rv, and then 30 g l−1 d-serine was administered via drinking water to half of the infected mice. After 4 weeks of infection, histopathology of lung sections from infected mice was assessed via H&E staining (g; scale bar, 200 μm (top) and 100 μm (bottom)), histology score (h), acid-fast staining (i; scale bar, 20 μm (top) and 10 μm (bottom)) and bacterial load (j). The areas of leucocyte infiltration between conditions are labelled using yellow dashed circles. Data in aj represent one experiment with at least three independent biological replicates. Results are shown as mean ± s.e.m. Two-way ANOVA with Tukey’s multiple comparisons test (a,b), one-way ANOVA with Tukey’s multiple comparisons test (d,f) and two-tailed unpaired Student’s t-test (h,j) were used for statistical analysis. Source data
Fig. 3
Fig. 3. d-serine inhibits IFN-γ production by CD8+ T cells.
a, Intracellular survival of H37Rv in BMDMs treated with or without d-serine (10 mM) (left) or Rv0884c_cKDTet treated with or without ATc in BMDMs (right) was assessed using c.f.u. assay. b, Bacterial viability of Rv0884c_cKDTet treated with or without ATc in BMDMs was assayed using the LIVE/DEAD BacLight bacterial viability kit. c,f, Naïve CD8+ T cells were activated and differentiated with anti-CD3 and anti-CD28 antibodies in the presence of IL-2 and IL-12 p70 for 5 days and treated with PBS, d-serine or l-serine. Percentage of IFN-γ+ (c) and CD69+ (f) CD8+ T cells was assayed. APC, allophycocyanin. d,e, WT mice, Rag1−/− mice and Rag1−/− mice adoptively transferred with CD8+ T cells (Rag1−/−+CD8) were aerosol-infected with ~200 c.f.u. of indicated Mtb strains (d, Rv0884c_cKDTet with or without ATc, Rv0884c_cKDTet+Rv0884c (F108A) with ATc, and Rv0884c_cKDTet+Rv0884c with ATc; e, H37Rv) or treated with d-serine. Bacterial load in lung tissues at 4 weeks post infection was determined using c.f.u. assay. g, After co-culturing H37Rv-infected BMDMs (MOI = 5) and activated TB10Rg3 T cells treated with or without d-serine for 2 h, percentage of CD69+ TB10Rg3 T cells was measured in TB10Rg3 T cells. h, After co-culturing H37Rv-infected BMDMs (MOI = 5) and activated TB10Rg3 T cells treated with or without d-serine for 3 days, the expression of IFN-γ was measured using ELISA. i, After 1 day of infection with Mtb strains, BMDMs were co-incubated with activated TB10Rg3 T cells treated with or without d-serine for 3 days, and intracellular c.f.u. in BMDMs infected for 1 or 4 days were determined. No T, group of unpulsed BMDMs infected with H37Rv for 4 days without co-incubation with T cells; d1, group of unpulsed BMDMs infected with H37Rv for 1 day without co-incubation with T cells; d4, group of BMDMs infected with H37Rv for 4 days; Rg3, group of pulsed or unpulsed BMDMs infected with H37Rv for 4 days and co-incubated with TB10Rg3 T cells. j,k, C57BL/6 mice were aerosol-infected with ~200 c.f.u. per mouse of H37Rv and administered with d-serine for 4 weeks. Percentages of IFN-γ+ (j) and CD69+ (k) CD8+ T cells in lung tissues were measured; FMO was used as control. Data in ak represent one experiment with at least three independent biological replicates. Results are shown as mean ± s.e.m. Two-way ANOVA with Tukey’s multiple comparisons test (i), one-way ANOVA with Tukey’s multiple comparisons test (c,d,f) and two-tailed unpaired Student’s t-test (a,b,e,g,h,j,k) were used for statistical analysis. Source data
Fig. 4
Fig. 4. Rv0884c inhibits IFN-γ production by CD8+ T cells.
a, After co-culturing indicated Mtb strains-infected BMDMs (MOI = 5) and activated TB10Rg3 T cells for 2 h, the percentage of CD69+ TB10Rg3 T cells was measured in TB10Rg3 T cells. b, After co-culturing indicated Mtb strains-infected BMDMs (MOI = 5) and activated TB10Rg3 T cells for 3 days, the expression of IFN-γ was measured using ELISA. c, After 1 day of infection with Mtb strains, BMDMs were co-incubated with activated TB10Rg3 T cells for 3 days and intracellular c.f.u. in BMDMs infected for 1 or 4 days were determined. dg, C57BL/6 mice were aerosol-infected with ~200 c.f.u. per mouse of Rv0884c_cKDTet with or without ATc, Rv0884c_cKDTet with ATc and d-serine (30 g l−1), Rv0884c_cKDTet+Rv0884c (F108A) with ATc, and Rv0884c_cKDTet+Rv0884c with ATc. After 4 weeks of infection, we assayed: the percentage of CD69+CD8+ T cells (d); the percentage of CD8+IFN-γ+ T cells in CD8+ T cells from lung tissues (e), or from dLNs (f); and CD69 MFI of CD44high CD8+ T cells in CD8+ T cells from lung tissues (g). h, Peptide (TB10.44–11)-pulsed BMDMs were infected with Rv0884c_cKDTet treated with or without ATc for 1 day and then co-cultured with in vitro differentiated CD8+ T cells from spleens of C57BL6 mice or CD4CreIfngfl/fl mice for another 3 days. Bacterial burden was measured 4 days after infection. ik, CD4CreIfngfl/fl mice were aerosol-infected with ~200 c.f.u. per mouse of Rv0884c_cKDTet with or without ATc for 4 weeks. Histopathology of lung sections from infected mice was assessed via H&E staining (i, top; scale bar, 100 μm), acid-fast staining (i, bottom; scale bar, 20 μm), histology score (j) and bacterial load (k). Data in ak represent one experiment with at least three independent biological replicates. Results are shown as mean ± s.e.m. Two-way ANOVA with Tukey’s multiple comparisons test (c), one-way ANOVA with Tukey’s multiple comparisons test (a,b,dg) and two-tailed unpaired Student’s t-test (h,j,k) were used for statistical analysis. Source data
Fig. 5
Fig. 5. Rv0884c/d-serine inhibits IFN-γ production by CD8+ T cells via inactivation of mTORC1.
a,d,e, Naïve CD8+ T cells were stimulated with anti-CD3 antibodies, anti-CD28 antibodies, IL-2 and IL-12 p70 for 5 days and treated with PBS, d-serine or l-serine. Percentage of T-bet+ CD8+ T cells was analysed using fluorescence-activated cell sorting (FACS) (a); phosphorylation of S6K1 was assayed (d) and levels of S6K1, p-S6K1 and GAPDH were quantified using ImageJ and are indicated below blots (d); co-localization of lysosomes with mTOR was analysed (e; scale bar, 2 μm). b,c, C57BL/6 mice were aerosol-infected with indicated Mtb strains. Expression of T-bet in CD8+ T cells from lung tissues (b) and dLNs (c) was analysed using FACS. f, Naïve CD8+ T cells were stimulated with anti-CD3 antibodies, anti-CD28 antibodies, IL-2 and IL-12 p70 for 5 days and treated with PBS, d-serine or mTORC1 inhibitor rapamycin. Expression of IFN-γ (left group) and T-bet (middle group) was assayed via FACS and quantified as percentage of CD8+ T cells (right). g,h, BMDMs infected with H37Rv (g) or indicated Mtb strains (h) for 1 day were co-incubated with TB10Rg3 T cells treated with or without d-serine or rapamycin for another 3 days. The expression of IFN-γ was measured using ELISA. i,j, BMDMs infected with H37Rv (i) or indicated Mtb strains (j) for 1 day were co-incubated with TB10Rg3 T cells treated with or without d-serine or rapamycin for another 3 days. Intracellular c.f.u. in BMDMs were determined. k,l, Naïve CD8+ T cells were stimulated with anti-CD3 and anti-CD28 antibodies in the presence of IL-2 for 24 h and treated with PBS, d-serine or l-serine. ECAR (k) and OCR (l) were measured and analysed via Seahorse metabolic assay. Data in al represent one experiment with at least three independent biological replicates. Results are shown as mean ± s.e.m. Two-way ANOVA with Tukey’s multiple comparisons test (gj) and one-way ANOVA with Tukey’s multiple comparisons test (ac,f,k,l) were used for statistical analysis. Source data
Fig. 6
Fig. 6. d-serine interacts with WDR24 to suppress anti-TB immunity functions through IFN-γ.
a, Co-IP was performed to detect the interaction between d-serine and WDR24 in T cells. Values below blots indicate densitometry quantification with ImageJ. b, Direct interaction of d-serine with WDR24 was detected using GST pull-down assay in vitro. Values below blots indicate densitometry quantification with ImageJ. c, Co-IP was performed to detect the interaction of WDR24 with other components of GATOR2 (SEC13), which is interrupted by d-serine. Values below blots indicate densitometry quantification with ImageJ. df, WDR24-knockdown CD8+ T cells were treated with PBS or d-serine. The phosphorylation of S6 (d), the expression of T-bet (e) and IFN-γ (f) in WT CD8+ T cells or WDR24-knockdown CD8+ T cells were analysed using FACS. g,i, BMDMs infected with H37Rv (MOI = 5) for 1 day were co-incubated with TB10Rg3 T cells or WDR24-knockdown TB10Rg3 T cells treated with or without d-serine (10 mM) for another 3 days. The expression of IFN-γ was measured using ELISA (g); intracellular c.f.u. in BMDMs were determined (i). h,j, BMDMs were infected with indicated Mtb strains (MOI = 5) for 1 day and co-incubated with TB10Rg3 T cells or WDR24-knockdown TB10Rg3 T cells for another 3 days. The expression of IFN-γ was measured using ELISA (h); intracellular c.f.u. in BMDMs were determined (j). k, CD4CreWDR24fl/fl mice were aerosol-infected with ~200 c.f.u. per mouse of Rv0884c_cKDTet treated with or without ATc for 4 weeks. Bacterial load in lung tissues was determined using c.f.u. assay. Data in ak represent one experiment with at least three independent biological replicates. Results are shown as mean ± s.e.m. Two-way ANOVA with Tukey’s multiple comparisons test (dk) was used for statistical analysis. Source data
Extended Data Fig. 1
Extended Data Fig. 1. Mycobacterial D-serine, but not L-serine is induced by hypoxia through Rv0884c.
(a) Quantitative metabolomics approach. (b) Assay of L-serine concentration from culture supernatants of H37Rv incubated under aeration or hypoxia. (c) Quantitative proteomics approach. (d) IB of Rv0884c107-376aa. (e) qPCR analysis of Rv0884c mRNA from H37Rv incubated under aeration or hypoxia. (f) IB of cell lysates derived from Rv0884c_cKDTet strains treated with or without ATc. (g) L-serine concentration in the culture supernatants from Rv0884c_cKDTet strain incubated with or without ATc under aeration or hypoxia. (h-j) Mice infected with GFP-H37Rv for 4 weeks were exposed to either 95% O2 or normal air for 20 hours before sacrifice. Immunofluorescence staining of dLN was performed. MFI of PIMO were quantified with ImageJ (h). Scale bar, 100 μm; L-serine concentration of lung homogenate supernatants (i) and sera (j) were analyzed. (k, l) Mice infected with Rv0884c_cKDTet treated with or without ATc for 4 weeks were exposed to either 95% O2 or normal air for 20 hours before sacrifice. L-serine concentration of lung homogenate supernatant (k) and serum (l) were analyzed. (m-n, p) L-serine concentration of lung homogenate supernatant (m) and serum (n) from indicated Mtb strains infected-mice were analyzed at 4 weeks post-infection; The c.f.u. of lungs were assayed 1 day post-infection (p). (o) Heatmap of metabolites secreted from indicated Mtb strains incubated under aeration or hypoxia. (q) H37Rv infected-mice were administered with or without D-serine. Lung c.f.u. were assayed 1 day post-infection. All data represent one experiment with at least three independent biological replicates. Results are shown as mean ± s.e.m. Two-way ANOVA with Tukey’s multiple comparisons test (b, e, g), one-way ANOVA with Tukey’s multiple comparisons test (i-n, p) and Two-tailed unpaired Student’s t-test (h, q) were used for statistical analysis. Source data
Extended Data Fig. 2
Extended Data Fig. 2. D-serine inhibits IFN-γ production by CD8+ and CD4+ T cells.
(a, b) Percentages of CD8+ IFN-γ+ T cells (a) and CD8+ T-bet+ T cells (b) from differentiated CD8+ T cells treated with hypoxia-induced Mtb metabolites (10 mM) in vitro were analyzed by FACS. (c) Percentages of CD4+ IFN-γ+ T cells from differentiated Th1 cells treated with PBS, D-serine or L-serine (10 mM) were analyzed by FACS in vitro. All data represent one experiment with at least three independent biological replicates. Results are shown as mean ± s.e.m. One-way ANOVA with Tukey’s multiple comparisons test (a-c) was used for statistical analysis. Source data
Extended Data Fig. 3
Extended Data Fig. 3. Effect of Rv0884c/D-serine on the percentage of Mtb antigen-specific CD8 T cells in lung tissues.
C57BL/6 mice were aerosol-infected with approximately 200 c.f.u. per mouse of Rv0884c_cKDTet with or without ATc, Rv0884c_cKDTet with ATc and D-serine (30 g/L), Rv0884c_cKDTet+Rv0884c (F108A) with ATc, Rv0884c_cKDTet+Rv0884c with ATc. At 4 weeks post infection, percentage of 32a309-319 specific and TB10.44−11 specific CD8+ T cells from CD8+ T cells in lung tissues was detected by FACS. All data represent one experiment with at least three independent biological replicates. Results are shown as mean ± s.e.m. One-way ANOVA with Tukey’s multiple comparisons test was used for statistical analysis. Source data
Extended Data Fig. 4
Extended Data Fig. 4. Effect of Rv0884c on the different subsets of CD8 T cells in lung tissues.
(a-c) C57BL/6 mice were aerosol-infected with approximately 200 c.f.u. per mouse of Rv0884c_cKDTet with or without ATc, Rv0884c_cKDTet with ATc and D-serine (30 g/L), Rv0884c_cKDTet+Rv0884c (F108A) with ATc, Rv0884c_cKDTet+Rv0884c with ATc. At 4 weeks post infection, we assayed: percentage of CD8+CD44highTNF-α+ T cells (a), CD8+CD44highIL-17A+ T cells (b), and CD8+CD44highgranzyme B+ T cells (c) from the CD8+CD44high T cells in lung tissues by FACS. All data represent one experiment with at least three independent biological replicates. Results are shown as mean ± s.e.m. One-way ANOVA with Tukey’s multiple comparisons test (a-c) was used for statistical analysis. Source data
Extended Data Fig. 5
Extended Data Fig. 5. Rv0884c/D-serine inhibits the IFN-γ production of CD8+ T cells by inactivating mTORC1.
(a) Expression of T-bet reporter gene treated with PBS or D-serine (10 mM) was detected using dual luciferase reporter gene assay. (b-d) Expression of p-STAT1 (d), p-STAT-4 (c) or Eomes (b) in CD8+ T cells treated with PBS or D-serine (10 mM) were analyzed by FACS in vitro. (e) Phosphorylation of S6K1 in 293 T cells treated with PBS or D-serine (10 mM) was measured using western blot. Values below blots indicate densitometry quantification with ImageJ. (f) Mitochondrial mass was measured in primary CD8+ T cells treated with PBS, L-serine or D-serine (10 mM). (g) Naïve CD8+ T cells were stimulated with anti-CD3 in the presence of anti-CD28 antibodies, IL-2 and IL-12 p70 for 5 days and treated with PBS, D-serine (10 mM), 2-DG (4 mM) and Oligomycin (1 μM). Expression of IFN-γ (up) and T-bet (down) from the CD8+ T cells was assayed. (h) Naïve CD8+ T cells were stimulated with anti-CD3 in the presence of anti-CD28 antibodies, IL-2 and IL-12 p70 for 5 days and treated with PBS or D-serine (10 mM). Percentage of CD25+CD8+ T cells from the CD8+ T cells was detected by FACS. (i) The IL-2 level of serum from H37Rv-infected mice was detected by ELISA. (j, k) C57BL/6 mice were aerosol-infected with indicated Mtb strains. At 4 weeks post infection, IL-2 level of serum was detected by ELISA (j); Percentage of CD25+CD8+ T cells from the CD8+ T cells in lung tissues was detected by FACS (k). All data represent one experiment with at least three independent biological replicates. Results are shown as mean ± s.e.m. One-way ANOVA with Tukey’s multiple comparisons test (f, i-k) and Two-tailed unpaired Student’s t-test (a-d, g-h) were used for statistical analysis. Source data
Extended Data Fig. 6
Extended Data Fig. 6. D-serine inhibits mTORC1 activity via WDR24.
(a) Representative mass spectrum of interacting proteins for biotin-D-serine identified by LC-MS/MS analysis. (b) WT and WDR24 knockdown 293 T cells were treated with PBS or D-serine (10 mM). Phosphorylation of S6K1 was assayed. Levels of S6K1, p-S6K1, β-actin and WDR24 were quantified with ImageJ. Values below blots indicate densitometry quantification with ImageJ. Data of b represents one experiment with at least three independent biological replicates. Source data
Extended Data Fig. 7
Extended Data Fig. 7. Summary diagram.
Hypoxia conditions induce Mtb D-serine production via promoting the expression of phosphoserine aminotransferase Rv0884c. In CD8+ T cells, D-serine directly interacts with WDR24, a subunit of GATOR2, to inhibit mTORC1 mediated T-bet expression and IFN-γ secretion, leading to Mtb survival (The black arrows represent ‘induce’ or ‘promote’; The red downward arrow indicates a decrease in expression of IFN-γ; The red cross on the T cell side represent ‘inhibit’).
Extended Data Fig. 8
Extended Data Fig. 8. Schematic representation of mice experimental design.
Schematic representation of mice experimental design for Figs. 1p–q, 2c–f, 4d–g and 5b,c, and Extended Data Figs. 1m,n,p, 3, 4a–c and 5j,k (left panels of top groups). Schematic representation of mice experimental design for Fig. 1j,k,m and Extended Data Fig. 1h–j (left panels of middle groups). Schematic representation of mice experimental design for Figs. 1l, 2g–j and 3j,k, and Extended Data Figs. 1q and 5i (left panels of bottom groups). Schematic representation of mice experimental design for Fig. 3d (right panels of top groups). Schematic representation of mice experimental design for Fig. 3e (right panels of middle groups). Schematic representation of mice experimental design for Fig. 1n,o, and Extended Data Fig. 1k,l (right panels of bottom groups).

References

    1. Aly S, et al. Oxygen status of lung granulomas in Mycobacterium tuberculosis-infected mice. J. Pathol. 2006;210:298–305. doi: 10.1002/path.2055. - DOI - PubMed
    1. Pagan AJ, Ramakrishnan L. The formation and function of granulomas. Annu. Rev. Immunol. 2018;36:639–665. doi: 10.1146/annurev-immunol-032712-100022. - DOI - PubMed
    1. Via LE, et al. Tuberculous granulomas are hypoxic in guinea pigs, rabbits, and nonhuman primates. Infect. Immun. 2008;76:2333–2340. doi: 10.1128/IAI.01515-07. - DOI - PMC - PubMed
    1. Crowther RR, Qualls JE. Metabolic regulation of immune responses to Mycobacterium tuberculosis: a spotlight on l-arginine and l-tryptophan metabolism. Front. Immunol. 2020;11:628432. doi: 10.3389/fimmu.2020.628432. - DOI - PMC - PubMed
    1. Gouzy A, et al. Mycobacterium tuberculosis exploits asparagine to assimilate nitrogen and resist acid stress during infection. PLoS Pathog. 2014;10:e1003928. doi: 10.1371/journal.ppat.1003928. - DOI - PMC - PubMed

MeSH terms