. 2024 Jun;9(6):1454-1466.
doi: 10.1038/s41564-024-01691-0. Epub 2024 May 28.

Microbial polyphenol metabolism is part of the thawing permafrost carbon cycle

Affiliations

Microbial polyphenol metabolism is part of the thawing permafrost carbon cycle

Bridget B McGivern et al. Nat Microbiol. 2024 Jun.

Abstract

With rising global temperatures, permafrost carbon stores are vulnerable to microbial degradation. The enzyme latch theory states that polyphenols should accumulate in saturated peatlands due to diminished phenol oxidase activity, inhibiting resident microbes and promoting carbon stabilization. Pairing microbiome and geochemical measurements along a permafrost thaw-induced saturation gradient in Stordalen Mire, a model Arctic peatland, we confirmed a negative relationship between phenol oxidase expression and saturation but failed to support other trends predicted by the enzyme latch. To inventory alternative polyphenol removal strategies, we built CAMPER, a gene annotation tool leveraging polyphenol enzyme knowledge gleaned across microbial ecosystems. Applying CAMPER to genome-resolved metatranscriptomes, we identified genes for diverse polyphenol-active enzymes expressed by various microbial lineages under a range of redox conditions. This shifts the paradigm that polyphenols stabilize carbon in saturated soils and highlights the need to consider both oxic and anoxic polyphenol metabolisms to understand carbon cycling in changing ecosystems.


Conflict of interest statement

The authors declare no competing interests.

Figures
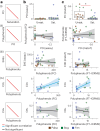
Fig. 1
Fig. 1. Multimethod investigation of the enzyme latch theory.
a, The expected relationships proposed by the enzyme latch theory, with relationships labelled (i)–(iv) as in the text. b,c, The matched observed relationships using ‘Traditional’ assay methods (b) versus ‘omics and high-resolution methods (c). In b(i) and c(i), the lower and upper boxplot edges represent the 25th and 75th percentiles, respectively, and the middle line is the median. The whiskers extend from the median to 1.5× the interquartile range. *P = 0.005848, Wilcoxon rank-sum test. In b(ii)–(iv) and c(ii)–(iv), the linear trendlines for significant Pearson correlations (Benjamini–Hochberg Padj < 0.05) are coloured blue (positive correlation) and red (negative correlation). The shaded regions correspond to the 95% confidence intervals. Water saturation is used as a proxy for oxygen availability, with unsaturated (Unsat.) corresponding to high oxygen, and saturation (Sat.) corresponding to low/no oxygen. Phenol oxidase activity is given by phenol oxidase assay (PO assay, nmol activity g−1 h−1) and the summed metatranscriptome expression of phenol oxidase genes from MAGs in the metatranscriptome (see Methods, PO metaT, geTMM). Polyphenol content is given by Folin–Ciocalteu phenolics (FC polyphenols, mg methyl-gallate equivalents per dry g soil) and polyphenol-like compounds identified in FT-ICRMS (% polyphenols; Supplementary Fig. 11). Extracellular hydrolase enzymes (EHE) are given by beta-glucosidase activity (EHE assay, nmol activity g−1 h−1) and the summed expression of genes encoding glycoside hydrolases from MAGs in the metatranscriptomes (EHE metaT, geTMM). This is representative of relationships observed for other enzyme types (see Supplementary Fig. 3). Porewater CO2 and CH4 are given in concentrations (mM). Individual correlation coefficients, P values and sample sizes are given in Supplementary Data 1.
Fig. 2
Fig. 2. Polyphenol transformations expressed in Stordalen Mire.
a, Hierarchical clustering of the relative metatranscriptome expression of polyphenol transformations across habitats and depths (rows: S, surface; M, middle; D, deep depths). Here, relative metatranscriptome expression is displayed as the z-score of the average of the summed expression (n = 3, geTMM) of genes in each pathway (columns). The saturation column to the right of the heat map denotes samples as saturated (red) if they were at or below the water table depth, or unsaturated (white) if they were above the water table (Supplementary Data 1 and Fig. 2). Hierarchical clustering of pathways revealed palsa (brown), bog (green) and fen (blue) specific transformations, indicated by top-row colour. The oxygen requirements for transformations are shown in the second bottom-most row for oxic (blue) and anoxic (red) transformations. The family of polyphenols that each pathway acts upon is coloured at the bottom-most row: black (polymers), pink shades (monomers) and orange shades (phenolic/benzoic acids). Column numbers correspond to transformations; see Supplementary Data 2 for more detail on each transformation. Transformations mentioned in the text are enclosed in a black box, and the numbers are highlighted black in the heat map to match the text reference, and the reactions are shown in be. Arrow colours correspond to the habitat cluster for the transformation: palsa (brown), bog (green) and fen (blue). In no. 39, the wavy arrow indicates that the hydroxyl radical diffuses away to act on phenolic polymers. All pathways are shown in Supplementary Fig. 6.
Fig. 3
Fig. 3. Polyphenol transformation potential encoded and expressed across Stordalen Mire MAGs.
a, Phylogenetic trees of the 1,864 Stordalen Mire MAGs constructed using the GTDB 120 bacterial and 53 archaeal gene sets, with the Patescibacteria and Micrarchaeota as outgroups, respectively. The inner multicoloured ring corresponds to phylum, with the Patescibacteria (in beige) indicated by an asterisk (*). The middle ring displays a bar chart of the number of polyphenol transformations encoded by each MAG (range 0–40). The outer rings indicate whether a given MAG expressed at least one polyphenol transformation in the palsa, bog or fen metatranscriptomes by the presence of a dot. Clades of ‘polyphenol talented’ genera are highlighted in red, polyphenol dominant genera are highlighted in yellow and genera that meet both definitions are highlighted in orange (bottom left legend). Numbering at clade tips corresponds to genus names in b. b, Plots showing the number of unique polyphenol transformation pathways expressed per genus in each habitat (left), and whether that genus contributed at least 10% of polymer, monomer or phenolic/benzoic acid transformations in any habitat (right). A dashed line at 15 expressed transformations delineates talented genera (Supplementary Fig. 10). Genera that are both talented and dominant are highlighted in orange.
Fig. 4
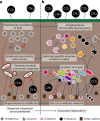
Fig. 4. Conceptual reframing of polyphenols in peatland systems.
a, The enzyme latch model posits that polyphenols can only be degraded by phenol oxidases under oxic conditions. Without oxygen, polyphenols accumulate and generally inhibit the microbial community, subsequently shutting down microbial metabolism, reducing CO2 and CH4 emissions. b, In this study, we propose a polyphenol-cognizant model that accounts for the fact that polyphenols are a diverse group of compounds with diverse metabolic impacts. Microbial communities encode and express multiple substrate-specific enzymes for diverse polyphenols, with strategies under both oxic and anoxic conditions. As a whole, the microbial community exhibits a gradient of responses to polyphenols, ranging from potential inhibition to stimulation. Due to this, polyphenols are integrated into carbon cycling networks, with susceptible organisms, tolerant organisms and stimulated organisms.

References

    1. Hugelius G, et al. Estimated stocks of circumpolar permafrost carbon with quantified uncertainty ranges and identified data gaps. Biogeosciences. 2014;11:6573–6593. doi: 10.5194/bg-11-6573-2014. - DOI
    1. Schuur EAG, et al. Permafrost and climate change: carbon cycle feedbacks from the warming arctic. Annu. Rev. Environ. Resour. 2022;47:343–371. doi: 10.1146/annurev-environ-012220-011847. - DOI
    1. Natali SM, et al. Permafrost carbon feedbacks threaten global climate goals. Proc. Natl Acad. Sci. USA. 2021;118:e2100163118. doi: 10.1073/pnas.2100163118. - DOI - PMC - PubMed
    1. Turetsky MR, et al. Carbon release through abrupt permafrost thaw. Nat. Geosci. 2020;13:138–143. doi: 10.1038/s41561-019-0526-0. - DOI
    1. Woodcroft BJ, et al. Genome-centric view of carbon processing in thawing permafrost. Nature. 2018;560:49–54. doi: 10.1038/s41586-018-0338-1. - DOI - PubMed