. 2024 Jun;30(6):1749-1760.
doi: 10.1038/s41591-024-03010-w. Epub 2024 May 28.

Noninvasive assessment of organ-specific and shared pathways in multi-organ fibrosis using T1 mapping

Affiliations

Noninvasive assessment of organ-specific and shared pathways in multi-organ fibrosis using T1 mapping

Victor Nauffal et al. Nat Med. 2024 Jun.

Abstract

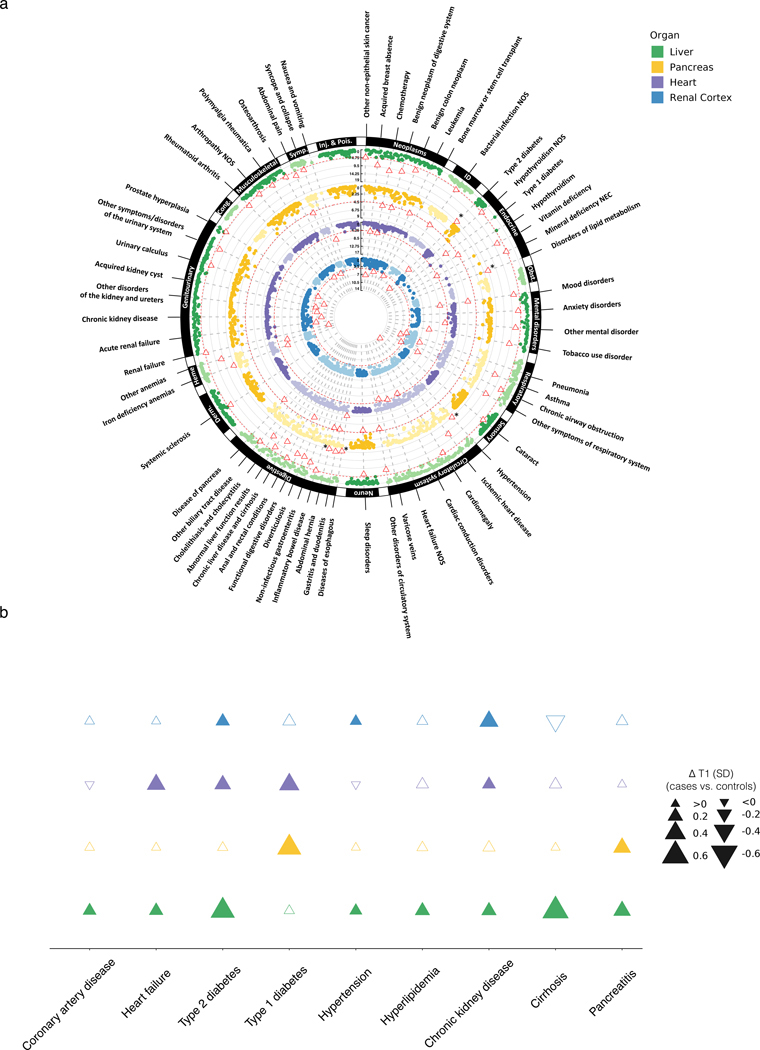
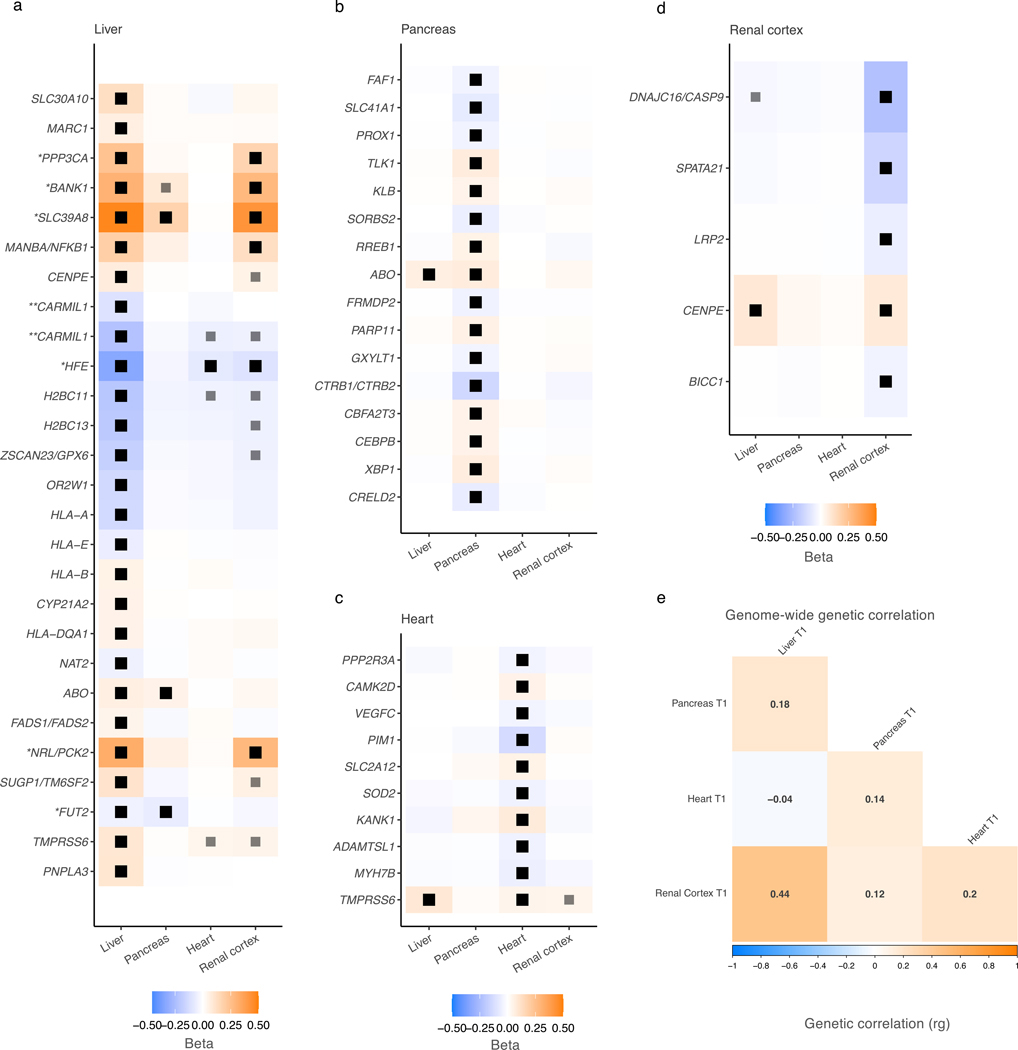
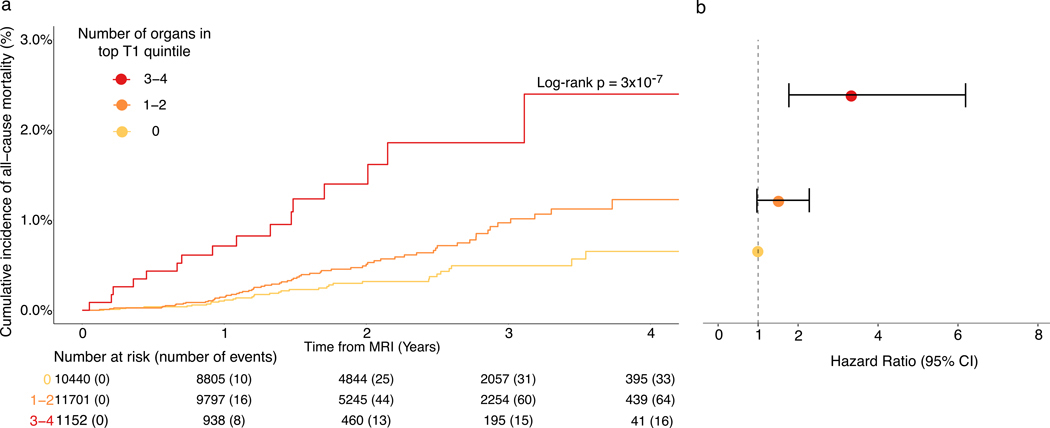
Fibrotic diseases affect multiple organs and are associated with morbidity and mortality. To examine organ-specific and shared biologic mechanisms that underlie fibrosis in different organs, we developed machine learning models to quantify T1 time, a marker of interstitial fibrosis, in the liver, pancreas, heart and kidney among 43,881 UK Biobank participants who underwent magnetic resonance imaging. In phenome-wide association analyses, we demonstrate the association of increased organ-specific T1 time, reflecting increased interstitial fibrosis, with prevalent diseases across multiple organ systems. In genome-wide association analyses, we identified 27, 18, 11 and 10 independent genetic loci associated with liver, pancreas, myocardial and renal cortex T1 time, respectively. There was a modest genetic correlation between the examined organs. Several loci overlapped across the examined organs implicating genes involved in a myriad of biologic pathways including metal ion transport (SLC39A8, HFE and TMPRSS6), glucose metabolism (PCK2), blood group antigens (ABO and FUT2), immune function (BANK1 and PPP3CA), inflammation (NFKB1) and mitosis (CENPE). Finally, we found that an increasing number of organs with T1 time falling in the top quintile was associated with increased mortality in the population. Individuals with a high burden of fibrosis in ≥3 organs had a 3-fold increase in mortality compared to those with a low burden of fibrosis across all examined organs in multivariable-adjusted analysis (hazard ratio = 3.31, 95% confidence interval 1.77-6.19; P = 1.78 × 10⁻⁴). By leveraging machine learning to quantify T1 time across multiple organs at scale, we uncovered new organ-specific and shared biologic pathways underlying fibrosis that may provide therapeutic targets.


Conflict of interest statement

Competing Interests

M.D.R.K., P.D.A, S.F.F. and P.B. are supported by grants from Bayer AG and IBM applying machine learning in cardiovascular disease. P.B. has consulted for Novartis and Prometheus Biosciences. P.B. is now employed by Flagship Pioneering. P.D.A. is now employed by Google. S.A.L. is now employed by Novartis Institutes for Biomedical Research. S.A.L. received sponsored research support from Bristol Myers Squibb / Pfizer, Bayer AG, Boehringer Ingelheim, Fitbit, and IBM, and has consulted for Bristol Myers Squibb / Pfizer, Bayer AG, Blackstone Life Sciences, and Invitae previously. P.T.E. receives sponsored research support from Bayer AG, IBM Research, Bristol Myers Squibb, Pfizer and Novo Nordisk; he has also served on advisory boards or consulted for MyoKardia and Bayer AG. L.-C.W. receives sponsored research support from IBM to the Broad Institute. The remaining authors have no disclosures.

Figures

Figure 1.
Figure 1.. Study flow chart.
Left, machine learning-based segmentation of the myocardial interventricular septum, liver, pancreas and renal cortex from transverse shortened modified Look-Locker inversion recovery (ShMOLLI) T1 maps. Middle, Distribution of measured native T1 time from segmented organs of interest. Higher native T1 time generally reflects a higher burden of fibrosis. Right, Machine learning-derived organ-specific T1 times were examined for organ-specific genetic determinants (upper), and shared genetic determinants (lower). The organ schematics were drawn by using pictures from Servier Medical Art, which were further modified. Servier Medical Art by Servier is licensed under a Creative Commons Attribution (CC BY) 4.0 Unported License (https://creativecommons.org/licenses/by/4.0/). T1 maps shown are reproduced by kind permission of UK Biobank ©.
Figure 2.
Figure 2.. Multi-organ T1 time association with disease.
(a) Circular plot depicting phenome-wide associations of liver, pancreas, heart and renal cortex T1 time. Multiple logistic regression was implemented adjusting for age at magnetic resonance imaging, body mass index, sex and magnetic resonance imaging scanner. Two-sided p-value <4×10⁻⁵ was used to define phenome-wide significant associations after adjusting for multiple testing. The y-axis represents -log10(p-value) for each examined association. The y-axis was curtailed at -log10(p-value)=20 for the liver T1 phenome-wide association results. Associations marked by asterisks (*) reflect associations with p-value <1×10⁻²⁰. Labels on outer spokes represent parent Phecodes with phenome-wide significant associations. Upward-facing triangles reflect an increased odds of disease associated with increased organ-specific T1 time. Downward-facing triangles reflect a decreased odds of disease associated with increased organ-specific T1 time. (b) Multivariable adjusted changes in multi-organ T1 times associated with select diseases. Multiple linear regression was implemented adjusting for age at magnetic resonance imaging, body mass index, sex and magnetic resonance imaging scanner. Triangle colors represent the respective organ T1 times examined as labeled in the legend. Triangle size represents the magnitude of change in T1 time associated with a particular disease as represented in the legend on the right. Two-sided p-value <0.0056 (0.05/9) was used to define statistically significant associations after adjusting for multiple testing. Filled triangles represent associations with two-sided p-value<0.0056 and empty triangles represent associations with two-sided p-value≥0.0056. Derm.: dermatologic, Heme: hematopoietic, ID: infectious diseases, Inj. & Pois.: injuries and poisonings, NEC: not elsewhere classified, Neuro: neurologic, NOS: not otherwise specified, Obst.:obstetrics, Cong.: congenital anomalies, Symp.: symptoms.
Figure 3.
Figure 3.. Multi-organ T1 time genome-wide association results.
(a-d) Manhattan plots depicting genome-wide association results across the 22 autosomes for the investigated organs. Fixed effect multiple linear regression models were implemented. Nearest genes are used for annotation. Bolded gene names reflect novel loci. The dashed line represents the threshold for genome-wide significance (two-sided p-value <5×10⁻⁸ adjusted for multiple testing). (e) Quantile-quantile plots for each organ-specific genome wide-association analysis. Two-sided observed and expected p-values are plotted. Figure 3c depicts previously published genome-wide association results of myocardial T1 time from Nauffal, V., Di Achille, P., Klarqvist, M.D.R. et al. Genetics of myocardial interstitial fibrosis in the human heart and association with disease. Nat Genet 55, 777–786 (2023). https://doi.org/10.1038/s41588-023-01371-5.
Figure 4.
Figure 4.. Genetic correlation of multi-organ T1 time.
(a-d) Association of organ-specific genome-wide significant lead variants within genome-wide significant loci defined by nearest gene with T1 time across multiple organs. Fixed effect multiple linear regression models were implemented. Loci are arranged by increasing chromosome number and chromosome position. Large black rectangles reflect genome-wide significant associations (two-sided p-value <5×10⁻⁸) after adjusting for multiple testing. Small grey rectangles reflect associations with 5×10⁻⁴ < two-sided p-value ≤ 5×10⁻⁸. *Loci with lead variants that overlap across organs or are in high linkage disequilibrium (R2>0.8) are reported once. Lead variants tagging overlapping loci across organs and that are not in high linkage disequilibrium (R2<0.8) are reported separately. ** Two lead SNPs in the liver T1 GWAS nearest to CARMIL1 (rs72826361_C and rs75580845_C) are in linkage equilibrium (R2=0.13) and are hence reported separately (top: rs72826361_C; bottom: rs75580845_C). (e) Genome-wide genetic correlation matrix of T1 time across multiple organs.
Figure 5.
Figure 5.. All-cause mortality stratified by number of organs with T1 time in the top quintile.
(a) Kaplan-Meier plot of all-cause mortality stratified by number of organs (0, 1–2 or 3–4 organs) among the examined organs including liver, pancreas, heart, and kidneys with T1 time in the top quintile. Log-rank test was used to assess the trend of all-cause mortality with increasing burden of multi-organ fibrosis. Two-sided p-value <0.05 was considered statistically significant. (b) Forest plot depicting multivariable adjusted hazard ratio of all-cause mortality associated with increasing number of organs (1–2 [n=11,701] and 3–4 [n=1,152]) with organ-specific T1 time in the top quintile. The referent group (n=10,440) comprised participants with organ-specific T1 times of the liver, pancreas, heart, and kidneys that fell within the lower 80th percentile of the study sample distribution. The dots represent multivariable adjusted hazard ratios and the error bars reflect the associated 95% confidence interval. Multivariable Cox-proportional hazards model was implemented adjusting for age, sex, body mass index, magnetic resonance imaging scanner, coronary artery disease, heart failure, atrial fibrillation, type 1 diabetes mellitus, type 2 diabetes mellitus, hypertension, hyperlipidemia, chronic kidney disease, cirrhosis, pancreatitis, and history of malignancy. Two-sided p-value <0.05 was considered statistically significant.

References

    1. Wynn TA Fibrotic disease and the T(H)1/T(H)2 paradigm. Nat Rev Immunol 4, 583–594 (2004). - PMC - PubMed
    1. Chen Y et al. Aging Reprograms the Hematopoietic-Vascular Niche to Impede Regeneration and Promote Fibrosis. Cell Metab 33, 395–410.e4 (2021). - PubMed
    1. Banerjee R et al. Multiparametric magnetic resonance for the non-invasive diagnosis of liver disease. J Hepatol 60, 69–77 (2014). - PMC - PubMed
    1. Cheng M et al. T1 mapping for the diagnosis of early chronic pancreatitis: correlation with Cambridge classification system. Br J Radiol 94, 20200685 (2021). - PMC - PubMed
    1. Diao K et al. Histologic validation of myocardial fibrosis measured by T1 mapping: a systematic review and meta-analysis. J Cardiovasc Magn Reson 18, 92 (2017). - PMC - PubMed

Methods Only References

    1. Bycroft C et al. The UK Biobank resource with deep phenotyping and genomic data. Nature 562, 203–209 (2018). - PMC - PubMed
    1. Sudlow C et al. UK biobank: an open access resource for identifying the causes of a wide range of complex diseases of middle and old age. PLoS Med 12, e1001779 (2015). - PMC - PubMed
    1. Littlejohns TJ et al. The UK Biobank imaging enhancement of 100,000 participants: rationale, data collection, management and future directions. Nat Commun 11, 2624 (2020). - PMC - PubMed
    1. Petersen SE et al. UK Biobank’s cardiovascular magnetic resonance protocol. J Cardiovasc Magn Reson 18, 8 (2015). - PMC - PubMed
    1. Li CH & Lee CK Minimum cross entropy thresholding. Pattern Recognition 26, 617–625 (1993).