. 2024 Oct;31(10):1580-1588.
doi: 10.1038/s41594-024-01323-5. Epub 2024 May 28.

XPD stalled on cross-linked DNA provides insight into damage verification

Affiliations

XPD stalled on cross-linked DNA provides insight into damage verification

Jochen Kuper et al. Nat Struct Mol Biol. 2024 Oct.

Abstract

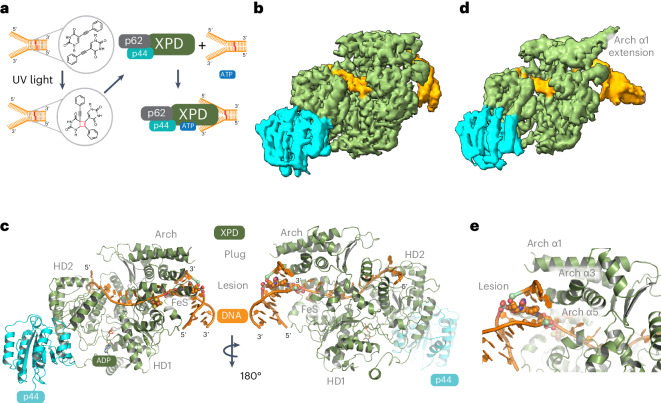
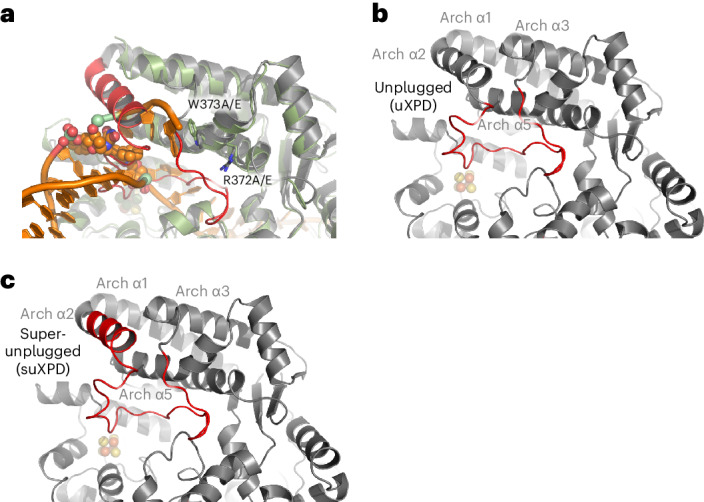
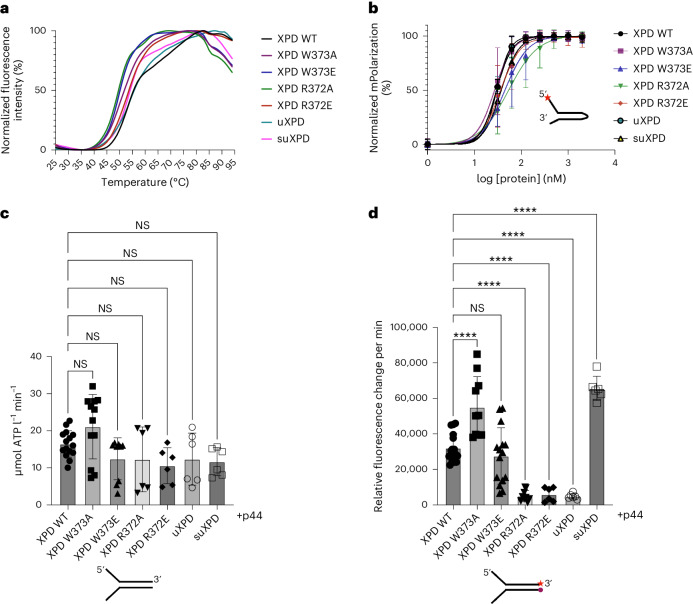
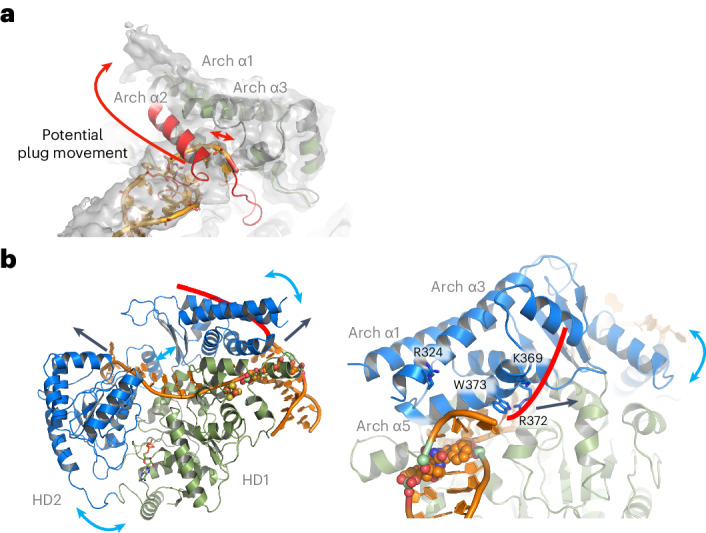
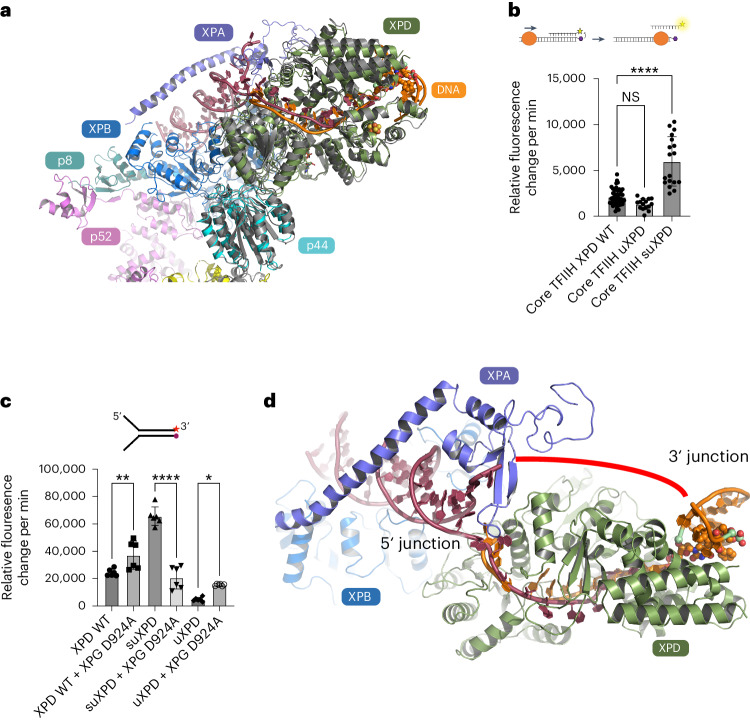
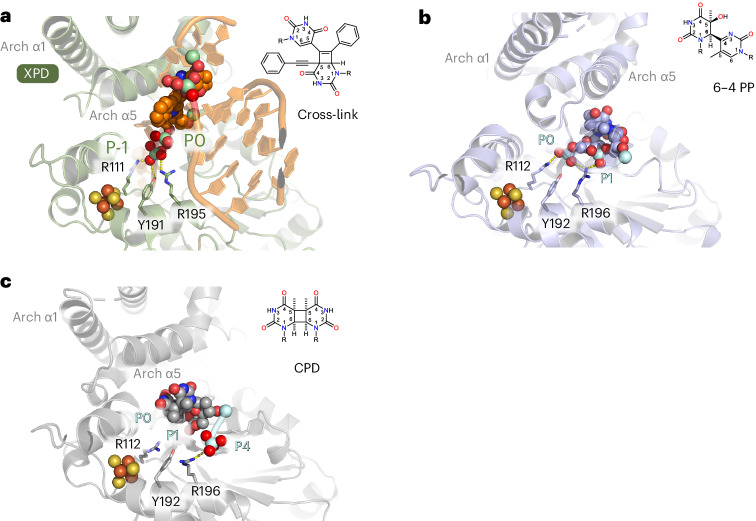
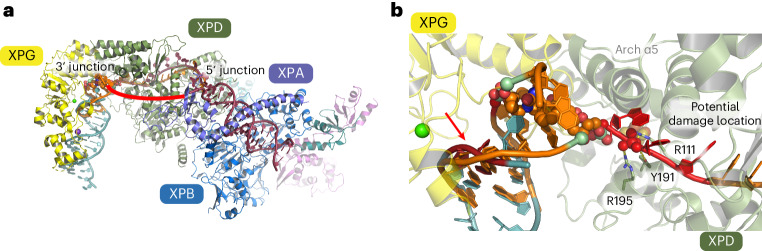
The superfamily 2 helicase XPD is a central component of the general transcription factor II H (TFIIH), which is essential for transcription and nucleotide excision DNA repair (NER). Within these two processes, the helicase function of XPD is vital for NER but not for transcription initiation, where XPD acts only as a scaffold for other factors. Using cryo-EM, we deciphered one of the most enigmatic steps in XPD helicase action: the active separation of double-stranded DNA (dsDNA) and its stalling upon approaching a DNA interstrand cross-link, a highly toxic form of DNA damage. The structure shows how dsDNA is separated and reveals a highly unusual involvement of the Arch domain in active dsDNA separation. Combined with mutagenesis and biochemical analyses, we identified distinct functional regions important for helicase activity. Surprisingly, those areas also affect core TFIIH translocase activity, revealing a yet unencountered function of XPD within the TFIIH scaffold. In summary, our data provide a universal basis for NER bubble formation, XPD damage verification and XPG incision.


Conflict of interest statement

The authors declare no competing interests.

Figures

Fig. 1
Fig. 1. Cryo-EM structure of the XPD complex in the presence of a Y-forked DNA substrate containing an engineered cross-link.
a, Schematic description of sample preparation prior to vitrification. b, Cryo-EM map of the class 1 XPD–p44–DNA complex. XPD is colored in green, p44 is colored in cyan and DNA is colored in orange. c, Left, structural model of the XPD–p44–DNA complex in cartoon representation, color-coded as in b. Right, Rotation (180°) of the model around its y axis. d, Cryo-EM map of the class 2 XPD–p44–DNA complex, color-coded as in b. e, Close-up of the dsDNA–ssDNA junction and the cross-link at the Arch domain of XPD, color-coded as in b. The cross-link is shown as spheres.
Fig. 2
Fig. 2. Structure-based functional mutagenesis.
a, Superposition of the XPD Arch domain in complex with cross-linked DNA and apo XPD (PDB 6NMI) in cartoon representation. Apo XPD is colored in gray with the plug region colored in red; XPD from this work is colored in green. Conserved residues subjected to mutagenesis are shown in stick representation. b, Apo XPD as in a. The loop region that was deleted to create uXPD is shown in red. Four amino acids (S-T-G-S) were inserted to bridge the gap. c, As in b except that suXPD was generated with the additional removal of α2 and the insertion of three residues (S-G-S) to fill the gap.
Fig. 3
Fig. 3. Functional characterization of XPD variants.
a, Normalized thermal unfolding curves of XPD and XPD variants analyzed in this work. Melting points were derived from these curves using GraphPad Prism. b, Binding curves obtained from fluorescence anisotropy experiments using a 5′ overhang hairpin substrate. The curves were fitted using GraphPad Prism, resulting in the KD values given in Extended Data Table 1. Experiments were performed in at least three technical replicates. Mean values are plotted with their associated s.d. The red star marks the Cy3 label. c, ATPase activity of XPD and its variants in the presence of a Y-forked substrate and p44. Experiments were performed in at least three technical replicates and one biological replicate. NS, not significant. d, Helicase activity of XPD and its variants in the presence of a fluorescently labeled Y-forked substrate and p44. The red star denotes the Cy3 label at the 3′ end that is quenched by a Dabcyl moiety at the 5′ end of the complementary strand. Experiments were performed in at least three technical replicates and one biological replicate. Data were analyzed using GraphPad Prism. All values are also listed in Extended Data Table 1. Asterisks indicate significance determined by ordinary one-way analysis of variance (ANOVA) testing in GraphPad Prism. ****P > 0.0001. All error bars represent the s.d. Number of samples: WT XPD, b (n = 10), c (n = 15) and d (n = 16); XPD W373A, b (n = 10), c (n = 12) and d (n = 10); XPD W373E, b (n = 10), c (n = 9) and d (n = 15); XPD R372A, b (n = 10), c (n = 6) and d (n = 9); XPD R372E, b (n = 10), c (n = 6) and d (n = 6); uXPD, b (n = 3), c (n = 6) and d (n = 6); suXPD, b (n = 3), c (n = 6) and d (n = 6). Source data
Fig. 4
Fig. 4. XPD helicase mechanism and plug dynamics.
a, Suggested movement of Arch α2 to elongate Arch α1, explaining the additional density observed in our class 2 data. The long red arrow indicates the motion of the plug, whereas the short red double arrow shows why the movement could be hindered in uXPD. b, Two views of XPD in complex with the cross-linked DNA substrate in cartoon representation. HD2 and the Arch domain are colored in blue and the remainder of XPD is colored in green. DNA is shown in orange. Blue arrows indicate the possible domain movement during ATP hydrolysis and ssDNA translocation. Black arrows indicate the direction of the DNA movement. The red line provides the likely path of the nontranslocated strand along the Arch domain supported by functional data. Left, overview focusing on the ssDNA path. Right, view focusing on the XPD pore entry where the dsDNA is separated.
Fig. 5
Fig. 5. XPD cross-linked structure integrates into core TFIIH.
a, Superposition of the XPD–p44–DNA complex (color-coded as in Fig. 1c) from this work with XPD–p44 (colored in gray) in core TFIIH bound to DNA (PDB 6RO4). The DNA from PDB 6RO4 is colored in dark red. b, Translocase activity of XPD and plug variants in a triplex disruption assay. Experiments were performed in at least three technical replicates and one biological replicate. Data were analyzed using GraphPad Prism. All values are also provided in Extended Data Table 1. c, Helicase activity of XPD and variants in the absence and presence of XPG D924A. Experiments were performed in at least three technical replicates and one biological replicate. Data for uXPD and suXPD were also used in Fig. 3d. Data were analyzed using GraphPad Prism. All values are also provided in Extended Data Table 2. d, Model of the early incision bubble of core TFIIH, color-coded as in a. The XPD structure and orange-colored DNA are from this work, while the remaining structural elements were taken from PDB 6RO4. Both sets of DNA (PDB 6RO4 in firebrick red and our data in orange) combined could form the early bubble. The unresolved part of the DNA is indicated by the red line. Asterisks indicate significance determined by ordinary one-way ANOVA testing in GraphPad Prism. *P > 0.05, **P > 0.005 and ****P > 0.0001. All error bars represent the s.d. Number of samples: b, core WT XPD (n = 47), core TFIIH uXPD (n = 15) and core TFIIH uXPD (n = 18); c, WT XPD (n = 6), WT XPD + XPG D924A (n = 6), suXPD (n = 6), suXPD + XPG D924A (n = 6), uXPD (n = 6) and uXPD + XPG D924A (n = 6). Source data
Fig. 6
Fig. 6. Lesion verification strategies of XPD.
a, Lesion-stalled XPD (green) upon cross-link encounter. XPD and DNA are shown in cartoon mode and the interstrand cross-link lesion is shown as spheres. Relevant backbone phosphate positions relative to the lesion are indicated (P-1 and P0), where P0 marks the first phosphate from the lesion in the 3′ direction. R111, Y191 and R195 from C.thermophilum correspond to R112, Y192 and R196 in human XPD. b, Lesion-stalled XPD (light blue) upon 6–4 PP lesion encounter. XPD and DNA are shown in cartoon mode and the 6–4 PP lesion is shown as spheres. Relevant backbone phosphate positions relative to the lesion are indicated (P0 and P1). c, Lesion-stalled XPD (gray) upon CPD lesion encounter. XPD and DNA are shown in cartoon mode and the CPD lesion is shown as spheres. Relevant backbone phosphate positions relative to the lesion are indicated (P0, P1 and P4). b and c show representative end states of the molecular dynamics simulations from a previous study.
Fig. 7
Fig. 7. Model of the NER incision bubble.
a, Model of the incision bubble of core TFIIH combined with XPG at the 3′ junction based on the superposition of the XPG (yellow) substrate DNA (cyan) complex with the dsDNA of the XPD–p44–DNA complex modeled in core TFIIH, color-coded as in Fig. 5d. b, Close-up of a, indicating a possible incision site (red arrow) and location of the canonical damage (dark-red DNA backbone). Note that the cross-link forces the DNA to be closed at the potential incision site. Non-interstrand cross-linked damaged DNA could already be separated at that position.
Extended Data Fig. 1
Extended Data Fig. 1. Workflow of cryo EM data processing.
a) Representative micrograph of the XPD complex/DNA sample revealing the single particles to be evenly distributed, n = 24603. The white scalebar represents 50 nm. b) Reference free 2D class averages obtained with CryoSPARC. The selected classes have been obtained from the initial round of template based particle picking and represent 3.784,237 particles. c) Schematic workflow of data processing in CryoSPARC. All employed steps are indicated.
Extended Data Fig. 2
Extended Data Fig. 2. Map quality of the resulting cryo EM maps.
a, c) GSFSC (for details see methods section) and 3DFSC correlation plots for class 1 (a) and class 2 (c) indicating the resolution limits and anisotropy of the data, respectively. a) Contains in addition a model vs map FSC analysis generated with the PHENIX package. b, d) Local resolution maps of class 1 (b) and class 2 (d) cryo EM maps. e) Density of the DNA substrate. Gray density represents the map plotted with 10 sigma, light gray density represents lower resolution data of the same map plotted at 5 sigma. The map carving radius around objects was set to 5 Å. The DNA is shown in cartoon mode. f) Density for ADP plotted at 10 sigma. ADP is shown in stick mode, whereas the protein is drawn as cartoon.
Extended Data Fig. 3
Extended Data Fig. 3. Overview of XPD architecture.
The XPD crosslink DNA structure is shown in cartoon representation. Structural elements are highlighted and color coded. Left panel: Front view of XPD. Right panel: left panel rotated 180° around the y-axis. Abbreviations are as follows, arch= XPD Arch domain, HD1 and HD2= helicase motor domains 1 and 2, FeS= XPD iron sulfur cluster domain.
Extended Data Fig. 4
Extended Data Fig. 4. Helicase activity of XPD variants.
DNA dependent XPD/p44 helicase activity. DNA was used in a concentration range from 500- 31.25 nM with 1:1 dilutions. Curves were fitted with GraphPad Prism and represent the averages of at least three technical replicates and one biological replicate. Mean values are plotted with their associated SD N values for samples: XPD wild type n = 16, XPD W373A n = 10, XPD W373E n = 15, XPD R372A n = 10, XPD R372E n = 6, uXPD n = 6, suXPD n = 6. Source data
Extended Data Fig. 5
Extended Data Fig. 5. FeS containing helicases.
Superposition of the structure obtained in this work with AlphaFold models of a) FANCJ (colored in salmon), b) DDX11 (colored in cyan), and c) RTEL1 (colored in pink). All models are shown as cartoon. All proteins contain an Arch domain suggesting a conserved mode to unwind DNA.
Extended Data Fig. 6
Extended Data Fig. 6. Hypothetical lesion recognition model for canonical and non canonical lesions.
The figure shows possible lesion recognition strategies for non canonical and canonical NER lesions. Upper panel: When XPD encounters a non canonical crosslink no lesion locking occurs and XPD backtracking can take place. Backtracking pulls XPG across the lesion enabling cutting 5′ to the lesion. Lower panel: canonical lesion encounter enables XPD lesion locking and XPG cutting 3′ to the damage as observed in regular NER.

References

    1. Hoeijmakers, J. H. Genome maintenance mechanisms for preventing cancer. Nature411, 366–374 (2001). - PubMed
    1. Gillet, L. C. & Scharer, O. D. Molecular mechanisms of mammalian global genome nucleotide excision repair. Chem. Rev.106, 253–276 (2006). - PubMed
    1. Scharer, O. D. Chemistry and biology of DNA repair. Angew. Chem. Int. Ed. Engl.42, 2946–2974 (2003). - PubMed
    1. Scharer, O. D. Nucleotide excision repair in eukaryotes. Cold Spring Harb. Perspect. Biol.5, a012609 (2013). - PMC - PubMed
    1. Tsutakawa, S. E. et al. Envisioning how the prototypic molecular machine TFIIH functions in transcription initiation and DNA repair. DNA Repair (Amst.)96, 102972 (2020). - PMC - PubMed

MeSH terms

LinkOut - more resources