. 2024 Jul;25(7):1257-1269.
doi: 10.1038/s41590-024-01859-0. Epub 2024 May 28.

Circadian control of tumor immunosuppression affects efficacy of immune checkpoint blockade

Affiliations

Circadian control of tumor immunosuppression affects efficacy of immune checkpoint blockade

Bridget M Fortin et al. Nat Immunol. 2024 Jul.

Abstract

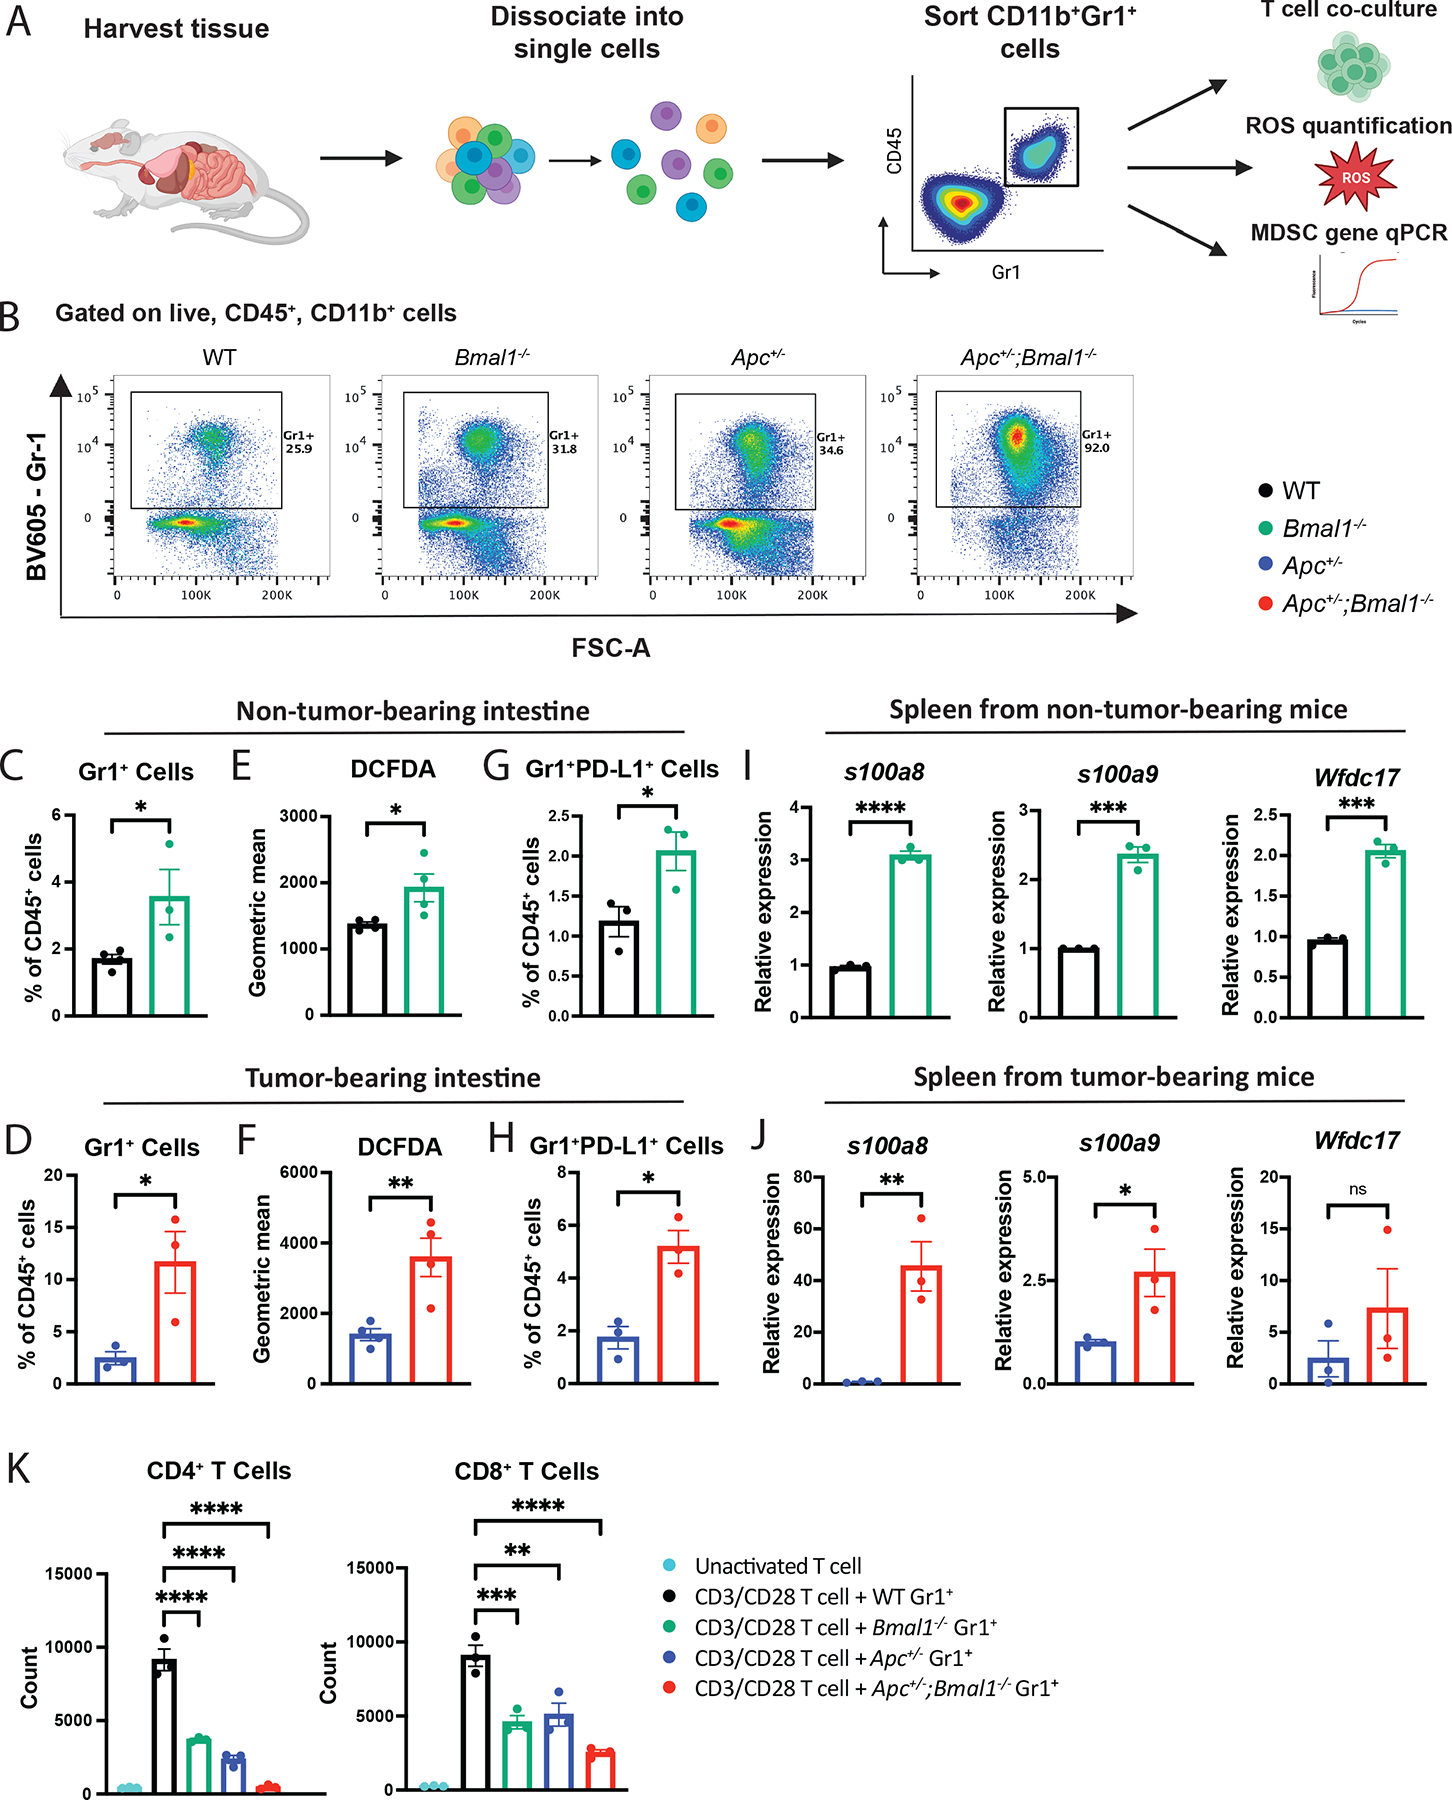
The circadian clock is a critical regulator of immunity, and this circadian control of immune modulation has an essential function in host defense and tumor immunosurveillance. Here we use a single-cell RNA sequencing approach and a genetic model of colorectal cancer to identify clock-dependent changes to the immune landscape that control the abundance of immunosuppressive cells and consequent suppression of cytotoxic CD8+ T cells. Of these immunosuppressive cell types, PD-L1-expressing myeloid-derived suppressor cells (MDSCs) peak in abundance in a rhythmic manner. Disruption of the epithelial cell clock regulates the secretion of cytokines that promote heightened inflammation, recruitment of neutrophils and the subsequent development of MDSCs. We also show that time-of-day anti-PD-L1 delivery is most effective when synchronized with the abundance of immunosuppressive MDSCs. Collectively, these data indicate that circadian gating of tumor immunosuppression informs the timing and efficacy of immune checkpoint inhibitors.


Conflict of interest statement

Competing Interests Statement:

The authors declare no competing financial interests.

Figures

Fig. 1.
Fig. 1.. Circadian clock disruption alters the immune landscape.
(A) Schematic depicting the workflow for scRNA-seq of live, CD45+ immune cells sorted from mouse small intestine isolated at ZT 4. (B) UMAP of cell types clustered by single-cell transcriptional analysis (n=15,234 cells, n= 3 mice/genotype). (C) UMAP of cell types clustered by single-cell transcriptional analysis broken down by mouse genotype WT, Bmal1−/−, Apc+/−, and Apc+/−;Bmal1−/−. (D) Immune cell composition by genotype from WT, Bmal1−/−, Apc+/−, and Apc+/−;Bmal1−/− mice. (E) Pie chart of neutrophils, CD8+ T cells, monocytes/macrophages, and CD4+ T cells from WT, Bmal1−/−, Apc+/−, and Apc+/−;Bmal1−/− mice.
Fig. 2.
Fig. 2.. Genetic and environmental clock disruption alter the immune landscape.
(A) Neutrophils, monocytes, macrophages, and CD8+ T cells shown as percent of CD45+ cells from the small intestine of WT and Bmal1−/− mice sacrificed at ZT 4 and analyzed by flow cytometry (n=7 mice/genotype). (B) Neutrophils, monocytes, macrophages, and CD8+ T cells shown as percent of CD45+ cells from the small intestine of Apc+/− and Apc+/−;Bmal1−/− mice sacrificed at ZT 4 and analyzed by flow cytometry (n=7 mice/genotype). (C) Schematic of environmental shift disruption (SD) paradigm in WT mice performed for 8 weeks. Light versus dark schedule is shown for 5 days. (D) Neutrophils, monocytes, macrophages, and CD8+ T cells shown as percent of CD45+ cells from the small intestine of WT mice subjected to 12:12 light/dark (LD) versus SD paradigm. Mice were sacrificed at ZT 4 and analyzed by flow cytometry (n=8 mice/genotype). (E) Representative proportions of neutrophils and monocytes in the small intestine of WT mice subjected to 12:12 LD paradigm versus 1 week SD, 3 weeks SD, and 5 weeks SD. (F) Neutrophils, monocytes, macrophages, and CD8+ T cells shown as percent of CD45+ cells from the small intestine of WT mice subjected to 12:12 LD paradigm versus 1 week SD, 3 weeks SD, and 5 weeks SD. Mice were sacrificed at ZT 4 and analyzed by flow cytometry (n=6 mice/genotype). Data represent the mean ± SEM and statistical significance was determined by two-tailed Mann-Whitney T-test for A, B, and D, and one-way ANOVA with Tukey’s multiple comparison test for F. Asterisks represent p-values from multiple comparisons, with * indicating a p-value of < 0.05, ** indicating a p-value of < 0.01, *** indicating a p-value of < 0.001, and ns = not significant.
Fig. 3.
Fig. 3.. Disruption of the circadian clock promotes the accumulation of MDSCs.
(A) Schematic depicting workflow for MDSC assays including T cell co-culture and proliferation, reactive oxygen species (ROS) quantification, and MDSC qPCR from live, CD45+CD11b+Gr1+ sorted cells. (B) Representative percent of Gr1+ cells after gating for live, CD45+CD11b+ cells from WT, Bmal1−/−, Apc+/−, and Apc+/−;Bmal1−/− small intestine using flow cytometry. (C-D) Quantification of Gr1+ cells as percent of CD45+ cells from WT, Bmal1−/−, Apc+/−, and Apc+/−;Bmal1−/− small intestine sacrificed at ZT 4 and analyzed by flow cytometry (n=3 mice/genotype). (E-F) Geometric mean of DCFDA from WT, Bmal1−/−, Apc+/−, and Apc+/−;Bmal1−/− small intestine sacrificed at ZT 4 and analyzed by flow cytometry (n=4 mice/genotype). (G-H) Gr1+PD-L1+ cells shown as percent of CD45+ cells from WT, Bmal1−/−, Apc+/−, and Apc+/−;Bmal1−/− small intestine sacrificed at ZT 4 and analyzed by flow cytometry (n=3 mice/genotype). (I-J) Expression of s100a8, s100a9, and Wfdc17 as determined by qPCR using splenic Gr1+ sorted cells from WT, Bmal1−/−, Apc+/−, and Apc+/−;Bmal1−/− mice sacrificed at ZT 4 (n=3 mice/genotype). (K) Bar graph of CD4+ and CD8+ T cell counts measured by FACS quantification in inactivated T cells or CD3/CD28 activated T cells with a 1:1 ratio of CD11b+Gr1+ cells from WT, Bmal1−/−, Apc+/− and Apc+/−;Bmal1−/− spleen (n=3 mice/genotype). Data represent the mean ± SEM. Statistical significance was determined by two-tailed Mann-Whitney T-test for C-J, and one-way ANOVA with Tukey’s multiple comparison for K. Asterisks represent p-values from multiple comparisons, with * indicating a p-value of < 0.05, ** indicating a p-value of < 0.01, *** indicating a p-value of < 0.001, **** a p-value of < 0.0001, and ns = not significant.
Fig. 4.
Fig. 4.. Circadian clock disruption and Wnt signaling promote an inflammatory response.
(A) Western blot of MYC and p84 in WT and Bmal1−/− intestinal organoids untreated or treated with 100 ng/mL recombinant Wnt3a for 72 hours. (B) Expression of c-Myc, Survivin, and Cxcl5 determined by qPCR using WT and Bmal1−/− primary intestinal monolayers untreated or treated with 100 ng/mL recombinant Wnt3a for 72 or 96 hours. (n=5 independent monolayer lines/genotype). (C) Proposed model of normal versus clock disrupted/Wnt activated intestinal epithelium. (D) Concentration of secreted IL-5, CCL5, IL-17, and CXCL9 in CM from WT and Bmal1−/− intestinal monolayers determined by ELISA (n=3 independent monolayer lines/genotype). (E) WT intestinal monolayers were untreated or treated with 100 ng/mL recombinant Wnt3a for 96 hours (n=3 untreated, n=5 Wnt3a-treated independent monolayer lines/genotype). Concentration of secreted CXCL1, G-CSF, GM-CSF, CCL2, VEGF, and TNF⍺ was determined by ELISA. (F) WT and Bmal1−/− intestinal monolayers were untreated or treated with 100 ng/mL recombinant Wnt3a for 96 hours (n=3 untreated, n=4 Wnt3a-treated independent monolayer lines/genotype). Concentration of secreted CXCL5 was determined by ELISA. (G) Clock-dependent, Wnt-dependent, and both clock- and Wnt-dependent cytokines determined by ELISA. (H) Gene expression of s100a9, s100a8, Wfdc17, and Arg2 determined by qPCR of naïve neutrophils cultured with WT and Bmal1−/− intestinal monolayers CM (n=6 independent monolayer lines/genotype). (I) Neutrophil migration toward WT and Bmal1−/− intestinal monolayers CM (n=6 independent monolayer lines/genotype). Data represent the mean ± SEM. Statistical significance was determined by two-tailed Mann-Whitney T-test for D-E and I, and one-way ANOVA with Tukey’s multiple comparison for B, F, and H. Asterisks represent p-values from multiple comparisons, with * indicating a p-value of < 0.05, ** indicating a p-value of < 0.01, *** indicating a p-value of < 0.001, **** a p-value of < 0.0001, and ns = not significant.
Fig. 5.
Fig. 5.. Time-of-day anti-PD-L1 treatment determines efficacy.
(A-B) Small intestinal Gr1+ or Gr1+PD-L1+ cells as percent of CD45+ cells from WT and Apc+/−;Bmal1−/− mice (n=5 mice/group for A and 8 mice/group for B). (C-D) Splenic Gr1+ or Gr1+PD-L1+ cells as percent of CD45+ cells from WT and Apc+/−;Bmal1−/− mice (n=5 mice/genotype for C, n=7 mice/genotype for D). For A-D, animals were sacrificed at ZT 4 and ZT 16 and analyzed by flow cytometry. (E) Graphical schematic of anti-PD-L1 administration experiment at two circadian time points. (F) Spleen weight of Apc+/−;Bmal1−/− mice untreated or treated with anti-PD-L1 at ZT 4 or ZT 16 (n=5 mice/group). (G-H) Small intestinal Gr1+ cells or CD8+ T cells as percent of CD45+ cells from Apc+/−;Bmal1−/− mice untreated or treated with anti-PD-L1 at ZT 4 or ZT 16 and analyzed by flow cytometry (n=6 mice/group). (I) Small intestinal polyp size from Apc+/−;Bmal1−/− mice untreated or treated with anti-PD-L1 at ZT 4 or ZT 16 (n=70 polyps/group). (J) Tumor volume over time for WT mice after subcutaneous injection of MC38 cells and treatment with IgG or anti-PD-L1 at ZT 4 or ZT 16 (n=7 mice/group). (K) Tumor volume of WT mice 21 days after subcutaneous injection of MC38 cells and treatment with IgG or anti-PD-L1 at ZT 4 or ZT 16 (n=7 mice/group, 2 tumors/mouse). (L) Tumor volume of WT mice 18 days after subcutaneous injection of CMT167 cells and treatment with IgG or anti-PD-L1 at ZT 4 or ZT 16 (n=5 mice/group, 2 tumors/mouse). (M) Tumor volume of WT mice 12 days after subcutaneous injection of D4M-S cells and treatment with IgG or anti-PD-L1 at ZT 4 or ZT 16 (n=5 mice/group, 2 tumors/mouse). Data represent the mean ± SEM. Statistical significance was determined by two-tailed Mann-Whitney T-test for A-D, one-way ANOVA with Tukey’s multiple comparison for F-I and K-M, and two-way ANOVA with Tukey’s multiple comparison for J. Asterisks represent p-values from multiple comparisons, with * indicating a p-value of < 0.05, ** indicating a p-value of < 0.01, *** indicating a p-value of < 0.001, **** indicating a p-value of < 0.0001, and ns = not significant.
Fig. 6.
Fig. 6.. Model depicting circadian regulation of MDSCs for anti-PD-L1 treatment.
MDSC abundance and PD-L1 expression is regulated by the circadian clock with a peak during the early active phase. By treating with anti-PD-L1 during the early active phase, when PD-L1 expressing MDSCs are most abundant, immune infiltration is stimulated and tumor growth is inhibited. Figure created using biorender.com.

References

    1. Bailey CE et al. Increasing disparities in the age-related incidences of colon and rectal cancers in the United States, 1975–2010. JAMA Surgery 150, 17–22 (2015). - PMC - PubMed
    1. Ben-Aharon I et al. Early-Onset Cancer in the Gastrointestinal Tract Is on the Rise—Evidence and Implications. Cancer Discovery 13, 538–551 (2023). - PubMed
    1. Sinicrope FA Increasing Incidence of Early-Onset Colorectal Cancer. New England Journal of Medicine 386, 1547–1558 (2022). - PubMed
    1. Siegel RL, Miller KD, Wagle NS & Jemal A Cancer statistics, 2023. CA: A Cancer Journal for Clinicians 73, 17–48 (2023). - PubMed
    1. Tsalic M, Bar-Sela G, Beny A, Visel B & Haim N Severe Toxicity Related to the 5-Fluorouracil/Leucovorin Combination (The Mayo Clinic Regimen): A Prospective Study in Colorectal Cancer Patients. American Journal of Clinical Oncology 26, 103 (2003). - PubMed

MeSH terms