. 2024 Jul;25(7):1296-1305.
doi: 10.1038/s41590-024-01857-2. Epub 2024 May 28.

Nociceptor-immune interactomes reveal insult-specific immune signatures of pain

Affiliations

Nociceptor-immune interactomes reveal insult-specific immune signatures of pain

Aakanksha Jain et al. Nat Immunol. 2024 Jul.

Abstract

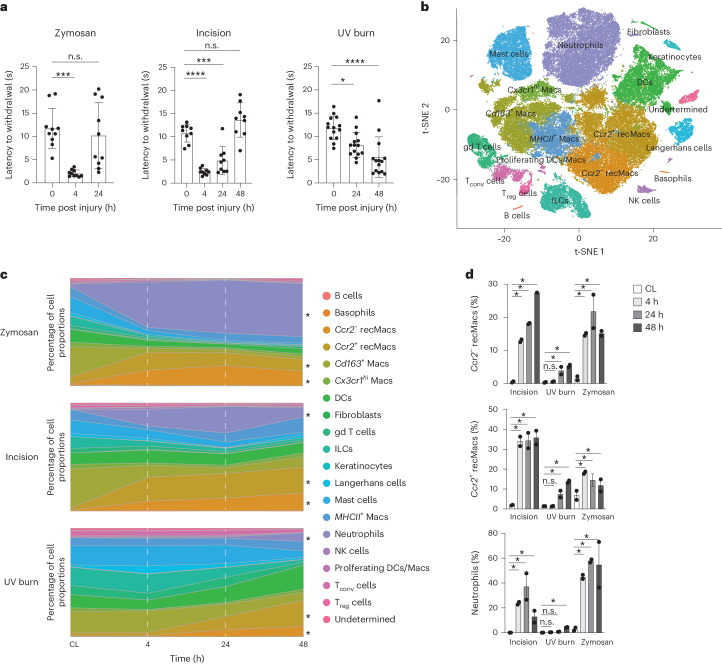
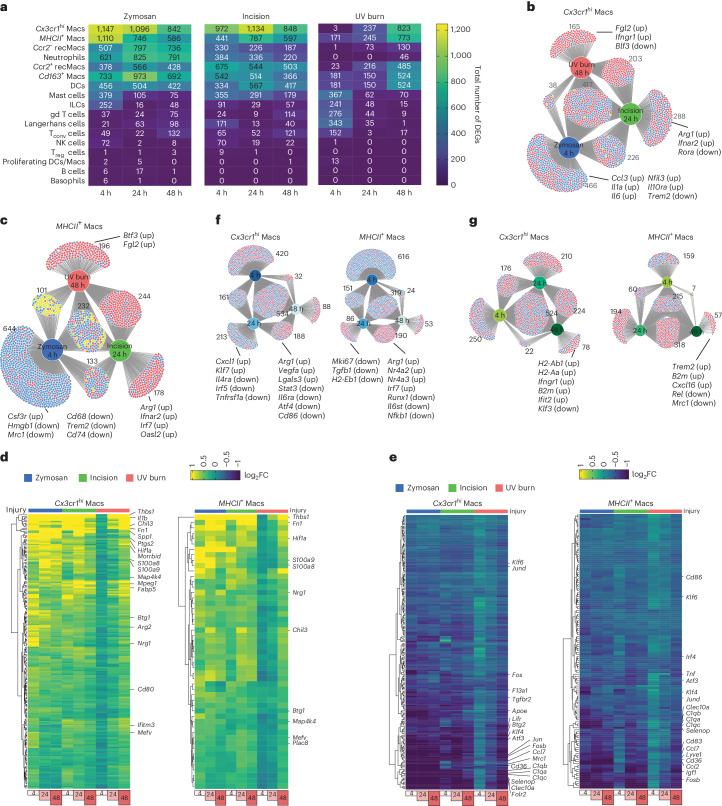
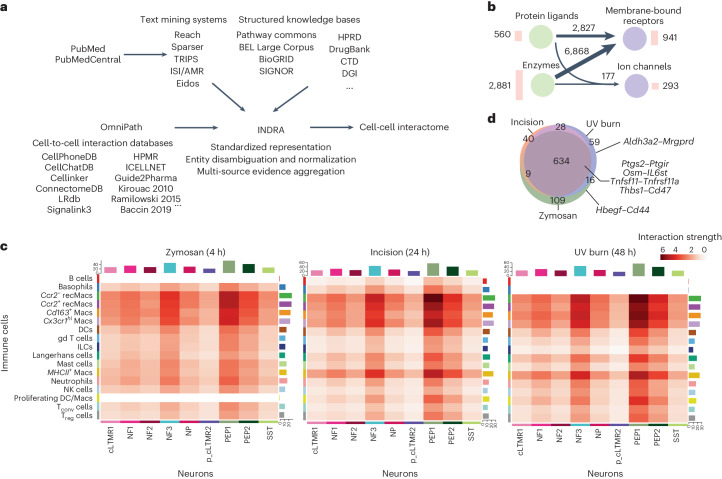
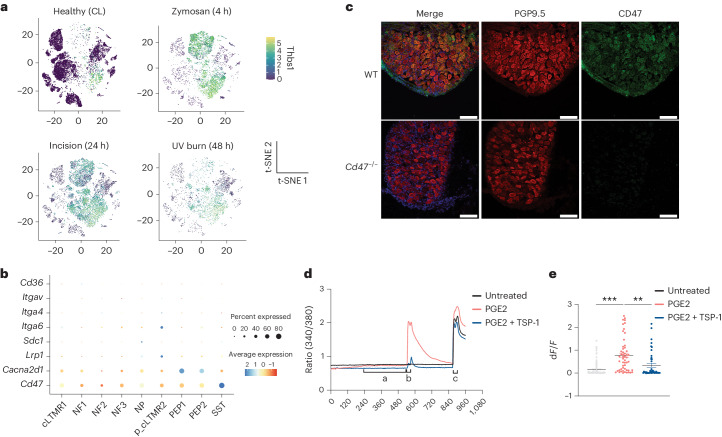
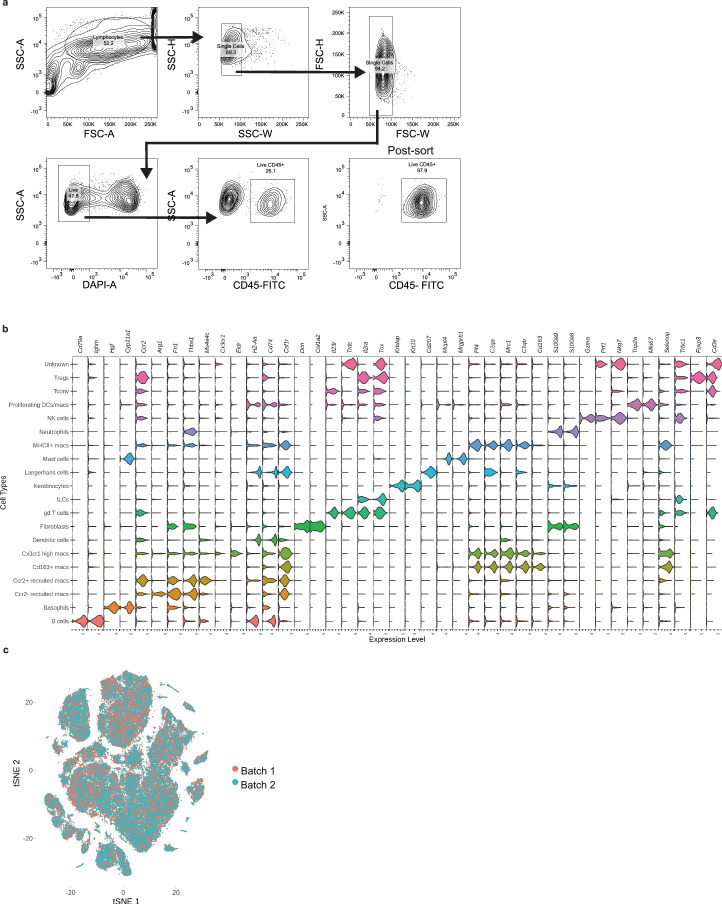
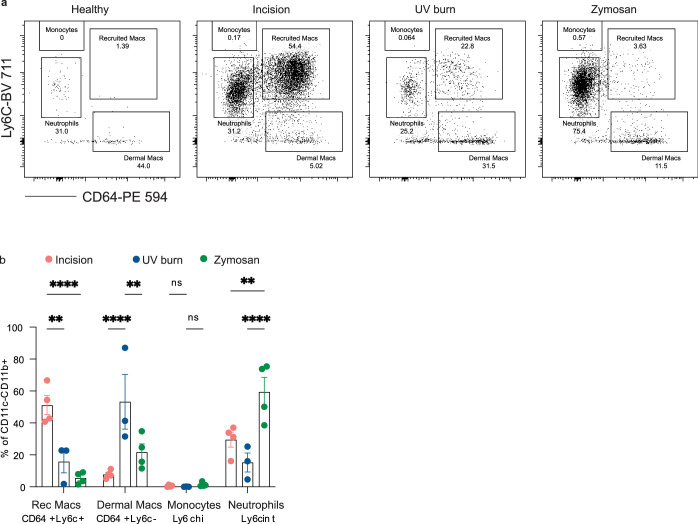
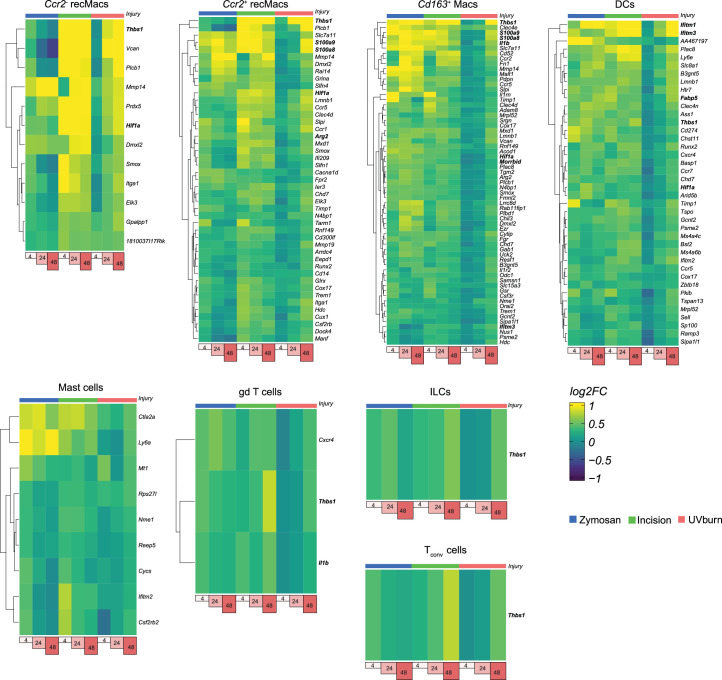
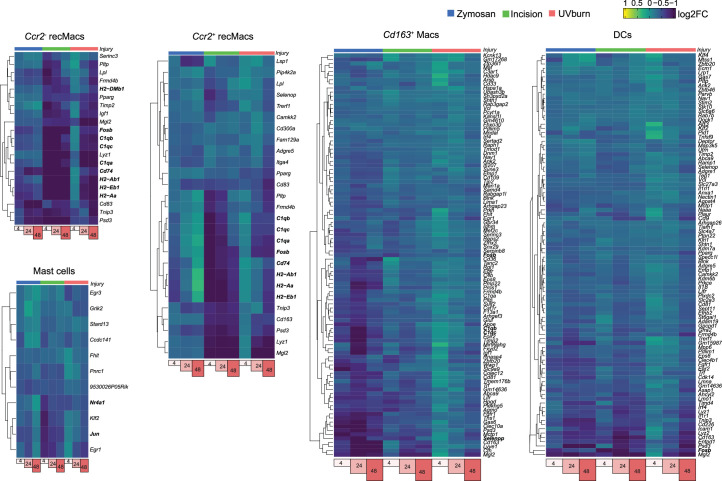
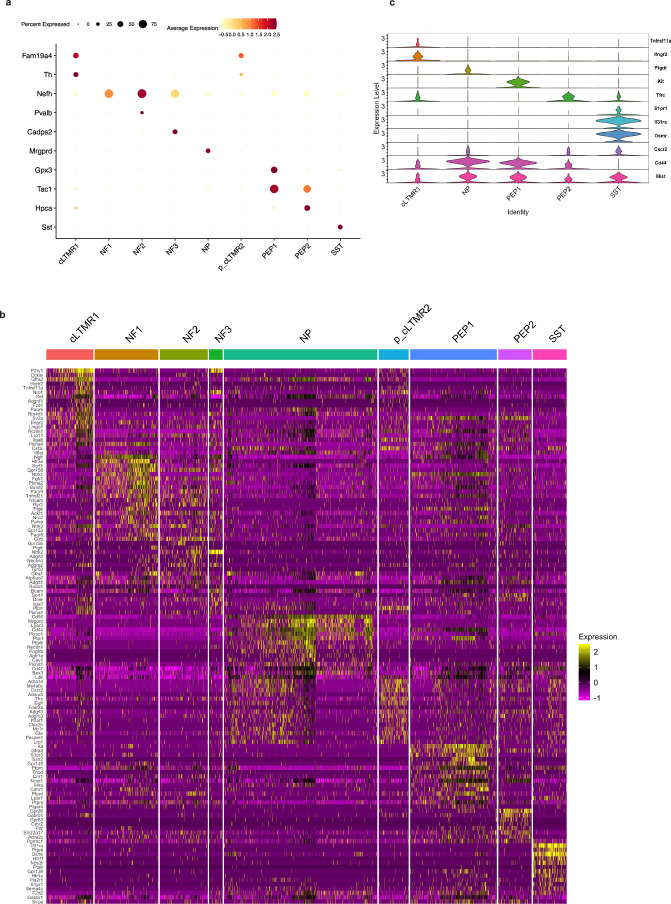
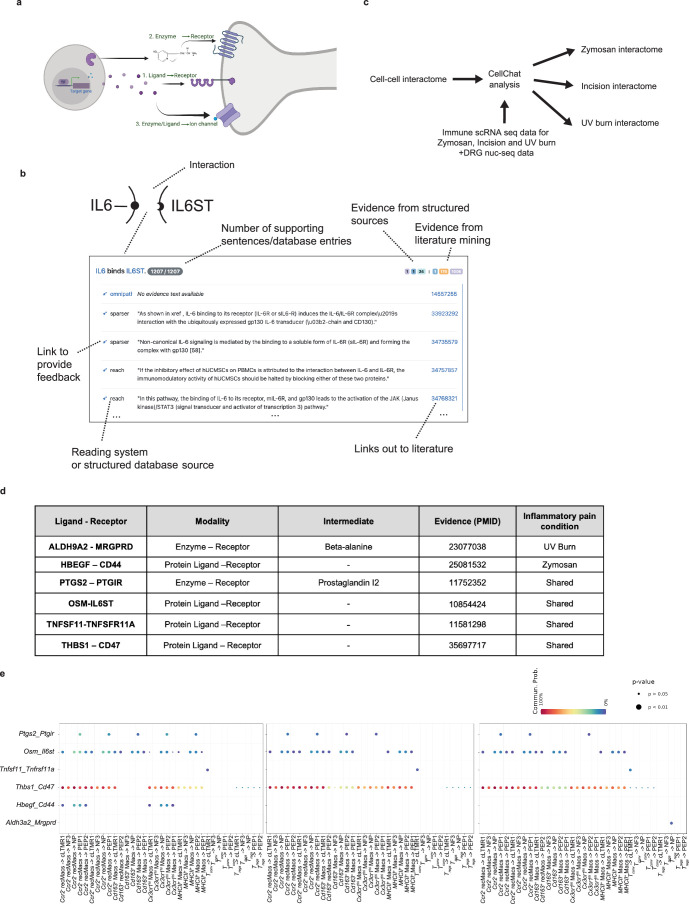
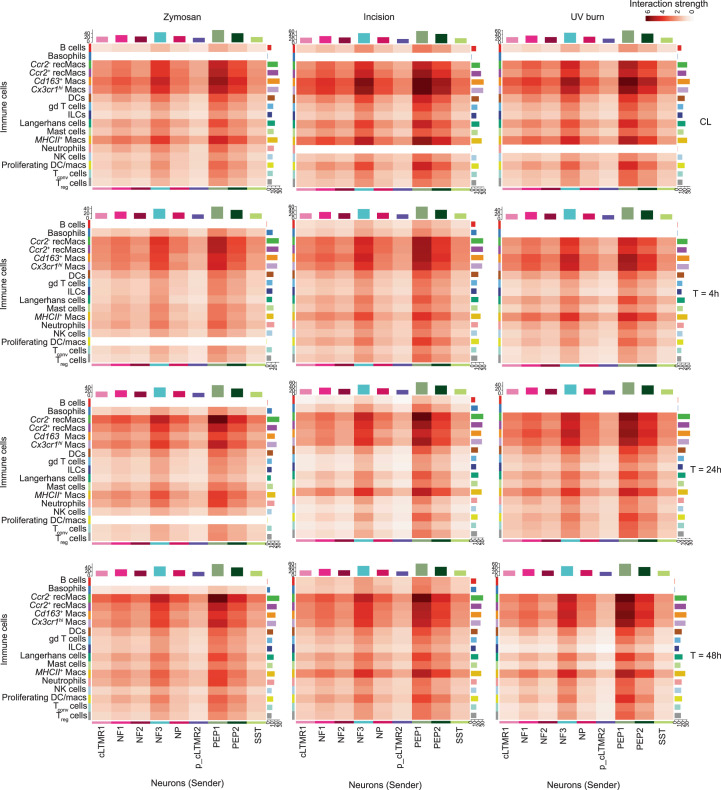
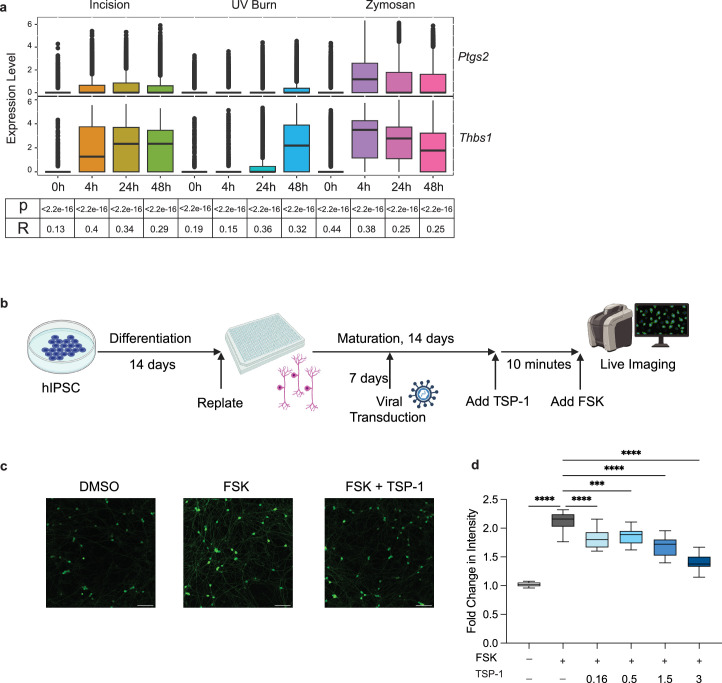
Inflammatory pain results from the heightened sensitivity and reduced threshold of nociceptor sensory neurons due to exposure to inflammatory mediators. However, the cellular and transcriptional diversity of immune cell and sensory neuron types makes it challenging to decipher the immune mechanisms underlying pain. Here we used single-cell transcriptomics to determine the immune gene signatures associated with pain development in three skin inflammatory pain models in mice: zymosan injection, skin incision and ultraviolet burn. We found that macrophage and neutrophil recruitment closely mirrored the kinetics of pain development and identified cell-type-specific transcriptional programs associated with pain and its resolution. Using a comprehensive list of potential interactions mediated by receptors, ligands, ion channels and metabolites to generate injury-specific neuroimmune interactomes, we also uncovered that thrombospondin-1 upregulated by immune cells upon injury inhibited nociceptor sensitization. This study lays the groundwork for identifying the neuroimmune axes that modulate pain in diverse disease contexts.


Conflict of interest statement

C.J.W. is a founder of Nocion Therapeutics, Quralis and Blackbox Bio, an SAB member of Lundbeck, Axonis and Tafalgie Therapeutics, and a consultant for GSK. P.K.S. is a member of the Board of Directors of Glencoe Software and Applied Biomath, a member of the SAB for RareCyte, NanoString and Montai Health, and a consultant for Merck. The remaining authors declare no competing interests.

Figures

Fig. 1
Fig. 1. Kinetics of immune infiltration correlate with pain development.
a, Heat hypersensitivity in inflamed paws measured by the latency to react in the Hargreaves assay before and 4, 24 and 48 h after zymosan injection (n = 9, male 4, female 5), incision (n = 9, male 4, female 5), UV burn (n = 14, male 5, female 9) in the paws of wild-type (WT) mice. Data are represented as mean value ± s.e.m. P values calculated using one-way ANOVA, Tukey’s multiple comparison test; 8–12-week-old mice were used. b, t-SNE plot of scRNA-seq data of hematopoietic CD45+ cells-enriched skin from WT mice integrated from all samples. This comprises zymosan injection, incision and UV burn at 4 h, 24 h and 48 h post-injury and control skin from the CL paws at 4 h (zymosan), 24 h (incision) and 48 h (UV burn). c, Stacked area plot of mean proportions of immune cell types at 4 h, 24 h and 48 h in zymosan injection, incision and UV burn and CL healthy skin as in b. Ccr2 recMacs, Ccr2+ recMacs and neutrophils were significantly changed following injury and are marked with an asterisk. d, Proportions of Ccr2 recMacs, Ccr2+ recMacs and neutrophils at 4 h, 24 h and 48 h in zymosan, incision and UV burn injury. *Significant change in cell proportions compared to CL based on scCODA analysis. n.s., no statistically significant change in proportions of the cell type based on scCODA analysis (Methods).
Fig. 2
Fig. 2. Macrophage transcriptional changes mirror pain hypersensitivity.
a, Heatmaps showing the total number of differentially expressed genes (upregulated and downregulated combined) compared to CL in each immune cell type. For differentially expressed genes (DEGs), log2FC threshold of 0.25 and min.pct of 0.1 was applied. b,c, DiVenn plots showing the overlap of DEGs in different injuries at Tmax (zymosan at 4 h, incision at 24 h and UV burn at 48 h) compared to CL in Cx3cr1hi Macs (b) and MHCII+ Macs (c). d,e, Heatmaps showing the log2FC of the upregulated DEGs common in zymosan at 4 h, incision at 24 h and UV burn at 48 h compared to CL controls in Cx3cr1hi Macs (d) and MHCII+ Macs (e). f, DiVenn plots showing the overlap of DEGs in zymosan at different time points of 4 h, 24 h and 48 h compared to CL in Cx3cr1hi Macs and MHCII+ Macs. g, DiVenn plots showing the overlap of DEGs in incision at different time points of 4 h, 24 h and 48 h compared to CL in Cx3cr1hi Macs and MHCII+ Macs. In b, g and h, the red circle denotes upregulated, the blue circles denote downregulated and the yellow circle denotes divergent regulated genes.
Fig. 3
Fig. 3. DRG neurons have subtype-specific receptor expression profiles.
FindMarker analysis of receptor genes expressed by sensory neurons isolated from DRG in female mice based on snRNA-seq data, from ref. . Heatmaps show significantly (adjusted P < 0.05) differentially expressed receptor genes in neurons with log2FC of 0.5 and min.pct of 0.25.
Fig. 4
Fig. 4. Macrophages are the strongest interactors of sensory neurons.
a, An overview of the computational pipeline in which INDRA processes publications through multiple text mining systems and combines their output with structured knowledge bases integrated with INDRA directly, as well as the content of cell-to-cell interaction databases obtained via OmniPath to create an assembled cell–cell interactome. b, Summary of the modalities of the interactome derived from INDRA. Circles represent types of proteins: ligands, enzymes, membrane-bound receptors and ion channels. Numbers next to the circle represent protein types in the interactome. Arrows between circles show the number of distinct interactions among the corresponding protein type, with thicker arrows corresponding to a larger number of interactions. c, A heatmap of the interaction strength between immune cells (senders) and neurons (receivers) calculated for zymosan, incision and UV burn at Tmax. Color saturation represents the communication probability between the senders and receivers calculated by CellChat. d, Venn diagram depicting the number of shared and unique significant neuroimmune interactions for zymosan, incision and UV burn at Tmax.
Fig. 5
Fig. 5. TSP-1 inhibits PGE2-mediated nociceptor sensitization.
a, t-SNE plot of normalized Thbs1 expression in immune cells from healthy (CL) and inflamed skin following zymosan, incision and UV burn injury at Tmax. b, Dot plot showing the expression of TSP-1 receptors (Cd47, Cacna2d1, Lrp1, Sdc1, Itga6, Itga4, Itgav and Cd36) in DRG neuron subtypes (cLTMR1, NF1, NF2, NF3, NP, p_cLTMR2, PEP1 and PEP2) in wild-type (WT) healthy mouse lumbar DRG. c, The expression of CD47 on frozen wild-type or Cd47−/− DRG neuron sections stained with PGP9.5. Scale bar, 100 μm. Representative of two independent experiments. d, Fura-2-based calcium imaging in cultured sensory neurons from DRG obtained from WT male mice treated with SES, 1 µM PGE2 or 1 µM PGE2 + 200 ng ml−1 TSP-1 for 7 min, followed immediately by 100 nM capsaicin, 100 nM capsaicin + 1 µM PGE2 or 100 nM capsaicin + 1 µM PGE2 + 200 ng ml−1 TSP-1, respectively for 30 s, a 5 min SES wash and treatment with 1 µM capsaicin for 30 s. SES was used as the recording solution. Treatments were applied during live imaging using a gravity-based perfusion system. Frames were captured every 3 s. Intensity traces of ratio of 340/380 are plotted. e, dF/F calculated as (F1 − F0)/F0, where F1 is the peak response within 40 s of treatment with 100 nM capsaicin and F0 is the average of 10 s before the PGE2-treatment time point. SES, n = 80; PGE2, n = 55; PGE2 + TSP, n = 42. All TRPV1+ neurons are from one experiment consisting of three separate recordings for each condition. Data are represented as mean value ± s.e.m. Unpaired two-tailed t-test was performed. P < 0.05 was considered significant. An individual dot represents a neuron that was included in the analysis. Data are representative of three independent experiments.
Extended Data Fig. 1
Extended Data Fig. 1. Single-cell RNA sequencing analysis of immune cells.
(a) Gating strategy for CD45+ cells from digested skin single cell suspension. (b) Violin plot marker genes used to cell type annotation (c) t-SNE plot showing the overlap between the two biological replicates.
Extended Data Fig. 2
Extended Data Fig. 2. Different injuries show distinct myeloid cell populations at Tmax.
Immune cells were isolated from injured or healthy paw skin and stained for various myeloid cell markers. (a) Immune cells isolated from injured paw skin stained for myeloid cell markers. Representative flow plots are gated on Live CD45 + CD11b + CD11c-cells. (b) Quantification of myeloid cell populations in incision (24 h) (n = 4), UV burn (48 h) (n = 3), and zymosan (4 h) (n = 4). Data is gated on live CD45 + CD11b + CD11c- cells. Data are represented as mean value ± SEM. p values calculated using one-way ANOVA, Tukey’s multiple comparison test. * p < 0.05, ** p, 0.01, *** p < 0.001,*** p < 0.0001, ****<0.00001 and n.s. = not significant.
Extended Data Fig. 3
Extended Data Fig. 3. Immune cells in zymosan, incision and UV burn show commonly upregulated genes at Tmax.
Heatmaps showing the log2 fold-change of the commonly upregulated differentially expressed genes common in zymosan, incision, and UV burn at Tmax compared to CL_zymosan, CL_incision and CL_UVB respectively in Ccr2- recMacs, Ccr2+ recMacs, Cd163+ Macs, dendritic cells, mast cells, gd T cells, ILCs and Tconv cells.
Extended Data Fig. 4
Extended Data Fig. 4. Immune cells in zymosan, incision and UV burn show commonly downregulated genes at Tmax.
Heatmaps showing the log2 fold-change of the commonly downregulated differentially expressed genes common in zymosan, incision, and UV burn at Tmax compared to CL_zymosan, CL_incision and CL_UVB respectively in Ccr2- recMacs, Ccr2+ recMacs, Cd163+ Macs, dendritic cells and mast cells.
Extended Data Fig. 5
Extended Data Fig. 5. Receptor expression profile in male DRG neurons.
(a) Dot plot showing marker genes used to annotate given DRG subtypes. (b) Differential expression of receptor genes in cLTMR1, NF1, NF2, NF3, NP, p_cLTMR2, PEP1, PEP2 and SST, and cLTMR cells from male DRG neurons, from ref. . Heatmaps show significantly (adjusted p < 0.05) differentially expressed genes in neurons with log2FC = 0.5 and min. pct. = 0.25. (c) Violin plot showing normalized expression of specific receptor genes in cLTMR1, PEP1, PEP2, NP and SST neurons.
Extended Data Fig. 6
Extended Data Fig. 6. Neuroimmune interactomes of pain have injury-specific signatures.
(a) Schematic showing the types of intercellular communication considered between immune cells and neurons for constructing the interactome. (b) Sample of the web interface for browsing evidence behind the cell-cell interactome. Each interaction is displayed as a heading summarizing the interaction (‘IL6 binds IL6ST’) with gene names linked to HGNC pages representing the gene. The total number of supporting pieces of evidence is shown, as is the breakdown of this number by specific source: different structured databases or literature mining systems integrated with INDRA. Each row under the heading represents a distinct database entry or sentence from a publication, with each publication linked to its corresponding PubMed landing page. Each row also links to a curation page where feedback can be given on the correctness of the interaction. (c) Overview of the condition-specific interactome construction. The general cell-cell interactome was provided as input to Cellchat together with data from immune cells for each of the three pain conditions: UVB, Zymosan, or incision, and combined with naïve DRG neuron data. This results in three condition-specific neuroimmune interactomes. (d) The modalities of interactions and the example of INDRA-based literature evidence, as shown by PMIDs for the representative interactions, are shown in Fig. 4d. (e) Dot plots showing examples of interactions between immune cells and DRG neurons that are shared or injury-specific.
Extended Data Fig. 7
Extended Data Fig. 7. Immune cell – DRG neurons interactome show injury-specific signatures.
Heatmap of the interaction strength between immune cells (senders) and neurons (receivers) calculated for zymosan, incision and UV burn at CL, 4 h, 24 and 48 h. Color saturation represents the communication probability between the senders and receivers calculated by CellChat.
Extended Data Fig. 8
Extended Data Fig. 8. Human TSP-1 inhibits PKA activity in human sensory neurons.
(a) Box plot of Ptgs2 and Thbs1 expression showing normalized expression of the two genes. Upregulation of Thbs1 mirrors pain hypersensitivity as observed in Fig. 1a. The p-values and correlation coefficients indicated below are calculated using the Pearson correlation analysis for the average expression Thbs1 and Ptgs2 at each timepoint per condition. (b) Timeline of iPSC-derived sensory neuron differentiation, viral transduction and experimental treatments. (c) Representative images of iPSC-derived sensory neurons expressing PKA reporter (green) treated with DMSO, forskolin (FSK), or FSK + TSP1. The scale bar is 100 μm. Representative of two independent experiments with at least 9 wells in each condition. (d) Box plot graph showing the fold change (post/pre-treatment) in fluorescent intensity of PKA reporter in cells treated with FSK alone or FSK in the presence of escalating doses of TSP1. DMSO, n = 9; FSK, n = 18; TSP1 0.16 ug/ml, n = 9; TSP1 0.5 ug/ml, n = 9; TSP1 1.5 ug/ml, n = 9; TSP1 3 ug/ml, n = 9; TSP1 5 ug/ml, n = 9; TSP-1 10 ug/ml, n = 9 Bounds of box and whiskers are 25% and 75% percentile with 95% confidence level. One-way ANOVA was performed (n = 3 independent experiments), **p < 0.005, ***p < 0.001, ****p < 0.0001.

Similar articles

Cited by

References

    1. Basbaum, A. I., Bautista, D. M., Scherrer, G. & Julius, D. Cellular and molecular mechanisms of pain. Cell10.1016/j.cell.2009.09.028 (2009). - PMC - PubMed
    1. Ricciotti E, Fitzgerald GA. Prostaglandins and inflammation. Arterioscler. Thromb. Vasc. Biol. 2011;31:986–1000. - PMC - PubMed
    1. Jain A, Pasare C. Innate control of adaptive immunity: beyond the three-signal paradigm. J. Immunol. 2017;198:3791–3800. - PMC - PubMed
    1. Renthal W, et al. Transcriptional reprogramming of distinct peripheral sensory neuron subtypes after axonal injury. Neuron. 2020;108:128–144.e9. - PMC - PubMed
    1. Jain A, Hakim S, Woolf CJ. Unraveling the plastic peripheral neuroimmune interactome. J. Immunol. 2020;204:257–263. - PubMed

MeSH terms