

doi: 10.1007/s11606-024-08829-0.
Epub 2024 May 28.
National- and State-Level Pharmacy-Based Buprenorphine Dispensing, United States 2019-2021
Affiliations
- PMID: 38806799
- PMCID: PMC11282010
- DOI: 10.1007/s11606-024-08829-0
Item in Clipboard
National- and State-Level Pharmacy-Based Buprenorphine Dispensing, United States 2019-2021
J Gen Intern Med.
2024 Aug.
No abstract available
Conflict of interest statement
The authors declare no competing interest.
Figures
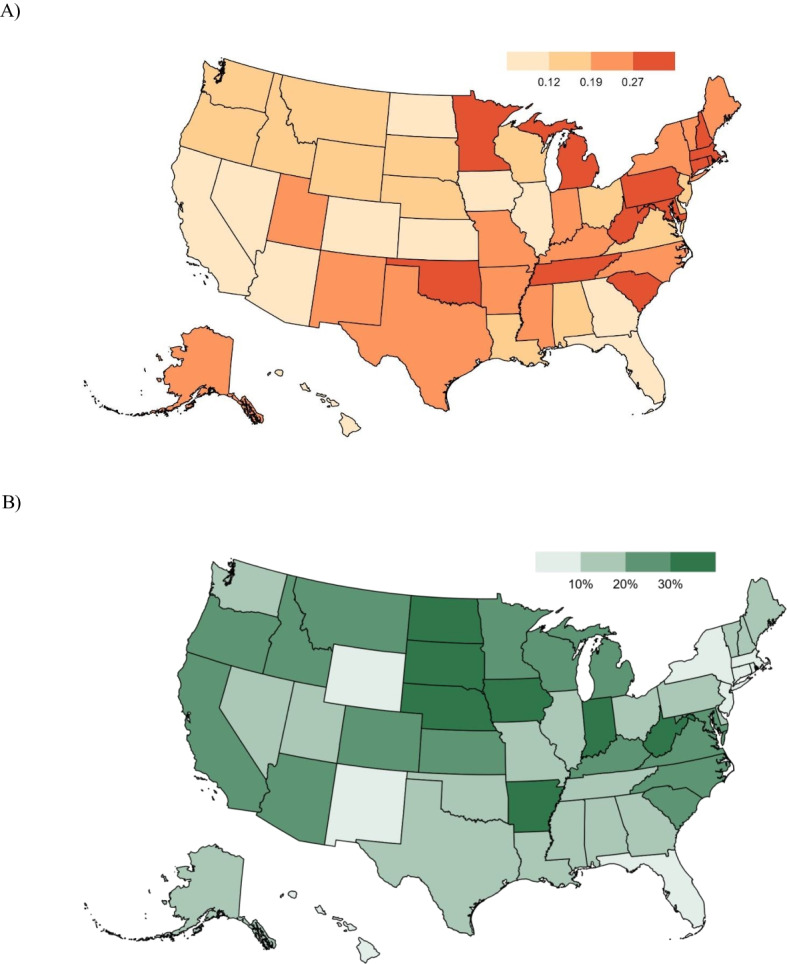
A Individuals dispensed buprenorphine per individual with opioid use disorder (OUD) — United States, 2019. B Percent change in total days of buprenorphine dispensed per capita, by state — United States, 2019–2021. Notes: A Nationally, mean number of individuals dispensed buprenorphine per individual was 0.18 in 2019; state-wide variation ranged from a minimum of 0.04 to a maximum of 0.46. Data on the number of individuals dispensed a buprenorphine prescription are from projected IQVIA Longitudinal Prescription (LRx) data, 2019. IQVIA custom projected Longitudinal Prescription (LRx) data for state estimates with 100% retail pharmacy coverage. Data on 2019 adjusted opioid use disorder prevalence estimates are from Krawczyk et al. (2022) (multipliers were only available for 2019 data). State data are divided into quartiles. B Total days’ supply (sum of days supplied) per capita was used to capture state-level changes in dispensing per person (both the number of prescriptions and the length prescribed). Data on buprenorphine prescriptions dispensed and days supplied are from IQVIA Xponent 2021, extracted 2023. IQVIA collected all-payer pharmaceutical data from approximately 48,900 US retail pharmacies and projected data for state estimates with 100% retail pharmacy coverage. Population estimates are from the US Census Bureau. Population and Housing Unit Estimates (https://www.census.gov/programs-surveys/popest/data/data-sets.html ). State data are divided into quartiles.
References
-
- Spencer MR, Miniño AM, Warner M. Drug overdose deaths in the United States, 2001–2021. NCHS Data Brief, no 457. Hyattsville, MD: National Center for Health Statistics. 2022. 10.15620/cdc:122556.
-
- Cremer LJ, Board A, Guy Jr GP, Schieber L, Asher A, Parker EM. Trends in pharmacy-based dispensing of buprenorphine, extended-release naltrexone, and naloxone during the COVID-19 pandemic by age and sex–United States, March 2019–December 2020. Drug Alcohol Depend. 2022 ;232:109192. 10.1016/j.drugalcdep.2021.109192 - DOI - PMC - PubMed
-
- Population and Housing Unit Estimates. US Census Bureau. 2022. https://www.census.gov/programs-surveys/popest.html. Accessed 06/20/2022.
Publication types
MeSH terms
Substances
LinkOut - more resources
Full Text Sources
Medical
