. 2024 May 28;25(1):140.
doi: 10.1186/s13059-024-03271-1.

ePRINT: exonuclease assisted mapping of protein-RNA interactions

Affiliations

ePRINT: exonuclease assisted mapping of protein-RNA interactions

Sophie Hawkins et al. Genome Biol. .

Abstract

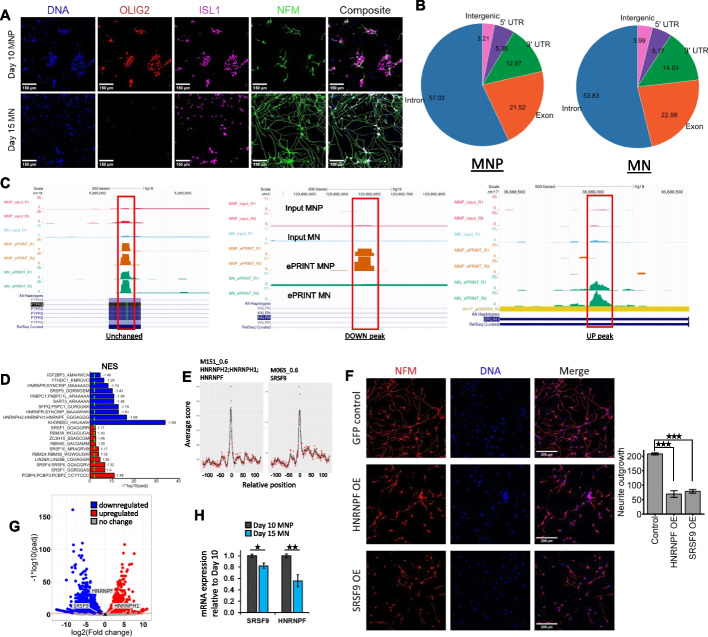
RNA-binding proteins (RBPs) regulate key aspects of RNA processing including alternative splicing, mRNA degradation and localization by physically binding RNA molecules. Current methods to map these interactions, such as CLIP, rely on purifying single proteins at a time. Our new method, ePRINT, maps RBP-RNA interaction networks on a global scale without purifying individual RBPs. ePRINT uses exoribonuclease XRN1 to precisely map the 5' end of the RBP binding site and uncovers direct and indirect targets of an RBP of interest. Importantly, ePRINT can also uncover RBPs that are differentially activated between cell fate transitions, including neural progenitor differentiation into neurons.

Keywords: CLIP; RNA; RNA-binding protein; Regulation.


Conflict of interest statement

GWY is a co-founder, member of the board of directors, on the SAB, equity holder and paid consultant for Eclipse Bioinnovations, and a distinguished visiting professor at the National University of Singapore. GWY's interests have been reviewed and approved by the University of California San Diego in accordance with its conflict-of-interest policies. The remaining authors have no competing interests to declare.

Figures

Fig. 1
Fig. 1
ePRINT identifies bonafide RBP-RNA interactions. A Schematic of the ePRINT protocol. Briefly, cells are cross-linked using UV irradiation and then lysed. Protein-RNA complexes are isolated, and then RBP-RNA binding sites are isolated by heat fragmentation followed by 5′–3′ exonuclease digestion. Finally, the protein is digested and the RNA encoding the protein footprint is sequenced. B RT-qPCR indicating siRNA-mediated depletion of FUS mRNA in HEK293T cells after 72 h. N = 4. *** indicates pval < 0.001 by Student’s t-test. Error bars indicate SEM. C Representative images indicating siRNA-mediated depletion of FUS protein in HEK293T cells after 72 h. D UCSC genome browser snapshot showing an example RBP peak in exon 4 of the XIST gene that is enriched in ePRINT vs input, and unchanged between experimental conditions. E Mutational analysis showing percentage of peaks with deletions (DEL) or point mutations (MUT). Single nucleotide polymorphisms (SNP) indicate that the mutation/deletion was found within the 1000 genomes database [8]. F Distribution of all ePRINT peaks identified in HEK293T cells across the following gene features: introns, exons, 5′ UTRs, 3′ UTRs and intergenic regions. Numbers indicate percentages of ePRINT peaks mapped to a given feature. G Number of ePRINT peaks per 100 kb within introns, exons, 5′ UTRs and 3′ UTRs. H Enrichment of RBP motifs in peaks mapping to different intragenic gene features. UTR5, EX, IN, and UTR3 indicate peaks where both the start and end sites map within the same 5′ UTR or exon or intron or 3′ UTR, respectively. EX_EX indicates peaks where the start and end sites map to different exons. EX_IN indicates peaks where the start and end sites map to exons and introns respectively. IN_EX indicates peaks where the start and end sites map to introns and exons respectively. IN_IN indicates peaks where the start and end sites map to different introns. I RBP motifs are enriched at peak start sites indicated by 0 on the x-axis. Peak start sites were extended by 100 bp (+ / −). Scores for individual motifs were estimated at each bp along each peak using the position weight matrices. Per bp scores were averaged across all peaks and converted into z-scores: higher z-scores (red) indicate a higher probability of locating the motif(s). The left panel indicates peaks identified in ePRINT samples. The right panel indicates randomly generated peaks. J UCSC genome browser snapshots showing example RBP peaks that are altered in the siFUS condition compared to the siNEG control. DOWN/Reduced peak (upper left panel): region: 3′ UTR of the ITM2C gene. Log2FC − 8.64, padj 5.02e − 07. UP/Enhanced peak (upper right panel): region: exon 6 of the RPSA gene. Log2FC 2.47, padj 4.65e − 09. Adjacent UP/DOWN peak (lower panel): region: 3′ UTR of the SMARCC1 gene. UP peak: Log2FC = 1.41. Padj = 5.90e − 13. DOWN peak: Log2FC =  − 0.86. Padj = 4.35e − 04. K Peak set enrichment analysis of FUS binding sites identified using eCLIP in HEK293T cells. X-axis indicates ePRINT peaks ranked from most significantly upregulated (left side) to most significantly downregulated (right side). A total of 4121 FUS eCLIP peaks mapped to genes considered expressed in the ePRINT analysis; ePRINT captured 25% of these peaks (Fig. S4D). NES indicates normalised enrichment score identified by GSEA. L Hypergeometric test to determine enrichment of FUS target genes that display enhanced (UP) or reduced (DOWN) ePRINT peaks upon FUS knockdown. Genes with peaks in both directions are excluded in the UP ONLY and DOWN ONLY comparisons. Values shown in blue indicate fold enrichment of the observed FUS targets in each ePRINT peak group compared to the expected value. M Top 10 RBP motifs identified as enriched in peaks that are enhanced (red) or reduced (blue) after FUS knockdown. An enhanced peak indicates that the associated RBP has more binding events, or is more active, after FUS knockdown. A reduced peak indicates that the associated RBP has fewer binding events. NES indicates normalised enrichment score identified by GSEA. N, O Network analysis to identify direct and indirect effects of FUS knockdown. FUS eCLIP data was used to identify direct targets of FUS. eCLIP datasets (N) or ePRINT peaks (O) were then used to identify targets of the RBPs showing a change in activity shown in Figs. 1 M and S6B. eCLIP captures 30/53 of the genes that are differentially expressed upon FUS knockdown (DEGs). ePRINT captures 38/53 DEGs. Colour legend on the left indicates expression changes for RBPs and genes. The flow chart on the right displays the strategy used to map the network. P Hierarchical clustering of the reduced ePRINT peak set based on sequence similarity. Clusters are indicated by coloured rectangles. Q Enrichment of 6-mers in the identified reduced peak clusters. U nucleotides were converted to T to comply with the R alignment package. P-values are indicated as not significant (NS), < 0.05 or < 0.01. The green rectangle indicates 6-mers containing the GUGG (GTGG) or GGUG (GGTG) FUS motifs. The blue rectangle indicates 6-mers that are similar to the TDP43 motif (UGUGUG)
Fig. 2
Fig. 2
ePRINT uncovers RBPs regulating cell fate transition from motor neuron progenitors (MNPs) to post-mitotic motor neurons (MNs). A Representative images of day 10 motor neuron progenitors (MNPs) and day 15 post-mitotic motor neurons (MNs). B Distribution of ePRINT peaks across gene features in MNPs vs MNs. Numbers indicate percentages of ePRINT peaks mapped to a given feature. C UCSC genome browser snapshots showing example RBP peaks. Unchanged peak (left panel): region: exon 5 of the PTPRS gene. Log2FC 4.86e − 03, padj 1 (0.9999719). DOWN peak (middle panel): Peak that was identified as reduced in MNs compared to MNPs. Region: intron 1 of the KALRN gene. Log2FC − 8.76, padj 8.21e − 05. UP peak (right panel): Peak that was identified as enhanced in MNs compared to MNPs. Region: exon 19 of the SRCIN1 gene. Log2FC 12.45, padj 6.46e − 07. D Top 10 RBP motifs identified as enriched in peaks that are enhanced (red) or reduced (blue) in MNs compared to MNPs. NES indicates normalised enrichment score identified by GSEA. E Motifs M151_0.6 (HNRNPH2, HNRNPH1, HNRNPF) and M065_0.6 (SRSF9) display enrichment at the peak start site (indicated as 0 on the x-axis). Peak start sites were extended by 100 bp on either side for the motif analysis. F Representative images of day 16 MNs after RBP overexpression (OE) (left panel) and quantification of total neurite outgrowth normalised by cell count (right panel). Control indicates eGFP expression. Cells were stained with NFM to define the soma and neurites. Nuclei were stained using Hoechst (blue). G Volcano plot of differentially expressed genes from day 10 MNP to day 15 MN. SRSF9, HNRNPF and HNRNPH1 have been annotated (light grey labels; triangle points). HNRNPH2 was not expressed in either MNPs or MNs. H RT-qPCR analysis of SRSF9 and HNRNPF mRNA expression levels between day 10 MNPs and day 15 MNs. N = 3. * indicates pval < 0.05. ** indicates pval < 0.01. *** indicates pval < 0.001 by Student’s t-test. Error bars indicate SEM

Similar articles

Cited by

References

    1. Gerstberger S, Hafner M, Tuschl T. A census of human RNA-binding proteins. Nat Rev Genet. 2014;15(12):829–845. doi: 10.1038/nrg3813. - DOI - PMC - PubMed
    1. Gebauer F, Schwarzl T, Valcárcel J, Hentze MW. RNA-binding proteins in human genetic disease. Nat Rev Genet. 2021;22(3):185–198. doi: 10.1038/s41576-020-00302-y. - DOI - PubMed
    1. Pereira B, Billaud M, Almeida R. RNA-binding proteins in cancer: old players and new actors. Trends Cancer Res. 2017;3(7):506–528. doi: 10.1016/j.trecan.2017.05.003. - DOI - PubMed
    1. Prashad S, Gopal PP. RNA-binding proteins in neurological development and disease. RNA Biol. 2021;18(7):972–87. doi: 10.1080/15476286.2020.1809186. - DOI - PMC - PubMed
    1. Lee FCY, Ule J. Advances in CLIP technologies for studies of protein-RNA interactions. Mol Cell. 2018;69(3):354–369. doi: 10.1016/j.molcel.2018.01.005. - DOI - PubMed

Publication types