. 2024 May 28;21(1):140.
doi: 10.1186/s12974-024-03113-8.

Single-cell RNA sequencing reveals the evolution of the immune landscape during perihematomal edema progression after intracerebral hemorrhage

Affiliations

Single-cell RNA sequencing reveals the evolution of the immune landscape during perihematomal edema progression after intracerebral hemorrhage

Peng Zhang et al. J Neuroinflammation. .

Abstract

Background: Perihematomal edema (PHE) after post-intracerebral hemorrhage (ICH) has complex pathophysiological mechanisms that are poorly understood. The complicated immune response in the post-ICH brain constitutes a crucial component of PHE pathophysiology. In this study, we aimed to characterize the transcriptional profiles of immune cell populations in human PHE tissue and explore the microscopic differences between different types of immune cells.

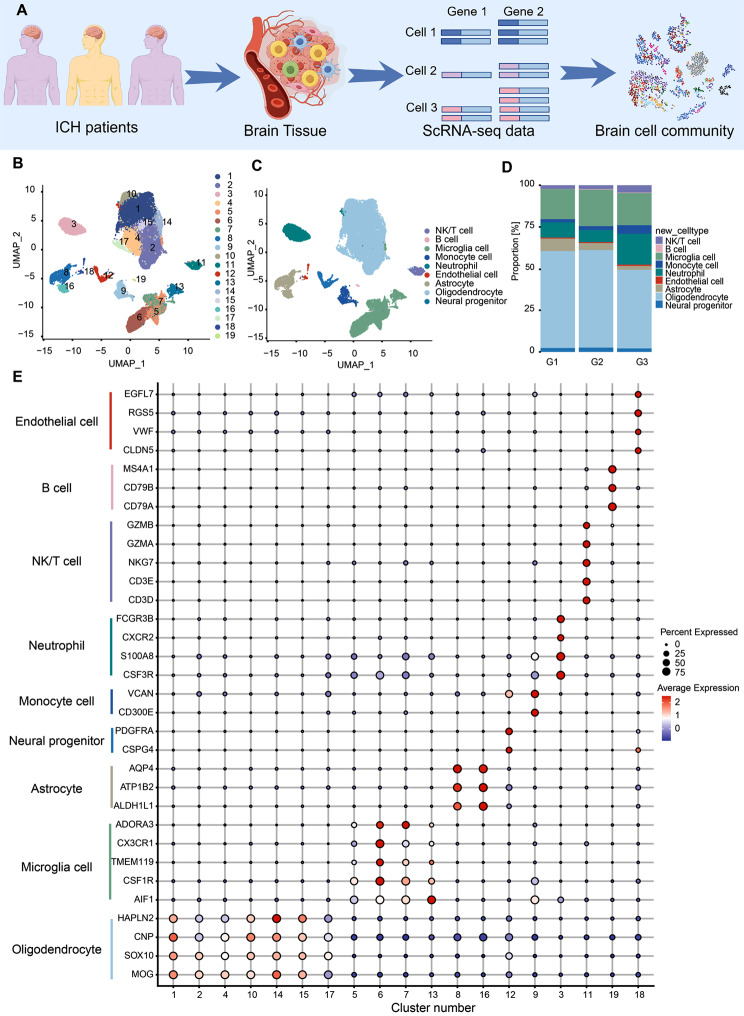
Methods: 9 patients with basal ganglia intracerebral hemorrhage (hematoma volume 50-100 ml) were enrolled in this study. A multi-stage profile was developed, comprising Group1 (n = 3, 0-6 h post-ICH, G1), Group2 (n = 3, 6-24 h post-ICH, G2), and Group3 (n = 3, 24-48 h post-ICH, G3). A minimal quantity of edematous tissue surrounding the hematoma was preserved during hematoma evacuation. Single cell RNA sequencing (scRNA-seq) was used to map immune cell populations within comprehensively resected PHE samples collected from patients at different stages after ICH.

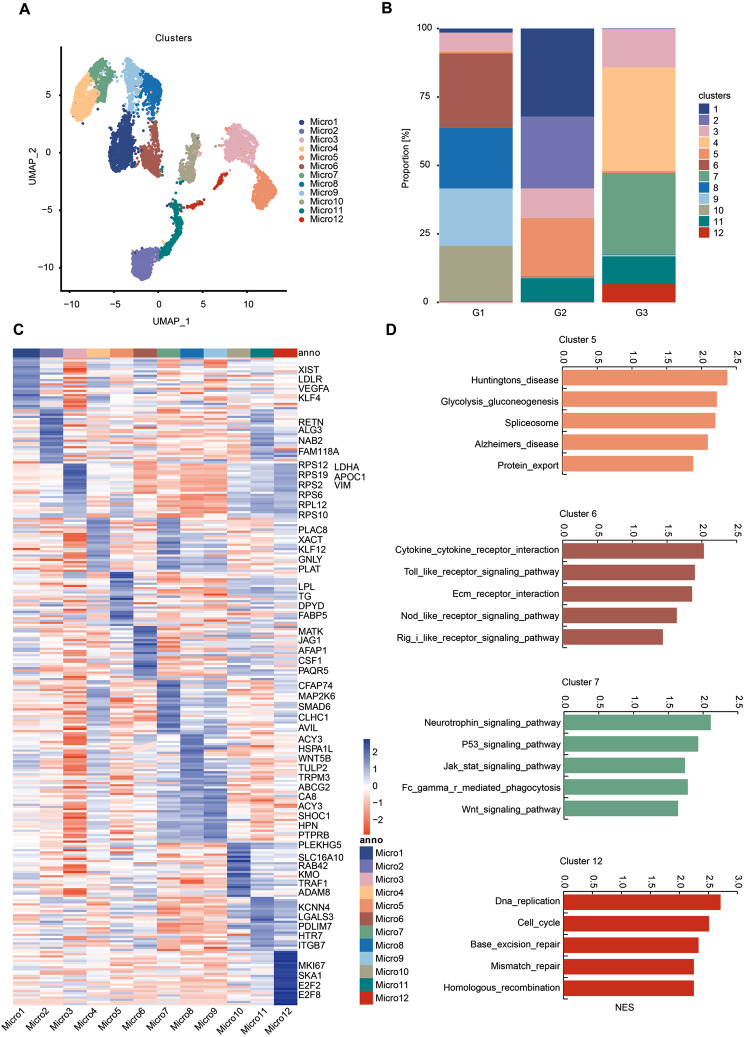
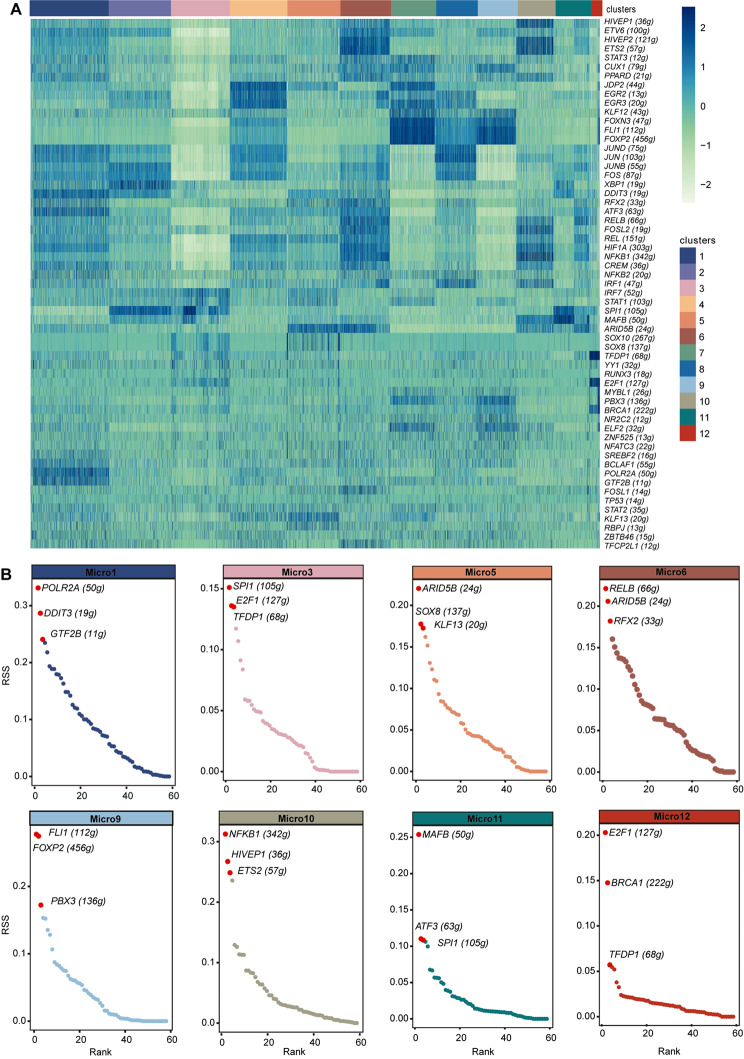
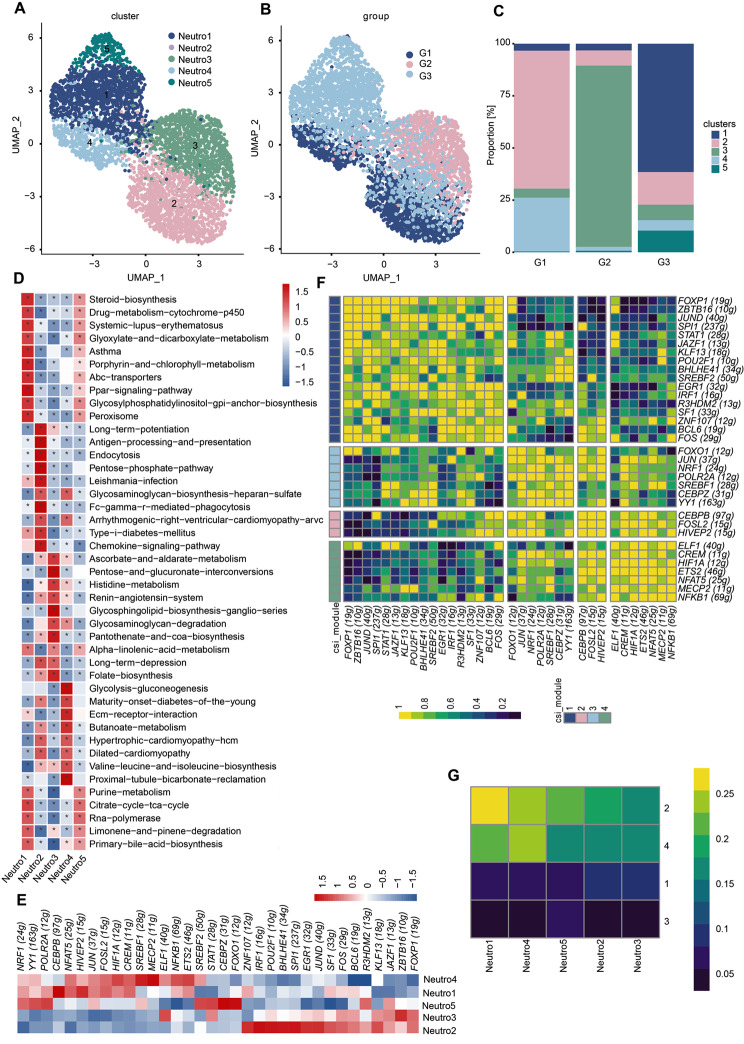
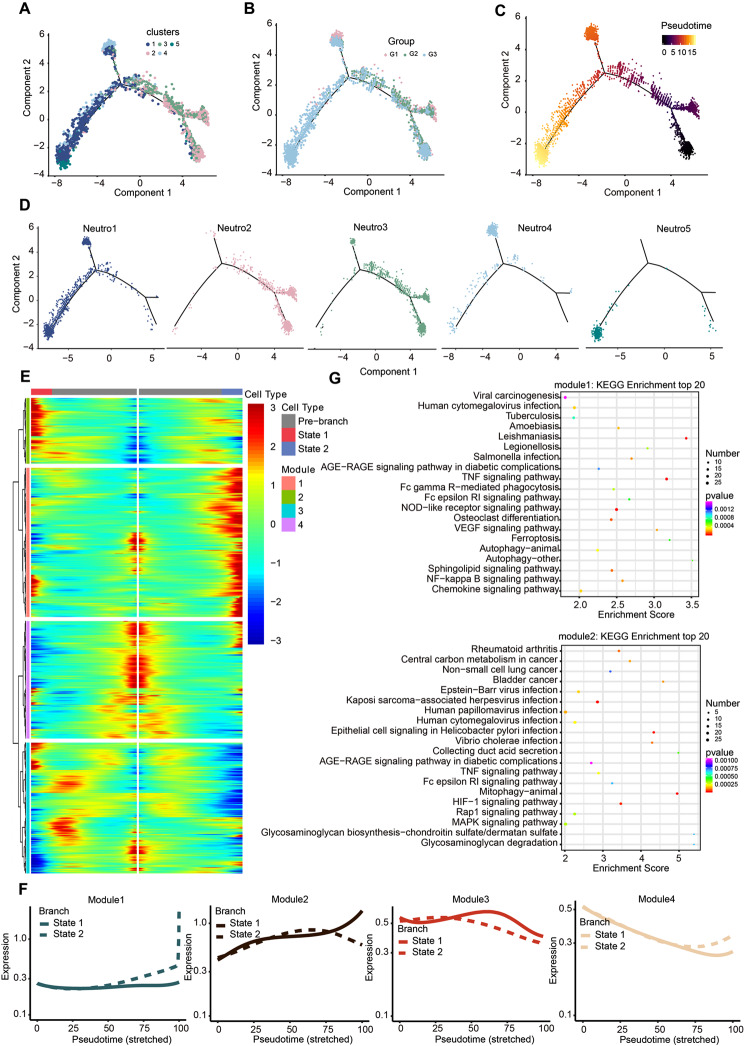
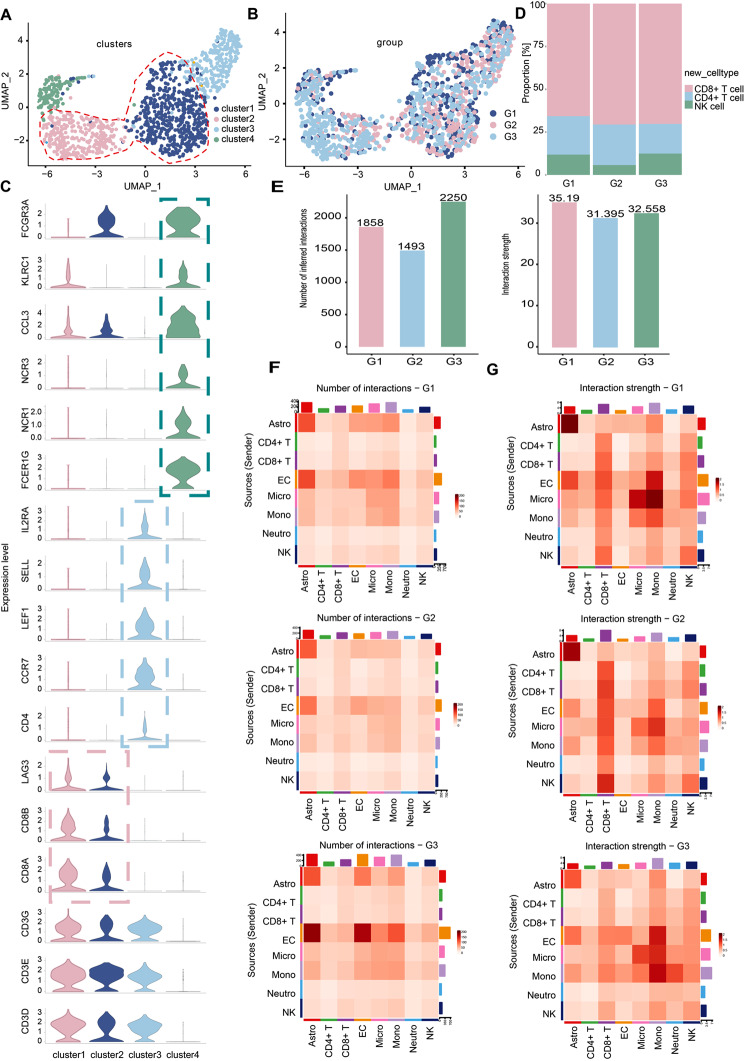
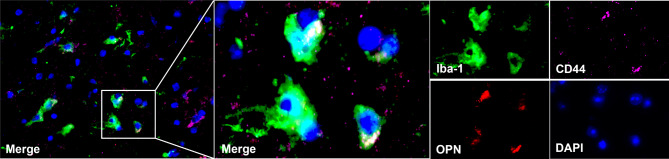
Results: We established, for the first time, a comprehensive landscape of diverse immune cell populations in human PHE tissue at a single-cell level. Our study identified 12 microglia subsets and 5 neutrophil subsets in human PHE tissue. What's more, we discovered that the secreted phosphoprotein-1 (SPP1) pathway served as the basis for self-communication between microglia subclusters during the progression of PHE. Additionally, we traced the trajectory branches of different neutrophil subtypes. Finally, we also demonstrated that microglia-produced osteopontin (OPN) could regulate the immune environment in PHE tissue by interacting with CD44-positive cells.

Conclusions: As a result of our research, we have gained valuable insight into the immune-microenvironment within PHE tissue, which could potentially be used to develop novel treatment modalities for ICH.

Keywords: Immune cell; Intracerebral hemorrhage; Osteopontin; Perihematomal edema; Single cell RNA sequencing.


Conflict of interest statement

The authors declare that the research was conducted in the absence of any commercial or financial relationships that could be construed as a potential conflict of interest.

Figures

Fig. 1
Fig. 1
Single-cell profiling of diverse immune cells from three groups. (A) Overview of the study workflow. (B) Position of clusters on the UMAP map. Color represents the cluster ID. (C) Phenotype of clusters on the UMAP map. Different colors represent 9 clusters (cell types) respectively, including microglia, astrocytes, oligodendrocytes, neural progenitors, monocytes, neutrophils, NK/T cells, B cells, and endothelial cells. (D) Proportions of all cell types in each group during PHE progression. (E) Representative cell type marker genes (y-axis) with the percent of cells that express a gene (size of dot) in each cluster (distributed along the x-axis) and the average expression level (color intensity) are shown for microglia (AIF1, CSF1R, TMEM119, and CX3CR1), astrocytes (AQP4, ATP1B2, and ALDH1L1), oligodendrocyte (MOG and SOX10), neural progenitor (PDGFRA), monocyte (VCAN and CD300E), neutrophil (CSF3R and S100A8), NK/T cell (GZMA, NKG7, CD3D, and CD3E), B cell (CD79B and MS4A1) and endothelial cells (VWF and CLDN5) for each cluster
Fig. 2
Fig. 2
Microglia states have diverse gene expression and biological pathway correlates. (A) UMAP of unbiased clustering on the cells from the four sorted clusters (5, 6, 7, and 13, shown in Fig. 1E) meeting criteria for microglia from the 9-sample dataset contains 12 microglia clusters. (B) Proportions of all microglia subclusters among three groups. (C) Differential expression analysis comparing each cluster to others demonstrates distinct gene expression profiles. The top 25 genes from each cluster are displayed with gene names annotated on the right. (D) GSEA analysis of genes that differentiate each cluster from cluster 9 (‘homeostatic microglia’) suggests distinct biological pathways. Permutation-based FDR was used for multiple testing of significance
Fig. 3
Fig. 3
Identifying potential functional marker genes for the microglial clusters. (A) Microglial clusters are visualized in columns, and rows represent selected transcription regulators that are differentially expressed in specific clusters. As revealed in the key code at the right of the panel, the size of each dot represents the fraction of cells in a given cluster in which the gene was detected, and the color of the dot represents the average expression levels for the cells belonging to that cluster. (B) Representative membrane-associated proteins (y-axis) with the percent of cells that express a gene (size of the dot) in each subcluster (distributed along the x-axis) and the average expression level (color intensity) are shown for microglial subtypes
Fig. 4
Fig. 4
Transcription factor regulatory networks are specific to microglia phenotypes (A) SCENIC workflow identified transcription factor-regulated networks associated with different phenotypic clusters of microglia. Heatmap of each microglia subtype’s inferred regulon activity score (RAS) in cell levels. (B) Ranking plot of regulon specificity score (RSS). The higher RSS of the regulon may be specific to the subtypes
Fig. 5
Fig. 5
Signaling changes of microglia subcluster during PHE tissue progression. (A) Cell ligand-receptor inference analysis of microglial subtypes during PHE tissue progression (G2 vs. G1). (B) Heatmaps demonstrate the differences in crosstalk strength of the SPP1 signaling pathway in microglial subclusters between different groups (G1, G2, and G3). (C) The contribution of inferred ligand-receptor pairs in SPP1 signaling between different groups (G1, G2, and G3)
Fig. 6
Fig. 6
The heterogeneity and transcription factor regulatory networks of neutrophils during PHE progression. (A) UMAP of unbiased clustering on the cells for neutrophils from the 9-sample dataset contains five neutrophil clusters. (B) Distribution of neutrophils from different groups (G1, G2, and G3) on a UMAP plot. (C) Proportions of all neutrophil subclusters among three groups. (D) GSVA analysis indicates enriched pathways of each subset of neutrophils. Benjamini and Hochberg (BH) FDR procedure was used for multiple testing of significance. (E) Heatmap of each neutrophil subtype’s inferred regulon activity score (RAS) in cluster levels. (F) The connection specificity index (CSI) matrix highlights the regulon-to-regulon correlation across all neutrophil subtypes from different groups. Hierarchical clustering of regulons identifies four distinct regulon modules. The heatmap shows the regulation activity of each module. (G) Heatmap of the CSI matrix across all neutrophil subtypes. The color key from blue to yellow indicates the activity levels from low to high
Fig. 7
Fig. 7
Exploring the transition of neutrophils based on pseudo-time analysis using Monocle2. (A) Trajectory of five clusters along pseudo-time in a two-dimensional state-space defined by Monocle2. Each point corresponds to a single cell, and each color represents a neutrophil cluster (q-val < 0.01, BH method) (B) The pseudo-time trajectory plots demonstrate the sample distribution along the trajectory. The dot color represents the group. (C) The developmental pseudo-time of neutrophils was inferred by Monocle analysis. The dark to bright color key indicates cell differentiation from early to late. (D) The pseudo-time trajectory plots demonstrate the sample distribution along the trajectory. Each dot color represents a neutrophil cluster. (E) The heatmap displays the significantly differential expression genes during the trajectory. The blue-to-red color key indicates low to high relative expression levels. (F) Averaged expression patterns of gene sets from four modules along pseudo-time. (G) Enriched KEGG terms for gene sets from two modules (modules 1 and 2) were represented on the left side
Fig. 8
Fig. 8
Intercellular ligand-receptor prediction among immune cells revealed by CellChat analysis. (A) The UMAP plot displays four subclusters of NK/T cells. (B) Distribution of NK/T cells from different groups (G1, G2, and G3) on a UMAP plot. (C) Representative cell type marker genes (y-axis) in each cluster (distributed along the x-axis) are shown for CD8 + T cells (CD8A, CD8B, LAG3), CD4 + T cell (CD4, CCR7, LEF1, SELL, IL2RA), and NK cell (FCER1G, NCR1, NCR3, CCL3, KLRC1, FCGR3A). (D) Proportions of CD4 + T cell, CD8 + T cell, and NK cell among three groups. (E) Bar plot showing the number and strength of intercellular interactions during PHE progression. Heatmaps of differential number (F) and strength (G) of intercellular interactions during PHE progression
Fig. 9
Fig. 9
Cell ligand-receptor inference analysis of immune cells during PHE progression. (A) Bubble plot (excerpted in the red dotted box in Supplementary file: Fig. S7) of the significantly differentially expressed ligand-receptor pairs during PHE progression. Dot color reflects communication probabilities, and the dot size represents computed p-values. Empty space means the communication probability is zero. P-values are computed from a two-sided permutation test. (B) The contribution of inferred ligand-receptor pairs in SPP1 signaling between groups (G1, G2, and G3). (C) Violin plots of expression distribution of signaling pathway-related genes
Fig. 10
Fig. 10
Co expression of osteopontin and CD44 in the tissue adjacent to cerebral hemorrhage hematoma. The following pictures are all taken under the Zeiss Z2 laser confocal microscope, showing co-staining and individual staining of several molecules, respectively. The surface markers Iba-1 of microglia, CD44 of monocytes, and OPN are labeled with green, red, and pink fluorescent signals respectively, while blue is the labeling of the nucleus. Microglia are surrounded by a large amount of OPN, and there is a high degree of spatial co localization between OPN and CD44.

References

    1. Magid-Bernstein J, Girard R, Polster S, Srinath A, Romanos S, Awad IA, Sansing LH. Cerebral hemorrhage: pathophysiology, treatment, and future directions. Circ Res. 2022;130:1204–29. doi: 10.1161/CIRCRESAHA.121.319949. - DOI - PMC - PubMed
    1. Keep RF, Hua Y, Xi G. Intracerebral haemorrhage: mechanisms of injury and therapeutic targets. Lancet Neurol. 2012;11:720–31. doi: 10.1016/S1474-4422(12)70104-7. - DOI - PMC - PubMed
    1. Li X, Chen G. CNS-peripheral immune interactions in hemorrhagic stroke. J Cereb Blood Flow Metab. 2023;43:185–97. doi: 10.1177/0271678X221145089. - DOI - PMC - PubMed
    1. Xue M, Yong VW. Neuroinflammation in intracerebral haemorrhage: immunotherapies with potential for translation. Lancet Neurol. 2020;19:1023–32. doi: 10.1016/S1474-4422(20)30364-1. - DOI - PubMed
    1. Ironside N, Chen CJ, Ding D, Mayer SA, Connolly ES. Jr.: Perihematomal Edema after spontaneous intracerebral hemorrhage. Stroke. 2019;50:1626–33. doi: 10.1161/STROKEAHA.119.024965. - DOI - PubMed