. 2024 Oct;18(10):2449-2470.
doi: 10.1002/1878-0261.13660. Epub 2024 May 28.

Loss of p14 diminishes immunogenicity in melanoma via non-canonical Wnt signaling by reducing the peptide surface density

Affiliations

Loss of p14 diminishes immunogenicity in melanoma via non-canonical Wnt signaling by reducing the peptide surface density

Jonas Wohlfarth et al. Mol Oncol. 2024 Oct.

Abstract

Immunotherapy has achieved tremendous success in melanoma. However, only around 50% of advanced melanoma patients benefit from immunotherapy. Cyclin-dependent kinase inhibitor 2A (CDKN2A), encoding the two tumor-suppressor proteins p14ARF and p16INK4a, belongs to the most frequently inactivated gene loci in melanoma and leads to decreased T cell infiltration. While the role of p16INK4a has been extensively investigated, knowledge about p14ARF in melanoma is scarce. In this study, we elucidate the impact of reduced p14ARF expression on melanoma immunogenicity. Knockdown of p14ARF in melanoma cell lines diminished their recognition and killing by melanoma differentiation antigen (MDA)-specific T cells. Resistance was caused by a reduction of the peptide surface density of presented MDAs. Immunopeptidomic analyses revealed that antigen presentation via human leukocyte antigen class I (HLA-I) molecules was enhanced upon p14ARF downregulation in general, but absolute and relative expression of cognate peptides was decreased. However, this phenotype is associated with a favorable outcome for melanoma patients. Limiting Wnt5a signaling reverted this phenotype, suggesting an involvement of non-canonical Wnt signaling. Taken together, our data indicate a new mechanism limiting MDA-specific T cell responses by decreasing both absolute and relative MDA-peptide presentation in melanoma.

Keywords: CDKN2A; Wnt signaling; immunogenicity; immunotherapy; melanoma; peptide surface density.


Conflict of interest statement

DL reports receiving honorarium and travel expenses from Genentech and is on the scientific advisory board of Oncovalent Therapeutics, neither of which have relevant interests associated with the results nor conduct of this study.

Figures

Fig. 1
Fig. 1
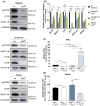
Knockdown of p14 is associated with increased HLA‐I expression. (A) short hairpin RNA (shRNA)‐mediated knockdown (kd) targeting p14 and/or p16 leads to significant downregulation of p14, p16 or both in melanoma cell lines. Western blot analysis of whole cell lysates of melanoma cell lines SK‐MEL‐28, MaMel51, and WM35 cells after shRNA‐mediated knockdown (6 days of doxycycline) of p14 (all), p16 or both (SK‐MEL‐28, MaMel51) show significant knockdown of CDKN2A gene products p14 and p16. If abundance of p14 and p16 were low (MaMel51 and WM35), p53 served as a surrogate marker for p14. Vinculin and GAPDH were used as loading controls. Dotted lines separate bands from different lanes of the same blot. Representative Western blot of n = 3. (B, C) HLA‐A/B/C and HLA‐A*02 surface expression increases due to p14kd and doublekd. (B) HLA‐A/B/C mean fluorescence intensity (MFI) of SK‐MEL‐28. (C) HLA‐A/B/C and HLA‐A*02 MFI of MaMel51. (B, C) MFIs were normalized to scr control cells and significances were determined by one‐way analysis of variances (ANOVA) with subsequent Dunnett's multiple comparison test. (B) n = 3, mean + SD, (C) n = 5 for scr and p14kd HLA‐A*02, n = 3 for others, mean + SD. P values < 0.05 were considered significant (* for P < 0.05, ** for P < 0.01).
Fig. 2
Fig. 2
p14kd of melanoma cells renders cells less sensitive to melanoma differentiation antigen‐specific T cell receptor‐transgenic T cells (TCR T cells). (A–C) p14kd of MaMel51 and WM35 cells leads to impaired recognition, activation, and killing of Tgp100 cells. (A) Measurement of Interferon gamma (IFNg) secretion, (B) mean fluorescence intensity (MFI) of CD25 T cell activation surface marker and (C) melanoma cell killing by Alamar Blue after coculture of MaMel51 and WM35 scr or p14kd cells with Tgp100 cells. (A) IFNg and (B) CD25 levels were normalized to scr control cells. (A–C) Significances were determined by unpaired, two‐tailed t test. (A, B) n = 2 for WM35, n = 3 for MaMel51, mean + SD (C) n = 3, mean + SD. (D, E) Blocking of HLA‐I in cocultures impairs interaction of Tgp100 cells and MaMel51 scr and p14kd cells. (D) Measurement of IFNg secretion and (E) melanoma cell killing by Alamar Blue after coculture with Tgp100 cells + − HLA‐I blocking W6/32 antibody. (D) IFNg levels were normalized to scr control cells. (D, E) Significances were determined by one‐way analysis of variances (ANOVA) with subsequent Sidak's multiple comparison test. n = 2, mean + SD. P values < 0.05 were considered significant (* for P < 0.05, ** for P < 0.01, *** for P < 0.001, **** for P < 0.0001).
Fig. 3
Fig. 3
Melanoma (differentiation) antigens are downregulated upon p14kd. (A, B) Melanoma (differentiation) antigens are downregulated in melanoma cell lines due to p14kd. (A) Western blot analysis of whole cell lysates of melanoma cell lines MaMel51, SK‐MEL‐28 and WM35 with scr or p14kd. Vinculin and GAPDH were used as loading controls. Representative Western blot of n = 5 for SK‐MEL‐28 or n = 3 for others. (B) qPCR of MaMel51, SK‐MEL‐28 and WM35 cells with scr or p14kd. Gene expression of p14kd cells was normalized to scr control cells of each respective cell line. RPLP0 was used as a reference gene. Significances were determined by unpaired, two‐tailed t tests for scr and p14kd cells of each respective cell line. n = 3, mean + SD. (C, D) Stable ectopic expression of gp100 enhances Tgp100 cell recognition and killing of MaMel51 p14kd compared to scr cells. (C) Measurement of Interferon gamma (IFNg) secretion, and (D) melanoma cell killing by Alamar Blue after coculture of MaMel51 scr or p14kd cells with ectopic gp100 expression or an empty vector control (EV) with Tgp100 cells. (C) IFNg values were normalized to scrEV control cells. (C, D) Significances were determined by one‐way analysis of variances (ANOVA) and subsequent Sidak's multiple comparison test. n = 3, mean + SD. P values < 0.05 were considered significant (* for P < 0.05, ** for P < 0.01, *** for P < 0.001, **** for P < 0.0001).
Fig. 4
Fig. 4
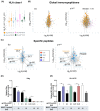
Melanoma differentiation antigen peptide density is affected by p14kd. (A–C) MDAs do not follow the trend of global upregulation of the immunopeptidome due to p14kd. (A) Expression of HLA‐A*01:01, HLA‐A*02:01, HLA‐B*08:01, and HLA‐B*18:01 and (B) the global immunopeptidome enhances upon p14kd in comparison to scr control cells. (C) MDAs like gp100 and dopachrome tautomerase (DCT) demonstrate downregulation upon p14kd compared to scr control cells. Immunopeptidomic analysis by liquid chromatography‐mass spectrometry (LC–MS) after 48 h of pulsed stable isotope labeling and amino acids in cell culture (pSILAC) treatment of MaMel51 scr and p14kd cells. (A) Logarithmic fold change in abundancy of HLA‐I expression of scr control cells and p14kd cells is shown. Median with 25th and 75th percentile is shown in box plots with whiskers representing minimum and maximum (1.5× interquartile range (IQR) from box end) and individual datapoints representing outliers (> 1.5× IQR from box end). (B) Logarithmic fold changes in heavy to medium‐labeled immunopeptides of scr control cells and p14kd cells are shown. (C) Logarithmic fold changes in heavy to medium‐labeled specific immunopeptides of scr control cells and p14kd cells are shown. C/G: Cancer/testis antigen; hilab: related to melanoma; MD: MDAs; OE: overexpressed in cancer. (D), (E) Antigen surface density affects T cell receptor‐transgenic T cell (TCR T cell) recognition. (D) Measurement of Interferon gamma (IFNg) secretion after peptide‐pulsing of MaMel51 with relevant (gp100154‐162) or irrelevant (MART‐127‐35) peptide or a spiked combination of both in indicated concentrations and (D) coculture with Tgp100 cells or (E) surface staining of HLA‐A*02 after peptide‐pulsing with gp100154‐162 or MART‐127‐35 peptide or a spiked combination of both in indicated concentrations. Values were normalized to T2 gp100154‐162 pulsed [1 μg] control cells. Significances were determined by analysis of variances (ANOVA) with subsequent Sidak's multiple comparisons test. (D) n = 3 for T2 gp100 0.1 μg, T2 gp100/MART 0.1 μg/10 μg, T2 gp100 0.01 μg, T2 gp100/MART 0.01 μg/10 μg, n = 4 for others, mean + SD (E) n = 2 for T2 gp100 0.1 μg, T2 gp100/MART 0.1 μg/10 μg, T2 gp100 0.01 μg, T2 gp100/MART 0.01 μg/10 μg, n = 3 for T2 unpulsed, n = 4 for others, mean + SD. P values < 0.05 were considered significant (** for P < 0.01).
Fig. 5
Fig. 5
Immunogenic changes upon CDKN2A loss define the outcome of immune checkpoint inhibition. (A) Responder of immune checkpoint inhibition (ICI) with homozygous deletions in CDKN2A tend toward a Beta‐2 microglobulin (B2M) high, gp100 low phenotype. Bulk RNAseq analysis of 23 patients with homozygous deletions in CDKN2A stratified for response and nonresponse to PD‐1 immunotherapy. Transcript per million (TPM) values of B2M, gp100 and PRAME were compared. Significances were determined by Wilcoxon test. NR, nonresponder; R, responder. (B) The overall survival (OS) of ICI patients is markedly increased upon the abundance of B2M and the absence of gp100. Survival analysis from 363 samples of cutaneous melanoma patients from cBioPortal [38]. Patients were stratified based on B2M and PMEL (gp100) expression and median OS (mOS) was calculated by the Kaplan–Meier Method. Significance was determined by log‐rank test. (C) Homozygous loss of CDKN2A does not alter the best radiographic response of ICI‐treated patients. Best radiographic response was categorized according to RECIST 1.1 in 144 melanoma patients who received PD‐1 blockade for advanced melanoma. Distribution of response categories (complete response, partial response, mixed response, stable disease, and progressive disease) was compared between patients with (n = 32) or without (n = 112) homozygous deletion of CDKN2A using the chi‐squared test.
Fig. 6
Fig. 6
p14kd‐induced immunogenic changes are p53‐dependent. (A–C) Downregulation of gp100 and upregulation of HLA‐A*02 is p53‐dependent. (A) Western blot analysis of whole cell lysates of melanoma cell lines MaMel51 and WM35 with scr or p14kd with or without Nutlin‐3 treatment. Vinculin was used as loading controls. Representative Western blot of n = 2. (B, C) HLA‐A*02 mean fluorescence intensity (MFI) of (B) MaMel51 and (C) WM35 cells with scr or p14kd with or without Nutlin‐3 treatment. MFI was normalized to scr control cells and significance was determined by one‐way analysis of variances (ANOVA) with subsequent Sidak's multiple comparison test. n = 2, mean + SD. P values < 0.05 were considered significant (* for P < 0.05, ** for P < 0.01, *** for P < 0.001).
Fig. 7
Fig. 7
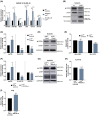
p14kd induces non‐canonical Wnt5a signaling. (A, B) Knockdown of p14 leads to non‐canonical Wnt signaling. (A) qPCR of Wnt signaling‐related genes of MaMel51 and SK‐MEL‐28 scr and p14kd melanoma cell lines. RPLP0 was used as a reference gene. Fold change induction was normalized to scr control cells of each cell line and significances were determined by unpaired, two‐tailed t tests for scr and p14kd cells of each cell line. n = 3 for SK‐MEL‐28 WNT5B, MITF, JNK, n = 4 for others, mean + SD. (B) Western blot analysis of whole cell lysates of MaMel51 scr and p14kd melanoma cell line. Vinculin was used as a loading control. Representative Western blot of n = 3. (C–E) WNT5A signaling inhibition reverts p14kd‐mediated gp100 and HLA‐A*02 changes. (C) qPCR of MaMel51 p14kd cells + − Box5 treatment. RPLP0 was used as a reference gene. Fold change induction was normalized to p14kd cells – Box5 and significances were determined by unpaired, two‐tailed t tests. n = 3, mean + SD. (D) Western blot analysis of whole cell lysates of MaMel51 p14kd melanoma cell lines + − Box5. GAPDH was used as a loading control. Representative Western blot of n = 3. (E) Only HLA‐A*02 surface expression decreased due to Box5 treatment. HLA‐I surface expression mean fluorescences intensity (MFI) of p14kd cells + − Box5 treatment. MFI was normalized to p14kd cells – Box5 treatment and significances were determined by unpaired, two‐tailed t tests. n = 3, mean + SD. (F–H) WNT5A short interfering RNA (siRNA) counteracts the phenotype of p14kd. (F) qPCR of MaMel51 p14kd cells with WNT5A siRNA or control siRNA. RPLP0 was used as a reference gene. Fold change induction was normalized to p14kd cells without WNT5A siRNA and significances were determined by unpaired, two‐tailed t tests. n = 2 for HLA‐A*02, n = 3 for gp100, n = 4 for WNT5A, mean + SD. (G) Western blot analysis of whole cell lysates of MaMel51 p14kd melanoma cells with WNT5A siRNA or control siRNA. GAPDH was used as a loading control. Representative Western blot of n = 2. (H) HLA‐A*02 surface expression decreased due to WNT5A siRNA treatment. HLA‐A*02 surface expression MFI of p14kd cells with WNT5A siRNA or control siRNA. MFI was normalized to p14kd cells with control siRNA and significance was determined by unpaired, two‐tailed t test. n = 3, mean + SD. (I) WNT5A siRNA treatment of p14kd melanoma cells improves recognition of Tgp100 cells. Measurement of Interferon gamma (IFNg) secretion after coculture of MaMel51 p14kd cells with WNT5A siRNA or ctrl siRNA and Tgp100 cells. IFNg levels were normalized to p14kd cells and significance was determined by unpaired, two‐tailed t test. n = 3, mean + SD. P values < 0.05 were considered significant (* for P < 0.05, ** for P < 0.01, *** for P < 0.001, **** for P < 0.0001).

Similar articles

References

    1. Ferlay J, Soerjomataram I, Dikshit R, Eser S, Mathers C, Rebelo M, et al. Cancer incidence and mortality worldwide: sources, methods and major patterns in GLOBOCAN 2012. Int J Cancer. 2015;136(5):E359–E386. - PubMed
    1. Wolchok JD, Chiarion‐Sileni V, Gonzalez R, Grob JJ, Rutkowski P, Lao CD, et al. Long‐term outcomes with Nivolumab plus Ipilimumab or Nivolumab alone versus Ipilimumab in patients with advanced melanoma. J Clin Oncol. 2022;40(2):127–137. - PMC - PubMed
    1. Hodi FS, O'Day SJ, McDermott DF, Weber RW, Sosman JA, Haanen JB, et al. Improved survival with ipilimumab in patients with metastatic melanoma. N Engl J Med. 2010;363(8):711–723. - PMC - PubMed
    1. Marincola FM, Jaffee EM, Hicklin DJ, Ferrone S. Escape of human solid tumors from T‐cell recognition: molecular mechanisms and functional significance. Adv Immunol. 2000;74:181–273. - PubMed
    1. Sucker A, Zhao F, Real B, Heeke C, Bielefeld N, Maβen S, et al. Genetic evolution of T‐cell resistance in the course of melanoma progression. Clin Cancer Res. 2014;20(24):6593–6604. - PMC - PubMed

MeSH terms

Associated data