. 2024 May 13:15:1377472.
doi: 10.3389/fimmu.2024.1377472. eCollection 2024.

Development and verification of a manganese metabolism- and immune-related genes signature for prediction of prognosis and immune landscape in gastric cancer

Affiliations

Development and verification of a manganese metabolism- and immune-related genes signature for prediction of prognosis and immune landscape in gastric cancer

Xiaoxi Han et al. Front Immunol. .

Abstract

Background: Gastric cancer (GC) poses a global health challenge due to its widespread prevalence and unfavorable prognosis. Although immunotherapy has shown promise in clinical settings, its efficacy remains limited to a minority of GC patients. Manganese, recognized for its role in the body's anti-tumor immune response, has the potential to enhance the effectiveness of tumor treatment when combined with immune checkpoint inhibitors.

Methods: Gene Expression Omnibus (GEO) and The Cancer Genome Atlas (TCGA) databases was utilized to obtain transcriptome information and clinical data for GC. Unsupervised clustering was employed to stratify samples into distinct subtypes. Manganese metabolism- and immune-related genes (MIRGs) were identified in GC by univariate Cox regression and least absolute shrinkage and selection operator (LASSO) regression analysis. We conducted gene set variation analysis, and assessed the immune landscape, drug sensitivity, immunotherapy efficacy, and somatic mutations. The underlying role of NPR3 in GC was further analyzed in the single-cell RNA sequencing data and cellular experiments.

Results: GC patients were classified into four subtypes characterized by significantly different prognoses and tumor microenvironments. Thirteen genes were identified and established as MIRGs, demonstrating exceptional predictive effectiveness in GC patients. Distinct enrichment patterns of molecular functions and pathways were observed among various risk subgroups. Immune infiltration analysis revealed a significantly greater abundance of macrophages and monocytes in the high-risk group. Drug sensitivity analysis identified effective drugs for patients, while patients in the low-risk group could potentially benefit from immunotherapy. NPR3 expression was significantly downregulated in GC tissues. Single-cell RNA sequencing analysis indicated that the expression of NPR3 was distributed in endothelial cells. Cellular experiments demonstrated that NPR3 facilitated the proliferation of GC cells.

Conclusion: This is the first study to utilize manganese metabolism- and immune-related genes to identify the prognostic MIRGs for GC. The MIRGs not only reliably predicted the clinical outcome of GC patients but also hold the potential to guide future immunotherapy interventions for these patients.

Keywords: gastric cancer; immune; immunotherapy; manganese metabolism; prognostic model.


Conflict of interest statement

The authors declare that the research was conducted in the absence of any commercial or financial relationships that could be construed as a potential conflict of interest.

Figures

Figure 1
Figure 1
The flow chart displaying the entire research.
Figure 2
Figure 2
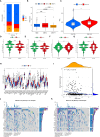
Gene screening and functional enrichment analysis. (A) Volcanic plot of DEGs in TCGA-STAD. (B) Venn diagram showing 692 differentially expressed MRGs and IRGs. (C, D) Bar chart revealing the outcomes of KEGG pathways enrichment (C) and GO functional enrichment (D) of 692 differentially expressed MRGs and IRGs.
Figure 3
Figure 3
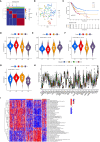
Molecular subtypes based on differentially expressed MRGs and IRGs. (A) Heatmap of consensus clustering matrix (k=4) showing four clusters (C1 = 157; C2 = 66; C3 = 81; C4 = 44) for MIRGs. (B) tSNE plot depicting distribution of four clusters. (C) The Kaplan–Meier curves displaying significant differentiation in overall survival time of patients between different phenotypes (P < 0.001). (D–G) Violin plots showing the ESTIMATE score (D), tumor purity (E), immune score (F) and stromal score (G) across different phenotypes. (H) The box diagrams displaying the difference of checkpoints’ expression in four clusters. (I) Heatmap of GSVA demonstrating biological functions and signaling pathways in four subgroups. (*, **, *** represent P < 0.05, P < 0.01, P < 0.001, respectively.).
Figure 4
Figure 4
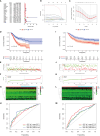
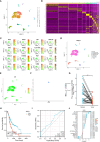
Construction and verification of MIRGs. (A) Forest plot of univariate cox regression analysis screening 22 DEGs linked to survival. (B, C) LASSO regression generating 13 genes for MIRGs. (D) The Kaplan-Meier curves illustrating significant differentiation in survival of patients between risk subgroups in the TCGA cohort. (E) Distribution of survival status in the TCGA cohort. (F) Distribution of risk score in the TCGA cohort. (G) Heatmaps of 13 genes from MIRGs in the TCGA cohort. (H) ROC curves evaluating the predictive accuracy of MIRGs in the TCGA cohort. (I) The Kaplan-Meier curves illustrating significant differentiation in survival of patients between risk subgroups in the GEO cohort. (J) Distribution of survival status in the GEO cohort. (K) Distribution of risk score in the GEO cohort. (L) Heatmaps of 13 genes from MIRGs in the GEO cohort. (M) ROC curves evaluating the predictive accuracy of MIRGs in the GEO cohort.
Figure 5
Figure 5
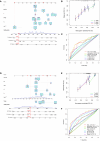
Development of nomograms based on clinical features and risk scores. (A, D) The nomograms predicting the 1-, 2- and 3-year survival rate of patients with GC in the TCGA cohort (A) and in the GEO cohort (D). (B, E) Calibration curves for nomograms in the TCGA cohort (B) and in the GEO cohort (E). (C, F) ROC curves assessing the prognostic accuracy of nomogram and other clinical features in the TCGA cohort (C) and in the GEO cohort (F).
Figure 6
Figure 6
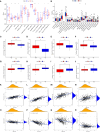
Immune landscape and drug sensitivity. (A, B) Evaluation of immune cell infiltration (A) and immune function (B) between risk subgroups. (C–J) Comparison of the IC50 values of 5-Fluorouracil (C), afatinib (D), osimertinib (E), paclitaxel (F), cediranib (G), staurosporine (H), dasatinib (I), and dactolisib (J) between risk subgroups. (K–R) The correlation between IC50 values of 5-Fluorouracil (K), afatinib (L), osimertinib (M), paclitaxel (N), cediranib (O), staurosporine (P), dasatinib (Q), dactolisib (R) and risk scores. (*, **, ***, **** represent P < 0.05, P < 0.01, P < 0.001, P < 0.0001, respectively.).
Figure 7
Figure 7
Immunotherapy efficacy and Tumor Mutational Burden. (A) The mutation status of microsatellites. (B) The difference of the median risk scores in the three subtypes. (C) Comparison of the TIDE score between risk subgroups. (D–G) The differences of Immunophenoscores (IPS) (D), IPS-PD1/PD-L1/PD-L2 (E), IPS-PD1/PD- L1/PD-L2+CTLA4 (F), and IPS-CTLA4 (G) between risk subgroups. (H) Comparison of immune checkpoints expression between risk subgroups. (I) Correlation analysis of risk scores and TMB. (J, K) The waterfall map demonstrating mutation frequencies in high-risk group (J) and in low-risk group (K). (*, **, *** represent P < 0.05, P < 0.01, P < 0.001, respectively.).
Figure 8
Figure 8
Single-cell RNA-sequencing analysis and single gene analysis of NPR3. (A) UMAP plot of 16 cell clusters. (B) Heatmap showing the top 5 marker genes for each cluster. (C) Scatter plot depicting the distribution of the marker gene for each cluster. (D) UMAP plot of all clusters with cell-type annotations. (E, F) Scatter plot (E) and bubble plot (F) displaying the distribution of NPR3 genes in clusters. (G) Differential expression of NPR3 between normal tissues and gastric cancer. (H) The Kaplan-Meier survival analysis of NPR3. (I) ROC curve of NPR3 in predicting survival time. (J) Correlation between various immune cells and NPR3. (*, **, ***, and ns represent p < 0.05, p < 0.01, p < 0.001, and “not statistically”, respectively.).
Figure 9
Figure 9
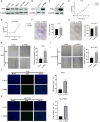
Function validation of NPR3 in GC. (A) The expression of NPR3 protein in GES-1, AGS, MKN7, SGC7901, NCI-N87 cells. (B) The expression of NPR3 protein in AGS cells following transfection of p-NPR3. (C) The expression of NPR3 protein in SGC7901 cells following transfection of p-NPR3. (D) Cell viability of AGS cells after transfection of p-NPR3. (E) Cell viability of SGC7901 cells after transfection of p-NPR3. (F) Clone formation of AGS cells after transfection of p-NPR3. (G) Clone formation of SGC7901 cells after transfection of p-NPR3. (H) Migration of AGS cells after transfection of p-NPR3. (I) Migration of SGC7901 cells after transfection of p-NPR3. (J) EdU assay of AGS cells after transfection of p-NPR3. (K) EdU assay of SGC7901 cells after transfection of p-NPR3. (*, ** represent P < 0.05, P < 0.01, respectively.).

References

    1. Yang WJ, Zhao HP, Yu Y, Wang JH, Guo L, Liu JY, et al. . Updates on global epidemiology, risk and prognostic factors of gastric cancer. World J Gastroenterol. (2023) 29:2452–68. doi: 10.3748/wjg.v29.i16.2452 - DOI - PMC - PubMed
    1. Sung H, Ferlay J, Siegel RL, Laversanne M, Soerjomataram I, Jemal A, et al. . Global cancer statistics 2020: GLOBOCAN estimates of incidence and mortality worldwide for 36 cancers in 185 countries. CA Cancer J Clin. (2021) 71:209–49. doi: 10.3322/caac.21660 - DOI - PubMed
    1. Rawla P, Barsouk A. Epidemiology of gastric cancer: global trends, risk factors and prevention. Prz Gastroenterol. (2019) 14:26–38. doi: 10.5114/pg.2018.80001 - DOI - PMC - PubMed
    1. Wang Y, Zhang L, Yang Y, Lu S, Chen H. Progress of gastric cancer surgery in the era of precision medicine. Int J Biol Sci. (2021) 17:1041–9. doi: 10.7150/ijbs.56735 - DOI - PMC - PubMed
    1. Joshi SS, Badgwell BD. Current treatment and recent progress in gastric cancer. CA Cancer J Clin. (2021) 71:264–79. doi: 10.3322/caac.21657 - DOI - PMC - PubMed