. 2024 May 28;23(1):e12584.
doi: 10.1002/rmb2.12584. eCollection 2024 Jan-Dec.

A new clustering model based on the seminal plasma/serum ratios of multiple trace element concentrations in male patients with subfertility

Affiliations

A new clustering model based on the seminal plasma/serum ratios of multiple trace element concentrations in male patients with subfertility

Takazo Tanaka et al. Reprod Med Biol. .

Erratum in

Abstract

Purpose: To investigate whether seminal plasma (SP)/serum ratios of multiple trace elements (TEs) can classify patients with male subfertility.

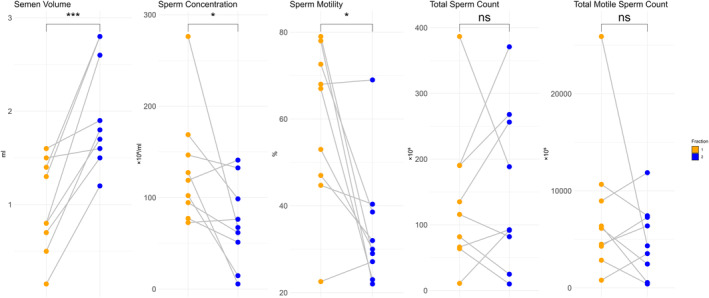
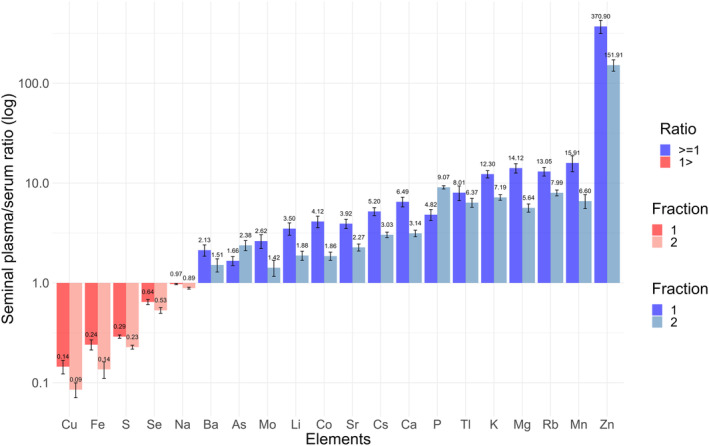
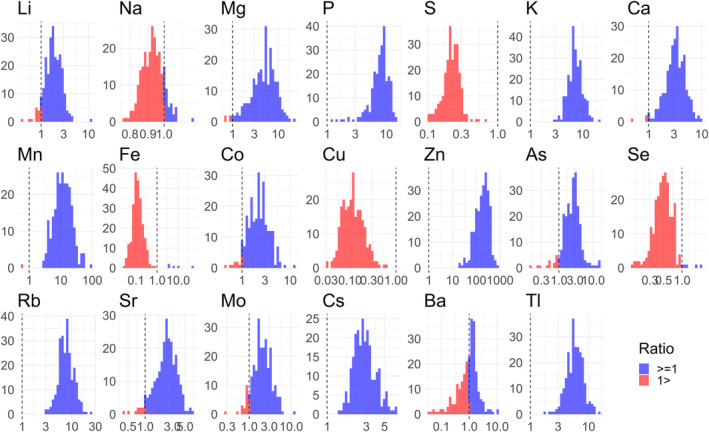
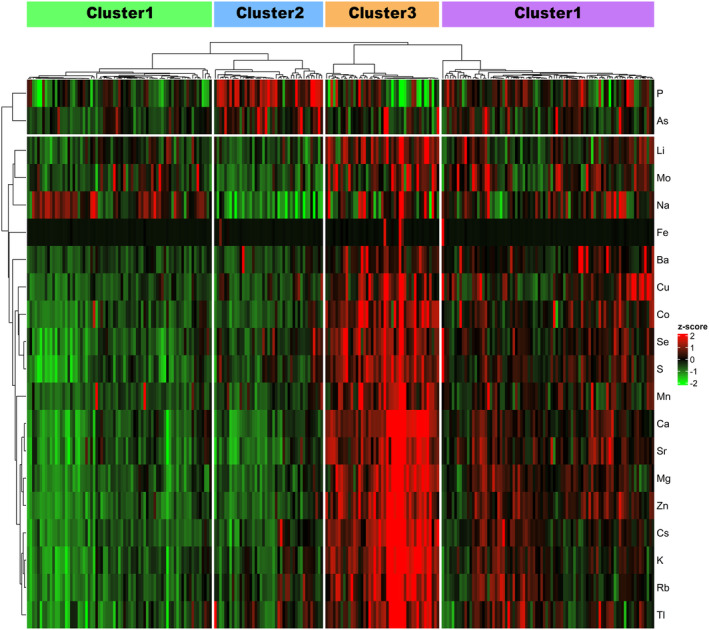
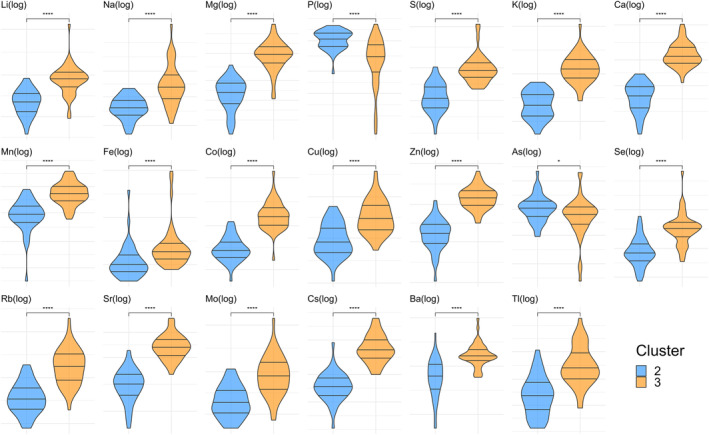
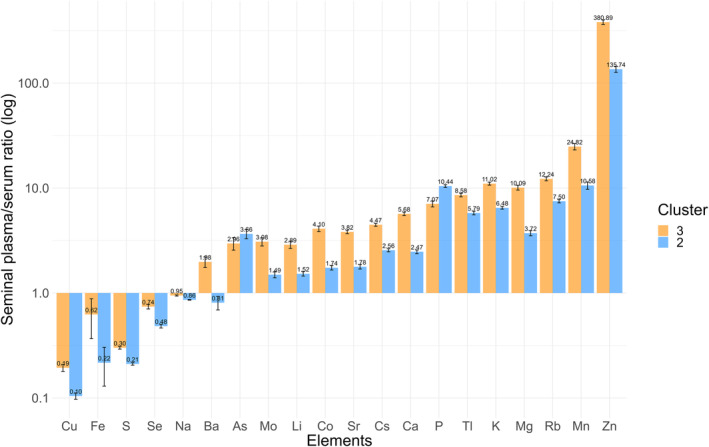
Methods: SP/serum ratios of 20 TEs (lithium, sodium, magnesium, phosphorus, sulfur, potassium, calcium, manganese, iron, cobalt, copper, zinc, arsenic, selenium, rubidium, strontium, molybdenum, cesium, barium, and thallium) were calculated for healthy volunteers (n = 4) and those consulting for male subfertility (n = 245). Volunteer semen samples were collected by split ejaculation into early and subsequent fractions, and SP/serum ratio data were compared between fractions. The patients' SP/serum ratio data were used in an unsupervised clustering analysis and qualitatively compared with the data from the fractions of ejaculation from the volunteers. Semen quality parameters and pregnancy outcomes were compared between patient clusters.

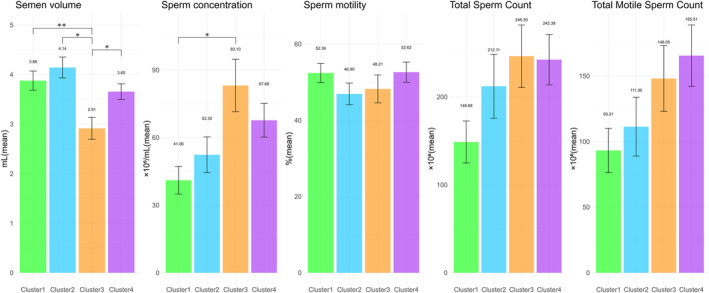
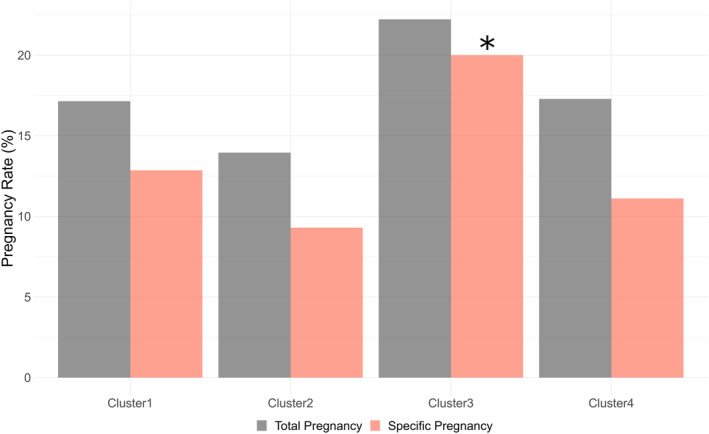
Results: The early fraction of volunteers was characterized by lower phosphorus and arsenic and 18 other higher TEs than the subsequent fraction. Cluster analysis classified patients into four distinct clusters, one sharing characteristics with the early fraction and another with the subsequent fraction. One cluster with the early fraction characteristics had significantly lower semen volume and higher pregnancy rates from spontaneous pregnancies or intrauterine insemination.

Conclusions: Classification of patients based on SP/serum ratios of multiple TEs represents the dominance of fractions of ejaculation samples.

Keywords: accessory gland; arsenic; phosphorus; split ejaculation sampling; trace element.


Conflict of interest statement

The authors declare no conflict of interest.

Figures

FIGURE 1
FIGURE 1
Comparison of sperm parameters among the nine sets of fractions of ejaculation samples. The five sets of dot plots show the semen volume, sperm concentration, motility, total sperm count, and total motile sperm count of fractions 1 and 2 in healthy volunteers. The orange and blue dots represent fractions 1 and 2, respectively, and a line connects the corresponding fractions. A paired t‐test for sperm parameters showed significant differences between fractions (*p < 0.05 and ***p < 0.001).
FIGURE 2
FIGURE 2
Scale patterns for the 20 TEs in the mean of SP/serum ratios across different fractions of ejaculation samples among healthy volunteers. The bar plot shows the mean SP/serum ratios of TEs among healthy volunteers, illustrating the scale patterns for 20 TEs and highlighting the differences between the fractions of ejaculation samples. The vertical axis represents the logarithmic scale in base 10. Elements with red and blue bars have a ratio of <1 and >1, respectively. The order of the bars ranges from fraction 1 to fraction 2 from left to right. SP, seminal plasma; TEs, trace elements.
FIGURE 3
FIGURE 3
Distribution histograms of the SP/serum ratios for various TEs among the 245 patients. The 20 histograms show the SP/serum ratio of each TE among the 245 male patients with subfertility. The horizontal axis represents the logarithmic scale in base 10. The red and blue bars indicate a ratio of <1 and >1, respectively. SP, seminal plasma; TEs, trace elements.
FIGURE 4
FIGURE 4
Consensus clustering heatmap of the SP/serum ratios of TEs. This heatmap shows the clustering results based on the SP/serum ratios of TEs from 245 male patients with subfertility. Rows represent the 20 TEs, and columns represent the SP/serum ratios of TEs in each patient. The color bar indicates that a high and low Z‐score is red and green, respectively. SP, seminal plasma; TEs, trace elements.
FIGURE 5
FIGURE 5
Features of semen quality parameters in each cluster. The five sets of bar plots show the semen volume, sperm concentration, motility, total sperm count, and total motile sperm count, respectively. They illustrate the features of these semen quality parameters across the clusters of 245 male patients with subfertility. A Wilcoxon rank‐sum test with Bonferroni correction for the parameters showed significant differences between the clusters (*p < 0.05 and **p < 0.01).
FIGURE 6
FIGURE 6
Comparison of the distributions of the SP/serum ratios of TEs between clusters 2 and 3. The 20 sets of violin plots show the comparison of the SP/serum ratio distributions for each TE between clusters 2 and 3, which were extracted from four clusters of 245 male patients with subfertility. The centerline denotes the median value (50th percentile), and the lines above and below denote the 25th–75th percentiles of the dataset. A Wilcoxon rank‐sum test for the means of the SP/serum ratios of TEs showed significant differences between the clusters (*p < 0.05 and ****p < 0.0001). SP, seminal plasma; TEs, trace elements.
FIGURE 7
FIGURE 7
Scale patterns for the 20 TEs in the mean SP/serum ratios between clusters 2 and 3. The bar plot shows the mean SP/serum ratios of TEs among clusters of interest extracted from the four clusters of 245 male patients with subfertility, illustrating the scale patterns for 20 TEs and highlighting the differences between clusters 2 and 3. The vertical axis represents the logarithmic scale in base 10. The orange and blue bars represent clusters 3 and 2, respectively. SP, seminal plasma; TEs, trace elements.
FIGURE 8
FIGURE 8
Pregnancy outcomes between each cluster. The gray and pink bars represent the total and specific pregnancy rates, respectively. Herein, specific pregnancy rates were defined as those exclusively resulting from either spontaneous pregnancy or intrauterine insemination. Analysis of the standardized residuals for the parameters showed significant differences (*p < 0.05).

Similar articles

Cited by

References

    1. Gnoth C, Godehardt E, Frank‐Herrmann P, Friol K, Tigges J, Freundl G. Definition and prevalence of subfertility and infertility. Hum Reprod. 2005;20(5):1144–1147. Epub 2005 Mar 31. - PubMed
    1. Vander Borght M, Wyns C. Fertility and infertility: definition and epidemiology. Clin Biochem. 2018;62:2–10. - PubMed
    1. Yumura Y, Tsujimura A, Imamoto T, Umemoto Y, Kobayashi H, Shiraishi K, et al. Nationwide survey of urological specialists regarding male infertility: results from a 2015 questionnaire in Japan. Reprod Med Biol. 2018;17(1):44–51. - PMC - PubMed
    1. Guzick DS, Overstreet JW, Factor‐Litvak P, Brazil CK, Nakajima ST, Coutifaris C, et al. Sperm morphology, motility, and concentration in fertile and infertile men. N Engl J Med. 2001;345(19):1388–1393. - PubMed
    1. Smits RM, Mackenzie‐Proctor R, Yazdani A, Stankiewicz MT, Jordan V, Showell MG. Antioxidants for male subfertility. Cochrane Database Syst Rev. 2019;3(3):Cd007411. - PMC - PubMed

LinkOut - more resources