. 2024 May 14:15:1330061.
doi: 10.3389/fpls.2024.1330061. eCollection 2024.

Physiological and transcriptomic analyses provide preliminary insights into the autotoxicity of Lilium brownii

Affiliations

Physiological and transcriptomic analyses provide preliminary insights into the autotoxicity of Lilium brownii

Shumin Zhong et al. Front Plant Sci. .

Abstract

Lilium brownii F. E. Brown ex Miellez var. viridulum Baker (Longya lily) is a variety of Lilium brownii F.E. Br. ex Miellez. We used HS-SPME and GC-MS to screened the tissues of L. brownii roots, stems, bulbs, and leaves and obtained 2,4-DTBP as an autotoxic substance for subsequent analysis. 2,4-DTBP was highly autotoxic in some treatment groups. Based on changes in physiological indicators, we carried out transcriptomic analysis to investigate the mechanisms of autotoxicity of substances on L. brownii and obtained 188,505 Unigenes. GO and KEGG enrichment analyses showed that L. brownii responded differently to different concentrations and treatment times of 2,4-DTBP. We observed significant changes in genes associated with ROS, phytohormones, and MAPK signaling cascades. 2,4-DTBP affects chloroplasts, the integrity of the respiratory electron transport chain, and ribosomes, causing L. brownii autotoxicity. Our findings provide a practical genomic resource for future research on L. brownii autotoxicity and evidence for the mechanism of action of autotoxic substances.

Keywords: Lilium brownii; autotoxicity; phenolic; phytohormone; reactive oxygen species (ROS); transcriptome.


Conflict of interest statement

The authors declare that the research was conducted in the absence of any commercial or financial relationships that could be construed as a potential conflict of interest.

Figures

Figure 1
Figure 1
GC-MS of L. brownii four tissues, (A) Leaf (B) Root (C) Stem (D) Bulb, and (E) Venn diagram of GC-MS analysis results for the four tissue. Effects of different concentrations of 2,4-DTBP on (F) Root length (G) Stem length (H) Germination rate of Allium ascalonicum. Values are mean ± SEM. Different letters indicate statistical differences according to ANOVA (P < 0.05).
Figure 2
Figure 2
Changes in physiological indices of hydroponically grown Lilium brownii from 9h to 120h. (A) MDA content (B) Peroxidase activity (C) Superoxide dismutase activity Values are mean + SEM. All experiments were repeated at least three times with similar results.
Figure 3
Figure 3
(A) Venn diagram of Unigene function annotation of Lilium brownii. (B) Statistical analysis of differentially expressed genes among samples of Lilium brownii. (C) Validation for the expression of selected DEGs by qPCR. The qPCR results were analyzed by an independent-sample t-test with a significance level of P<0.05.
Figure 4
Figure 4
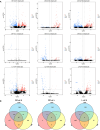
(A) Comparison of volcano plots with different concentrations at the same time. The number of DEGs in each tissue is presented and based on the significance shown in the volcano plots. The vertical dash lines in the volcano plots depict the two-fold differential expression cut-off (axis expressed as log2 values) and the horizontal dash lines shows the -log10(P-value). Dots in red (group_2 up-regulated relative to group_1) and blue (down-regulated) indicate differences in gene expression (FDR <0.05), while black dots show no differences. (B) Comparison of different treatment groups, Venn diagram of DEGs between various periods.
Figure 5
Figure 5
The enriched KEGG pathways of the DEGs. Choosing DEGs was only specifically present in various periods of the high-concentration treatment group. (A) 9h (B) 24h (C) 120h. The horizontal axis describes the name of the pathway, and the vertical axis shows the number of genes in the pathway. GO functional annotation of the DEGs. (D) 9h (E) 24h (F) 120h.
Figure 6
Figure 6
The enriched KEGG pathways of the DEGs. Choosing DEGs was only specifically present in various periods of the low-concentration treatment group. (A) 9h (B) 24h. The vertical axis describes the name of the pathway, and the horizontal axis shows the number of genes in the pathway. (C) Heatmap representing expression dynamics of genes involved in phytohormones at 9h CK vs H. group. (D) Heatmap representing expression dynamics of genes involved in Oxidative phosphorylation at 9h CK vs H. group. Heatmap representing expression dynamics of genes involved in Oxidative phosphorylation at 24h (E) CK vs H. and (F) CK vs L. group.
Figure 7
Figure 7
The enriched KEGG pathways of the DEGs. Choosing DEGs was only specifically present in various periods or treatment group. High-concentration treatment group (A–C), (A) 9-24h (B) 24-120h (C) 9-120h. Low-concentration treatment group (D–F), (D) 9-24h (E) 24-120h (F) 9-120h. Control group (G, H), (G) 24-120h (H) 9-120h.
Figure 8
Figure 8
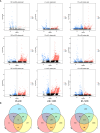
(A) Comparison of volcano plots with different periods at the same concentration. The number of DEGs in each tissue is presented and based on the significance shown in the volcano plots. The vertical dash lines in the volcano plots depict the two-fold differential expression cut-off (axis expressed as log2 values) and the horizontal dash lines shows the -log10(P-value). Dots in red (group_2 up-regulated relative to group_1) and blue (down-regulated) indicate differences in gene expression (FDR <0.05), while black dots show no differences. (B) Venn diagram of DEGs between various treatments.
Figure 9
Figure 9
Tissue culture seedlings with consistent growth of L. brownii which treatment with 0 (A–C), 0.2 (D–F) and 0.8 (H–J) g/L of 2,4-DTBP for 0, 9 and 120 hours. (K) The succinate dehydrogenase (SDH) activity of L. brownii. Values represent the mean + SEM (n=3). (L) QPCR result of DEGs in Figures 6C, D pertinent with oxidative phosphorylation and hormones pathways.

Similar articles

References

    1. Adamakis I.-D. S., Malea P., Sperdouli I., Panteris E., Kokkinidi D., Moustakas M. (2021). Evaluation of the spatiotemporal effects of bisphenol A on the leaves of the seagrass Cymodocea nodosa. J. Hazardous Materials 404, 124001. doi: 10.1016/j.jhazmat.2020.124001 - DOI - PubMed
    1. Ahuja I., Kissen R., Bones A. M. (2012). Phytoalexins in defense against pathogens. Trends Plant Sci. 17, 73–90. doi: 10.1016/j.tplants.2011.11.002 - DOI - PubMed
    1. Bahmani R., Kim D., Modareszadeh M., Thompson A. J., Park J. H., Yoo H. H., et al. . (2020). The mechanism of root growth inhibition by the endocrine disruptor bisphenol A (BPA). Environ. pollut. 257, 113516. doi: 10.1016/j.envpol.2019.113516 - DOI - PubMed
    1. Chen P., Wang Y., Liu Q., Zhang Y., Li X., Li H., et al. . (2020. a). Phase changes of continuous cropping obstacles in strawberry (Fragaria × ananassa Duch.) production. Appl. Soil Ecol. 155, 103626. doi: 10.1016/j.apsoil.2020.103626 - DOI
    1. Chen Y., Huang L., Liang X., Dai P., Zhang Y., Li B., et al. . (2020. b). Enhancement of polyphenolic metabolism as an adaptive response of lettuce (Lactuca sativa) roots to aluminum stress. Environ. pollut. 261, 114230. doi: 10.1016/j.envpol.2020.114230 - DOI - PubMed