. 2024 May 14:17:1375925.
doi: 10.3389/fnmol.2024.1375925. eCollection 2024.

Genetic deletion of zinc transporter ZnT3 induces progressive cognitive deficits in mice by impairing dendritic spine plasticity and glucose metabolism

Affiliations

Genetic deletion of zinc transporter ZnT3 induces progressive cognitive deficits in mice by impairing dendritic spine plasticity and glucose metabolism

Rui Zong et al. Front Mol Neurosci. .

Abstract

Zinc transporter 3 (ZnT3) is abundantly expressed in the brain, residing in synaptic vesicles, where it plays important roles in controlling the luminal zinc levels. In this study, we found that ZnT3 knockout in mice decreased zinc levels in the hippocampus and cortex, and was associated with progressive cognitive impairments, assessed at 2, 6, and 9-month of age. The results of Golgi-Cox staining demonstrated that ZnT3 deficiency was associated with an increase in dendritic complexity and a decrease in the density of mature dendritic spines, indicating potential synaptic plasticity deficit. Since ZnT3 deficiency was previously linked to glucose metabolism abnormalities, we tested the expression levels of genes related to insulin signaling pathway in the hippocampus and cortex. We found that the Expression of glucose transporters, GLUT3, GLUT4, and the insulin receptor in the whole tissue and synaptosome fraction of the hippocampus of the ZnT3 knockout mice were significantly reduced, as compared to wild-type controls. Expression of AKT (A serine/threonine protein kinase) and insulin-induced AKT phosphorylation was also reduced in the hippocampus of ZnT3 knockout mice. We hypothesize that the ZnT3 deficiency and reduced brain zinc levels may cause cognitive impairment by negatively affecting glycose metabolism via decreased expression of key components of insulin signaling, as well as via changes in synaptic plasticity. These finding may provide new therapeutic target for treatments of neurodegenerative disorders.

Keywords: ZnT3; dendritic plasticity; glycometabolism; spatial memory; zinc.


Conflict of interest statement

The authors declare that the research was conducted in the absence of any commercial or financial relationships that could be construed as a potential conflict of interest. The author(s) declared that they were an editorial board member of Frontiers, at the time of submission. This had no impact on the peer review process and the final decision.

Figures

Figure 1
Figure 1
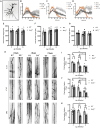
Knockout of ZnT3 in mice is associated with spatial memory deficit and cognitive inflexibility. (A) Schematic diagram of novel object recognition (NOR) and novel location recognition (NLR) tests; O1, O2, O3, and O4 designate plastic blocks of different shape used as objects. (B, C) The results of NOR (C) and NLR (D) tests performed on mice of 1-, 2-, and 9-months of age. Data are expressed as the preference index; NOR preference index: [TO3/(TO3+ TO2)] (1 Month WT males n = 7; 1 Month ZnT 3-/- males, n = 8; 1 Month WT females, n = 8; 1 Month ZnT 3-/- females, n = 5; 2 Month WT males, n = 11; 2 Month ZnT 3-/- males, n = 10; 2 Month WT females, n = 5; 2 Month ZnT 3-/- females, n = 5; 9 Month WT males, n = 5; 9 Month ZnT 3-/- males, n = 5; 9 Month WT females, n = 5; 9 Month ZnT 3-/- females, n = 8); NLR preference index: [(TO3+TO2)/(TO1+TO2+TO3+TO4)] (1 Month WT males, n = 7; 1 Month ZnT 3-/- males, n = 8; 1 Month WT females, n = 7; 1 Month ZnT 3-/- females, n = 6; 2 Month WT males, n = 11; 2 Month ZnT 3-/- males, n = 12; 2 Month WT females, n = 6; 2 Month ZnT 3-/- females, n = 5; 9 Month WT males, n = 11; 9 Month ZnT 3-/- males, n = 6; 9 Month WT females, n = 6; 9 Month ZnT 3-/- females, n = 12). Here and everywhere mean data are presented as mean ± S.E.M. **, *** and ## Denote significant difference between groups indicated by the connector lines, p < 0.01 or p < 0.001, two-way ANOVA with LSD post-hoc test. (D) Schematic diagram of the Y-maze test (spontaneous alteration test). (E) The result of Y-maze test. Data are expressed as the memory index [the number of alternations/(the total number of arm entries −2)] (1 Month WT males, n = 7; 1 Month ZnT 3-/- males, n = 8; 1 Month WT females, n = 7; 1 Month ZnT 3-/- females, n = 6; 2 Month WT males, n = 5; 2 Month ZnT 3-/- males, n = 5; 2 Month WT females, n = 6; 2 Month ZnT 3-/- females, n = 7; 9 Month WT males, n = 10; 9 Month ZnT 3-/- males, n = 6; 9 Month WT females, n = 5; 9 Month ZnT 3-/- females, n = 6). ** Denote significant difference between groups indicated by the connector lines, p < 0.01, two-way ANOVA with LSD post-hoc test.
Figure 2
Figure 2
Knockout of ZnT3 in mice is associated with spatial reference memory deficit. (A) Morris water maze (MWM) performance. Escape latency during the acquisition trials for five consecutive days (WT males, n = 8; ZnT 3-/- males, n = 9; WT females, n = 7; ZnT 3-/- females, n = 9). *, **, *** Denote significant difference between time-matched WT and ZnT 3-/- groups, p < 0.05, p < 0.01, or p < 0.001, two-way ANOVA with LSD post-hoc test. (B) Representative tracing images of swimming trajectories the MWM probe trial for male of female ZnT 3-/- and WT mice. The position of the target platform is indicated with a red circle. (C, D) Analysis of the MWM tests (WT males, n = 5; ZnT 3-/- males, n = 6; WT females, n = 6; ZnT 3-/- females, n = 7). (C) Time spent within the area formerly occupied by the platform during the probe trial (as a percentage of the total trial time). (D) Counts of entries into the platform area during the probe trial. (E) Swim speed during the probe trial. ** Denotes significant difference between groups indicated by the connector lines, p < 0.01, two-way ANOVA with LSD post-hoc test. (F) The results of open field test, analyzed as distance traveled in the central zone (as percentage of total distance traveled). &&&& Denotes significant difference between groups indicated by the connector lines, p < 0.0001, two-way ANOVA with LSD post-hoc test.
Figure 3
Figure 3
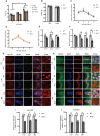
ZnT3 deletion is associated with increased dendrite complexity and reduced spine density in the hippocampus. (A) Diagram showing Sholl analyses to quantify dendrite length and complexity. Scale bar, 50 μm. (B–D) Statistical analysis for the number of intersections in CA1 (B), CA3 (C) and DG (D) of hippocampus. Two- and 9-month-old mice of both genders were analyzed (WT 2 M group, n = 7; ZnT 3-/- 2 M group, n = 6; WT 9 M group, n = 6; ZnT 3-/- 9 M group, n = 6). *, ** Denote significant difference of number of intersections between radius (μm)-matched WT and ZnT 3-/- groups, p < 0.05 or p < 0.01, two-way ANOVA with LSD post-hoc test. (E–G) Statistical analysis of the total dendritic length in CA1 (E), CA3 (F), and DG (G) of hippocampus. No significant difference was found (Two-way ANOVA with LSD post-hoc test). (H) Example Golgi staining images of dendritic spines in CA1, CA3 and DG of hippocampus of 1-month-old, 2-months-old, and 9-months-old mice. Scale bar, 5 μm. (I–K) Statistical analysis of dendritic spine density from images as these shown in H in CA1 (I), CA3 (J), and DG (K) regions of hippocampus. *, **, ***, **** and #, ##, #### Denote significant difference between groups indicated by the connector lines, p < 0.05, p < 0.01, p < 0.001, or p < 0.0001, two-way ANOVA with LSD post-hoc test.
Figure 4
Figure 4
Analysis of the effect of ZnT3 knockout on the densities of different types of dendritic spines in the hippocampus. (A) Example image showing classification of spines. Scale bar, 2.5 μm. (B–D) Statistical analysis for Golgi staining images of different types of spines in CA1 (B), CA3 (C), and DG (D) regions of hippocampus. Two- and 9-month-old mice, male and female mice were analyzed. *, **, ***, **** Denote significant difference between groups indicated by the connector lines, p < 0.05, p < 0.01, p < 0.001, or p < 0.0001, two-way ANOVA with LSD post-hoc test.
Figure 5
Figure 5
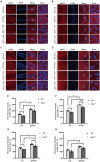
ZnT3 deletion is associated with a significant impairment of insulin signaling in the hippocampus. (A) Body mass analysis of ZnT 3-/- and WT mice. *, ### Denote significant difference between groups indicated by the connector lines, p < 0.05, p < 0.001, two-way ANOVA with LSD post-hoc test. (B) Brain weight analysis of ZnT 3-/- and WT mice. Two-way ANOVA with LSD post-hoc test. (C, D) The blood glucose levels in male (C) and female (D) mice (ZnT 3-/-; and WT) after fasting; n = 6 for both ZnT 3-/- and n = 5 for both WT groups. Two-way ANOVA with LSD post-hoc test. (E, F) mRNA expression levels of Slc2a1 (GLUT1), Slc2a3 (GLUT3), and Slc2a4 (GLUT4) in cortex (E); and Slc2a1 (GLUT1), Slc2a3 (GLUT3), and Slc2a4 (GLUT4) and Insr (INSR) in hippocampus (F). Expression levels are normalized to housekeeping gene Gapdh. * Denotes significant difference between groups indicated by the connector lines, p < 0.05, Mann-Whitney test. (G, H) Immunofluorescence staining of hippocampal sections of 9-months old mice. (G): GLUT3-(red), DAPI-(blue) and GFAP (green). (H): GLUT4-(green), DAPI-(blue) and NeuN (red). Scale bar, 50 μm; Zoom Scale bar, 5 μm. (I, J) Statistical analysis of images as those shown in (G) and (H). * Denotes significant difference between groups indicated by the connector lines, p < 0.05, Mann-Whitney test.
Figure 6
Figure 6
Deletion of ZnT3 impairs insulin-related signaling in hippocampus. (A–D) Immunofluorescence staining of hippocampal sections of 9-months old mice after intraperitoneal injection of insulin glargine (2 IU/kg i.p.; see Methods for detail). pAKT-(red), DAPI-(blue). (A): CA1, (B): CA3, (C): DG, and (D): cortex. Scale bar, 50 μm; Zoom Scale bar, 5 μm. (E–H) Statistical analysis of images as those shown in (A–D). *, *** and ##, ### Denote significant difference between groups indicated by the connector lines, p < 0.05, p < 0.01, or p < 0.001 (for single, double and triple symbols, respectively) two-way ANOVA with LSD post-hoc test.
Figure 7
Figure 7
Summary of the observed and proposed effects of ZnT3 deficiency in the brain.

Similar articles

Cited by

References

    1. Adlard P. A., Parncutt J. M., Finkelstein D. I., Bush A. I. (2010). Cognitive loss in zinc transporter-3 knock-out mice: a phenocopy for the synaptic and memory deficits of Alzheimer's disease? J. Neurosci. 30, 1631–1636. 10.1523/JNEUROSCI.5255-09.2010 - DOI - PMC - PubMed
    1. Alsharif A. A., Wei L., Ma T., Man K. K. C., Lau W. C. Y., Brauer R., et al. . (2020). Prevalence and incidence of dementia in people with diabetes mellitus. J. Alzheimer's Dis. 75, 607–615. 10.3233/JAD-191115 - DOI - PubMed
    1. Andrikopoulos S., Blair A. R., Deluca N., Fam B. C., Proietto J. (2008). Evaluating the glucose tolerance test in mice. Am. J. Physiol. Endocrinol. Metab. 295, E1323–1332. 10.1152/ajpendo.90617.2008 - DOI - PubMed
    1. Ansari M. A., Al-Jarallah A., Babiker F. A. (2023). Impaired insulin signaling alters mediators of hippocampal synaptic dynamics/plasticity: a possible mechanism of hyperglycemia-induced cognitive impairment. Cells 12:1728. 10.3390/cells12131728 - DOI - PMC - PubMed
    1. Apelt J., Mehlhorn G., Schliebs R. (1999). Insulin-sensitive GLUT4 glucose transporters are colocalized with GLUT3-expressing cells and demonstrate a chemically distinct neuron-specific localization in rat brain. J. Neurosci. Res. 57, 693–705. 10.1002/(SICI)1097-4547(19990901)57:5<693::AID-JNR11>3.0.CO;2-X - DOI - PubMed

LinkOut - more resources