. 2024 May 14:11:1342476.
doi: 10.3389/fmed.2024.1342476. eCollection 2024.

Multiple treatment interruptions and protecting HIV-specific CD4 T cells enable durable CD8 T cell response and viral control

Affiliations

Multiple treatment interruptions and protecting HIV-specific CD4 T cells enable durable CD8 T cell response and viral control

Anshika Jain et al. Front Med (Lausanne). .

Abstract

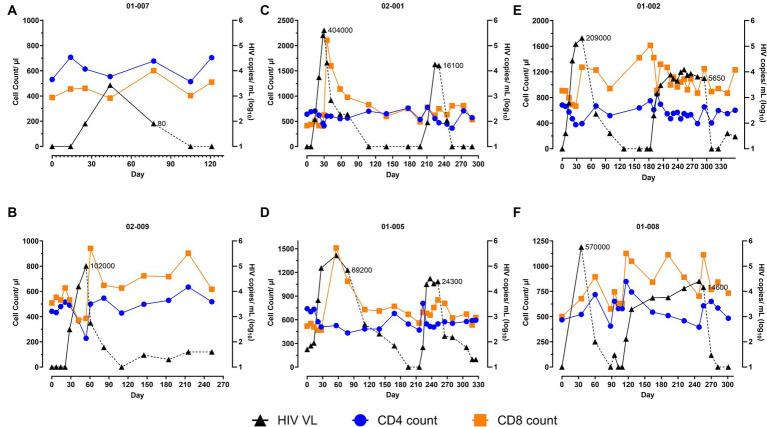
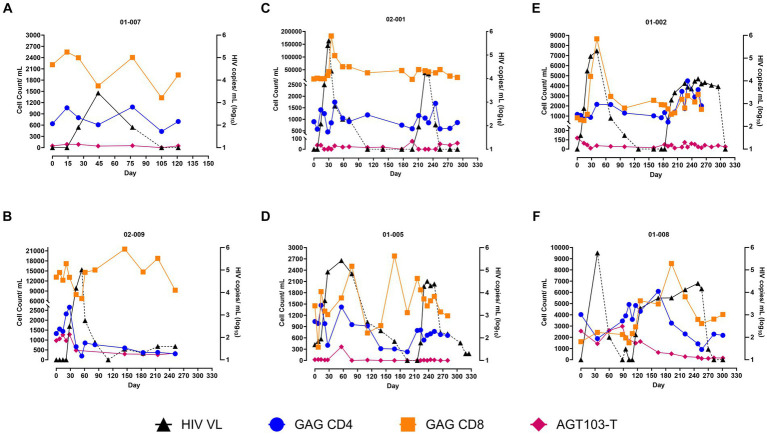
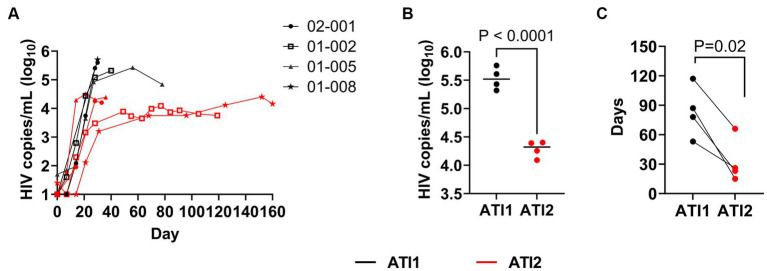
Human Immunodeficiency Virus (HIV) remains a global health challenge, and novel approaches to improve HIV control are significantly important. The cell and gene therapy product AGT103-T was previously evaluated (NCT04561258) for safety, immunogenicity, and persistence in seven patients for up to 180 days post infusion. In this study, we sought to investigate the impact of AGT103-T treatment upon analytical treatment interruptions (ATIs). Six patients previously infused with AGT103-T were enrolled into an ATI study (NCT05540964), wherein they suspended their antiretroviral therapy (ART) until their viral load reached 100,000 copies/mL in two successive visits, or their CD4 count was reduced to below 300 cells/μL. During the ATI, all patients experienced viral rebound followed by a notable expansion in HIV specific immune responses. The participants demonstrated up to a five-fold increase in total CD8 counts over baseline approximately 1-2 weeks followed by the peak viremia. This coincided with a rise in HIV-specific CD8 T cells, which was attributed to the increase in antigen availability and memory recall. Thus, the protocol was amended to include a second ATI with the first ATI serving as an "auto-vaccination." Four patients participated in a second ATI. During the second ATI, the Gag-specific CD8 T cells were either maintained or rose in response to viral rebound and the peak viremia was substantially decreased. The patients reached a viral set point ranging from 7,000 copies/mL to 25,000 copies/mL. Upon resuming ART, all participants achieved viral control more rapidly than during the first ATI, with CD4 counts remaining within 10% of baseline measurements and without any serious adverse events or evidence of drug resistance. In summary, the rise in CD8 counts and the viral suppression observed in 100% of the study participants are novel observations demonstrating that AGT103-T gene therapy when combined with multiple ATIs, is a safe and effective approach for achieving viral control, with viral setpoints consistently below 25,000 copies/mL and relatively stable CD4 T cell counts. We conclude that HIV cure-oriented cell and gene therapy trials should include ATI and may benefit from designs that include multiple ATIs when induction of CD8 T cells is required to establish viral control.

Keywords: AGT103-T; CCR5; CD4 /CD8 lymphocytes + +; Human Immunodeficiency Virus (HIV); cell and gene therapy (CGT); immunotherapy.


Conflict of interest statement

Authors AJ, GC, M-LL, EF, AC, LX, IM, BB, HH-V, JG, MC, and JeB are shareholders and current employees of American Gene Technologies International, Inc. Authors PK and JoB received funding for the costs of the clinical trial from American Gene Technologies International, Inc.

Figures

Figure 1
Figure 1
Two analytical treatment interruptions (ATIs) enable viral suppression in AGT103-T treated participants. (A–F) These figures illustrate the impact of (A,B) one ATI or (C–F) two ATIs on viral rebound and immune parameters (total CD4 and CD8 T cell counts) in six participants. The participant IDs are indicated above each figure. Participants who were previously infused with AGT103-T, underwent one or two ATIs 99–490 days after the infusion. Day 0 is referred to as the first day of the ATI after ART cessation. Viral load (VL) is represented on the right-hand Y-axis and total CD4 and CD8 T cell counts are represented on the left-hand Y-axis as measured at the indicated timepoints. Participant 01-008 self-initiated his first ATI during the previous safety study. Participant 01-007 self-ceased their ART 77 days prior to their enrollment and exhibited viral control for a total of 91 days (pre-enrollment data is not shown here). The VL (HIV copies/mL) at which the participants resumed ART are indicated along the viral load curve in each graph. HIV viral copies measured in plasma are represented by black triangles (copies/mL Log10), solid black line corresponds to ATI, dashed black line corresponds to ART; blue circles represent CD4 cells (count / μL of blood); orange squares represent CD8 cell (counts/μL of blood). Loss of sample due to blood clotting or scheduling conflicts were encountered on several occasions. Samples from days 128, 176, and 218 from patient 01-002; Day 7 from patient 01-007 and Day 109 for patient 01-008 were lost due to blood coagulation or scheduling issues. Additionally, samples from days 7, 14, and 21 were not collected from 01-008 because the 1st ATI was self-initiated.
Figure 2
Figure 2
Persistence of AGT103-T and HIV Gag-Specific CD4 and CD8 T cells in circulation. (A–F) Counts of AGT103-T cells, Gag-specific CD4 and Gag-specific CD8 T cells (left -y-axis) detected per mL of blood at various time points (x-axis) along with the viral load (right-y-axis) are plotted for each of the six participants. The participant IDs are indicated above each figure. The modified cells were assessed by measuring the number of copies of the transgene in cells encoding WPRE, a sequence unique to the lentivirus transduced in the modified cells; Missing data: 02-009 (days 54, 61, 82, 110), 02-001 (day 0), 01-002 (days 0,7, 70, 183, 225), 01-005 (days 307, 318, 325), 01-008 (0, 7, 14, 21, 102, 109) due to failure to meet sample input requirements. HIV-specific immune response was counted by measuring the Gag-specific CD4 and CD8 T cells by intracellular cytokine staining (ICS) assay in six participants; Missing data: 02-009 (day110), 02-001 (day 139), 01-002 (days 128, 239), 01-008 (60, 270) were due to sample unavailability or technical issues with the assay. Black triangles correspond to the HIV viral copies in plasma (copies /mL Log10); solid black line corresponds to ATI; dashed black line corresponds to ART; blue circles represent Gag-specific CD4 cell count/mL of blood; orange squares represent Gag-specific CD8 cell count/mL of blood; pink diamonds represent AGT103-T cells.
Figure 3
Figure 3
Impact of multiple ATIs and AGT103-T treatment on viral suppression. (A) Viral rebound during first (black lines) and second ATI (red lines) in four patients, 01-002, 01-005, 01-008 and 02-001. Each participant’s viral load (Log10HIV copies/mL) trajectory from the two ATIs are superimposed to provide a common temporal view of the viral rebound from time (days, x-axis) of each ATI initiation. (B) Maximum peak viremia attained by each participant during the first (black) and second (red) ATI before resuming ART (p < 0.0001). The black bar in each dataset represents the median of the four peak viremia values during each ATI. (C) Comparison of number of days required by each participant to reach ≤20 copies/mL levels of viremia after the first ATI (black) and the second ATI (red) (p = 0.02). Student t-test (two-tailed) was performed to calculate the p-value.

References

    1. Sung JA, Lam S, Garrido C, Archin N, Rooney CM, Bollard CM, et al. . Expanded cytotoxic T-cell lymphocytes target the latent HIV reservoir. J Infect Dis. (2015) 212:258–63. doi: 10.1093/infdis/jiv022, PMID: - DOI - PMC - PubMed
    1. Rosenberg ES, Altfeld M, Poon SH, Phillips MN, Wilkes BM, Eldridge RL, et al. . Immune control of HIV-1 after early treatment of acute infection. Nature. (2000) 407:523–6. doi: 10.1038/35035103 - DOI - PubMed
    1. Walker B, McMichael A. The T-cell response to HIV. Cold Spring Harb Perspect Med. (2012) 2:a007054. doi: 10.1101/cshperspect.a007054 - DOI - PMC - PubMed
    1. Douek DC, Brenchley JM, Betts MR, Ambrozak DR, Hill BJ, Okamoto Y, et al. . HIV preferentially infects HIV-specific CD4+ T cells. Nature. (2002) 417:95–8. doi: 10.1038/417095a - DOI - PubMed
    1. Wooldridge L, Sewell A. HIV strategically targets HIV-specific T cells. Trends Immunol. (2002) 23:474. doi: 10.1016/S1471-4906(02)02312-8 - DOI