. 2024 Jul 8;52(12):7063-7080.
doi: 10.1093/nar/gkae457.

PHF2 regulates genome topology and DNA replication in neural stem cells via cohesin

Affiliations

PHF2 regulates genome topology and DNA replication in neural stem cells via cohesin

Jia Feng et al. Nucleic Acids Res. .

Abstract

Cohesin plays a crucial role in the organization of topologically-associated domains (TADs), which influence gene expression and DNA replication timing. Whether epigenetic regulators may affect TADs via cohesin to mediate DNA replication remains elusive. Here, we discover that the histone demethylase PHF2 associates with RAD21, a core subunit of cohesin, to regulate DNA replication in mouse neural stem cells (NSC). PHF2 loss impairs DNA replication due to the activation of dormant replication origins in NSC. Notably, the PHF2/RAD21 co-bound genomic regions are characterized by CTCF enrichment and epigenomic features that resemble efficient, active replication origins, and can act as boundaries to separate adjacent domains. Accordingly, PHF2 loss weakens TADs and chromatin loops at the co-bound loci due to reduced RAD21 occupancy. The observed topological and DNA replication defects in PHF2 KO NSC support a cohesin-dependent mechanism. Furthermore, we demonstrate that the PHF2/RAD21 complex exerts little effect on gene regulation, and that PHF2's histone-demethylase activity is dispensable for normal DNA replication and proliferation of NSC. We propose that PHF2 may serve as a topological accessory to cohesin for cohesin localization to TADs and chromatin loops, where cohesin represses dormant replication origins directly or indirectly, to sustain DNA replication in NSC.


Figures

Graphical Abstract
Graphical Abstract
Figure 1.
Figure 1.
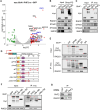
PHF2 proximity proteomics identify new interactions between PHF2 and cohesin complex. (A) Volcano plot showing the proteins which were enriched in the PHF2 vs GFP proximal proteomes. (B-C) Western blot analysis of cohesin complex subunits (RAD21, STAG1, STAG2 and SMC3) in the streptavidin pulldown lysates (B) or myc immunoprecipitates (IP) (C) of HEK293T cells transfected with myc-BirA*-PHF2 or GFP. The correct PHF2 bands are indicated with red *. (D) Structure of human PHF2 protein and the variants used in the protein interaction analysis. (E, F) Western blot analysis of RAD21 in the myc IP using lysates of HEK293T cells that were transfected with the indicated PHF2 constructs. The correct PHF2 bands are indicated with red *. (G) Western blot analysis of RAD21 protein in the PHF2 IP using mouse NSC lysates.
Figure 2.
Figure 2.
Characterization of NSC-specific PHF2 cKO mouse embryo. (A) Coronal cortical sections of E13.5 control and PHF2 cKO embryonic brains stained for Sox2, Tuj1 and EdU, 2 hours post EdU administration. Thickness of cortical plates is marked by Tuj1 staining as shown by the yellow double-sided arrows. (B, C) Quantification of total (Sox2+) and proliferating (Sox2+EdU+) mouse NSCs in the neocortices of E13.5 PHF2 cKO embryonic brains when compared to controls (n = 5 mice, 3–4 sections per brain). (D) Coronal cortical sections of E13.5 control and PHF2 cKO embryonic brains stained for intermediate progenitor cells (IPCs) marker Tbr2 and proliferating cell tracing marker EdU. Brains were collected 2 h following EdU injection. (E, F) Quantification of intermediate progenitor cells (Tbr2+) and proliferating intermediate progenitor cells (Tbr2+EdU+) in the neocortices of E13.5 PHF2 cKO embryos compared to controls (n = 5 mice, 3–4 sections per brain). (G) The measurement of cortical plate thickness in PHF2 cKO embryonic brains compared to controls (n = 5, 3–4 sections per brain). (H) Coronal cortical sections of E13.5 control and PHF2 cKO embryonic brains stained for Sox2 and γH2AX. (I) Quantification of γH2AX foci in mouse NSC (Sox2+) in the neocortices of E13.5 PHF2 cKO embryonic brains when compared to controls (n = 5 mice, 3–4 sections per brain).
Figure 3.
Figure 3.
PHF2 mediates DNA replication in mouse NSC, in a histone demethylase–independent manner. (A) Western blot analysis of PHF2 and RAD21 in PHF2 intact, PHF2 KO, PHF2 KO + PHF2, and PHF2 KO + H249A mouse NSC. β-actin serves as loading control. (B, C) Confocal images and quantification of the relative intensity of H3K9me3 in PHF2 intact, PHF2 KO, PHF2 KO + PHF2, and PHF2 KO + H249A mouse NSC. (D) Representative confocal images of DNA fiber assay of PHF2 intact, PHF2 KO, PHF2 KO + PHF2, and PHF2 KO + H249A mouse NSC. (E) Quantification of fork rate of PHF2 intact, PHF2 KO, PHF2 KO + PHF2, and PHF2 KO + H249A mouse NSC. Fork rate (kb/min) was determined by measuring CldU (red) track length (n = 100) over 20 minutes. (F) Quantification of fork symmetry of PHF2 intact, PHF2 KO, PHF2 KO + PHF2 and PHF2 KO + H249A mouse NSC. Fork symmetry was determined by measuring the ratio of ldU (green) and CldU (red) track length (n = 100). (G, H) Confocal images and quantification of γH2AX foci in PHF2 intact, PHF2 KO, PHF2 KO + PHF2, and PHF2 KO + H249A mouse NSC.
Figure 4.
Figure 4.
DNA replication defect in PHF2 KO NSC is due to activation of dormant origins. (A) Western blot analysis of MCM2, CDC6, and ORC2 levels in the total cell extracts, soluble extracts, and chromatin extracts isolated from PHF2 intact, PHF2 KO, PHF2 KO + PHF2, and PHF2 KO + H249A mouse NSCs. PHF2 serves as positive control. β-actin and H3 serve as markers for the soluble and chromatin extracts, respectively. (B, C) Representative images and quantification of EdU labelling in PHF2 intact, PHF2 KO, PHF2 KO + PHF2 and PHF2 KO + H249A mouse NSCs. PHF2 overexpressing cells are indicated by the yellow arrows. Scale bar: 20 μm. (D) Western blot analysis of p-MCM2S40 and MCM2 levels in mouse NSCs with or without PHA-767491 treatment (60μM, 8hrs). (E–G) WT or PHF2 KO mouse NSCs were pre-treated with or without 60μM PHA-767491 for 8 hours, and then labeled with CIdU and IdU before cell harvesting. Fork rate was measured for individual replication forks presented in a scatterplot (F). Representative images of single DNA fibers are shown in (E). Scale bar, 10 μm. n > 125. % of active origins for individual replication forks presented in a scatterplot (G) (n > 5). (H) Western blot analysis of p-CHK1 and CHK1 levels in PHF2 intact, PHF2 KO, PHF2 KO + PHF2, and PHF2 KO + H249A mouse NSCs. HU treatment (3mM, 2hrs) serves as a positive control for p-CHK1 levels. PHF2 and vinculin serve as positive and loading controls, respectively.
Figure 5.
Figure 5.
PHF2 facilitates RAD21 binding to PHF2/RAD21 co-bound sites, which are CTCF-enriched and resemble efficient replication origins. (A, B) Heatmaps indicating the PHF2-only, PHF2/RAD21 co-bound, and RAD21-only clusters and their CTCF binding profiles. (C) Overlap between PHF2 and RAD21 peaks in mouse NSCs, representing 816 co-bound peaks. (D) Histogram plot for the distance to TSS for all PHF2/RAD21 co-bound peaks. (E) Bar plot displaying the overlaps of co-bound, PHF2-only and RAD21-only peaks with CTCF peaks. All bars are represented as fractions of the total peaks in each category. (F) ChromHMM chromatin segment analysis representing emission states with differential enrichment profiles for PHF2, RAD21, CTCF, RING1B, EZH2, H3K27me3, H3K27Ac and H3K4me3. (G) Western blot analysis of RAD21, STAG1, and STAG2 in WT and PHF2 KO mouse NSCs. PHF2 and vinculin serve as positive and loading controls, respectively. (H) ChIP-qPCR analysis of PHF2 and RAD21 occupancy at the promoters of Tubb2b, Fn1, Lrrc4c, Nudt5 and Ccng2 from WT and PHF2 KO mouse NSCs. The fold-change was normalized to WT control. Two-sided t-test. (I) IGV browser view of PHF2 and RAD21 ChIP-seq peaks at the promoters of Tubb2b and Fn1.
Figure 6.
Figure 6.
PHF2 KO mouse NSCs show weakened TADs at PHF2/RAD21 co-bound regions. (A) Pileup plots of Hi-C signal on TADs for both WT and PHF2 KO mouse NSCs. Value of central pixel was displayed. 10 kilobase resolution of the Hi-C data was used to plot the enrichment of interactions. (B) Average profile of insulation score of genome-wide TAD boundaries before and after PHF2 KO. (C) Pileup plots showing local interaction, relative to randomize average genome wide interactions, around the PHF2/RAD21 co-bound regions using Hi-C data from mouse NSC. (D) Bar plot displaying the overlaps of co-bound, PHF2-only and RAD21-only peaks with TADs. All bars are represented as fractions of the total peaks in each category. (E) Average profile of insulation score in PHF2/RAD21 co-bound, PHF2-only, and RAD21-only peaks with and without PHF2 KO.
Figure 7.
Figure 7.
The PHF2/RAD21 complex does not contribute towards gene regulation in mouse NSC. (A) Gene Ontology (GO) analysis of downregulated and upregulated genes upon PHF2 KO in mouse NSC (FC ≥ 1.5, adjusted P value < 0.05). (B) Venn diagrams showing the number of overlapped genes between the differentially expressed genes upon PHF2 KO and genes containing PHF2 occupancy at their promoters. (C) GO analysis with common genes from (B). (D) GO analysis of genes with downregulated chromatin loops upon PHF2 KO. (E) Venn diagram showing the overlap between downregulated loops-enriched genes, PHF2 KO-associated downregulated genes, and RAD21 KD-associated downregulated genes. (F) Venn diagram showing the overlap between Supplementary Figure S5D and (E). (G) Pyramid chromatin contact matrix heatmaps were shown around Nrp2 that survived the overlap in (F). A zoom in of the region-of-interest marking loss of ‘corner peak’ for Nrp2 in PHF2 KO mouse NSC is shown on the right.
Figure 8.
Figure 8.
Human cortical organoids reveal that PHF2 promotes NPC proliferation in a histone demethylase-independent manner. (A) Brightfield images of cortical spheroids at the indicated time points during the course of differentiation. (B) Quantification of spheroid areas in PHF2 intact, PHF2 KO, PHF2 KO + PHF2 and PHF2 KO + H249A spheroids (n = 24). (C, D) Confocal images and quantification of the number of NSCs (SOX2+) in PHF2 intact, PHF2 KO, PHF2 KO + PHF2, and PHF2 KO + H249A spheroids (n = 6). (E, F) Confocal images and quantification of the number of proliferating NSCs (Ki67+) in PHF2 intact, PHF2 KO, PHF2 KO + PHF2 and PHF2 KO + H249A spheroids (n = 6). (G, H) Confocal images and quantification of the number of lumen (ZO-1+) in PHF2 intact, PHF2 KO, PHF2 KO + PHF2 and PHF2 KO + H249A spheroids (n = 6). Box shows the magnified view of neuroepithelial structure.

References

    1. Nasmyth K., Haering C.H.. Cohesin: its roles and mechanisms. Annu. Rev. Genet. 2009; 43:525–558. - PubMed
    1. Litwin I., Pilarczyk E., Wysocki R.. The emerging role of cohesin in the DNA damage response. Genes (Basel). 2018; 9:581. - PMC - PubMed
    1. Waldman T. Emerging themes in cohesin cancer biology. Nat. Rev. Cancer. 2020; 20:504–515. - PubMed
    1. Peters J.M., Tedeschi A., Schmitz J.. The cohesin complex and its roles in chromosome biology. Genes Dev. 2008; 22:3089–3114. - PubMed
    1. Wutz G., Varnai C., Nagasaka K., Cisneros D.A., Stocsits R.R., Tang W., Schoenfelder S., Jessberger G., Muhar M., Hossain M.J.et al. .. Topologically associating domains and chromatin loops depend on cohesin and are regulated by CTCF, WAPL, and PDS5 proteins. EMBO J. 2017; 36:3573–3599. - PMC - PubMed

MeSH terms