. 2024 Jun 18;9(6):e0084723.
doi: 10.1128/msystems.00847-23. Epub 2024 May 29.

The phage shock protein (PSP) envelope stress response: discovery of novel partners and evolutionary history

Affiliations

The phage shock protein (PSP) envelope stress response: discovery of novel partners and evolutionary history

Janani Ravi et al. mSystems. .

Abstract

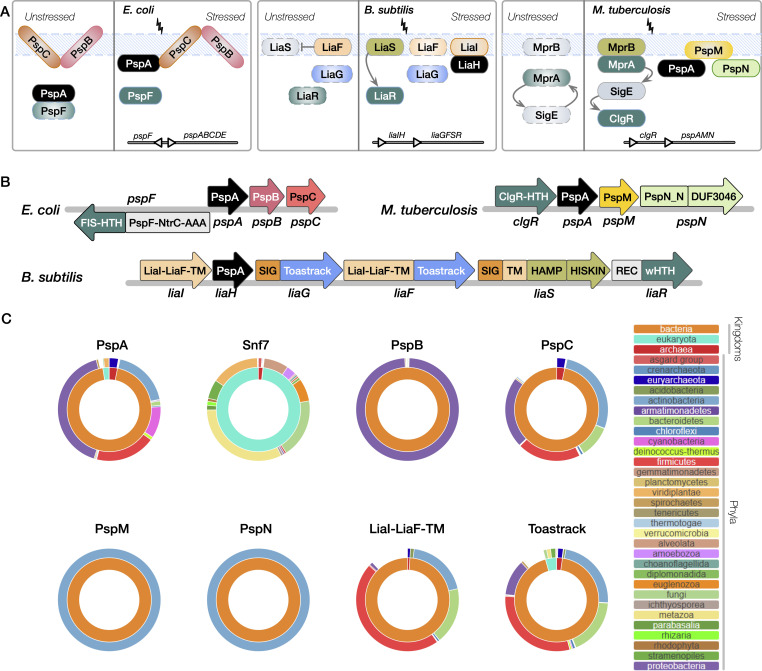
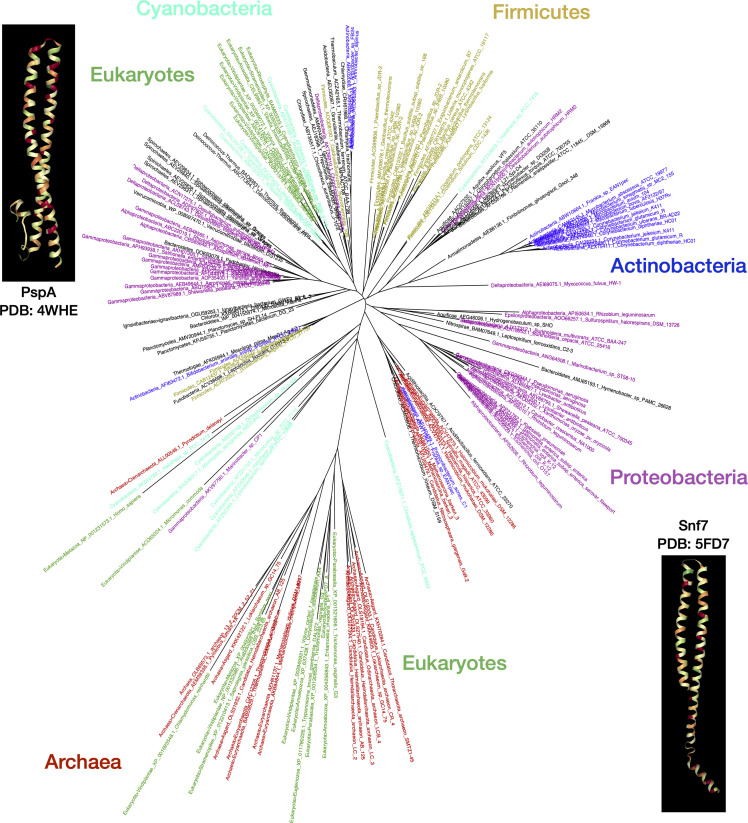
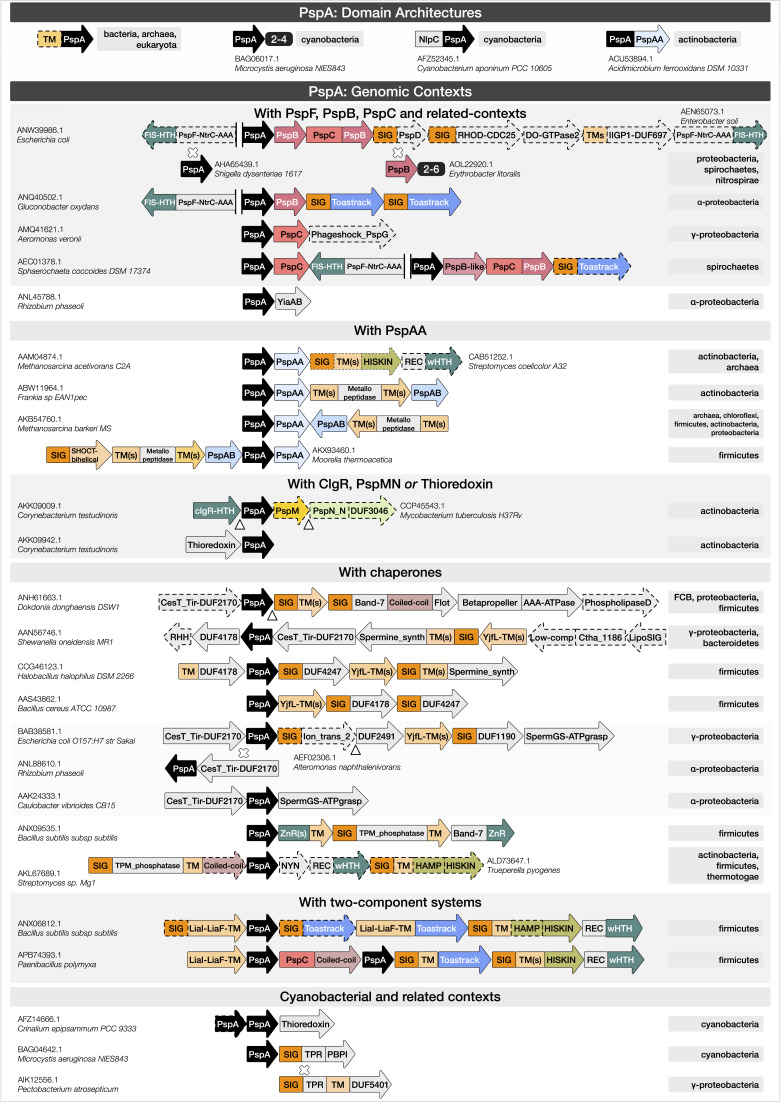
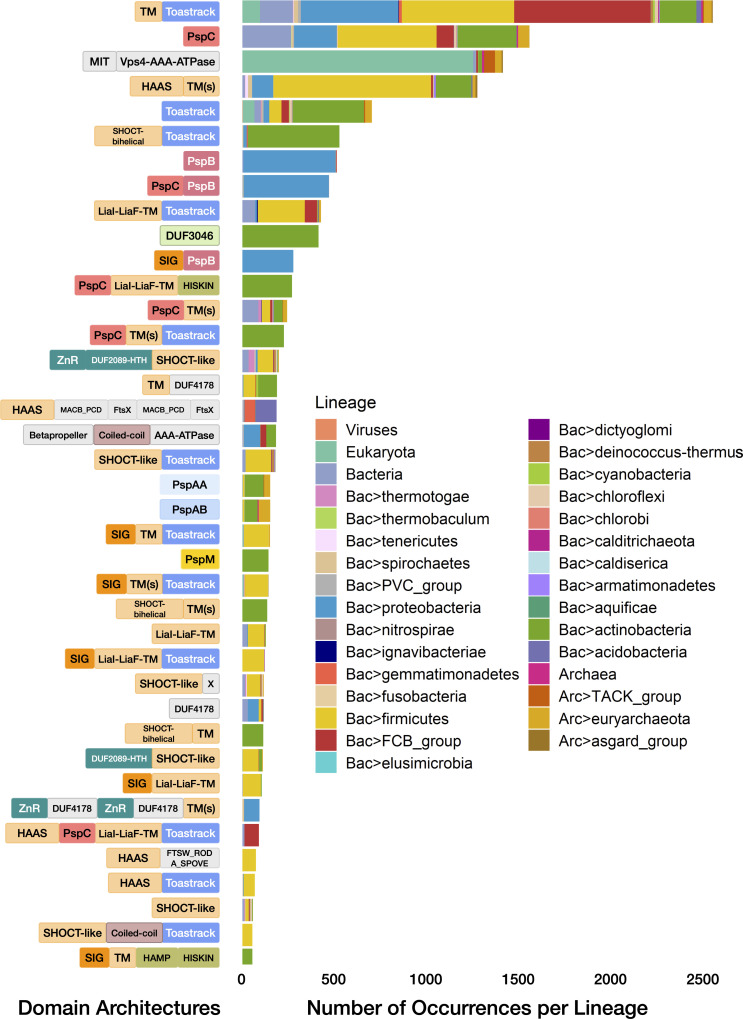
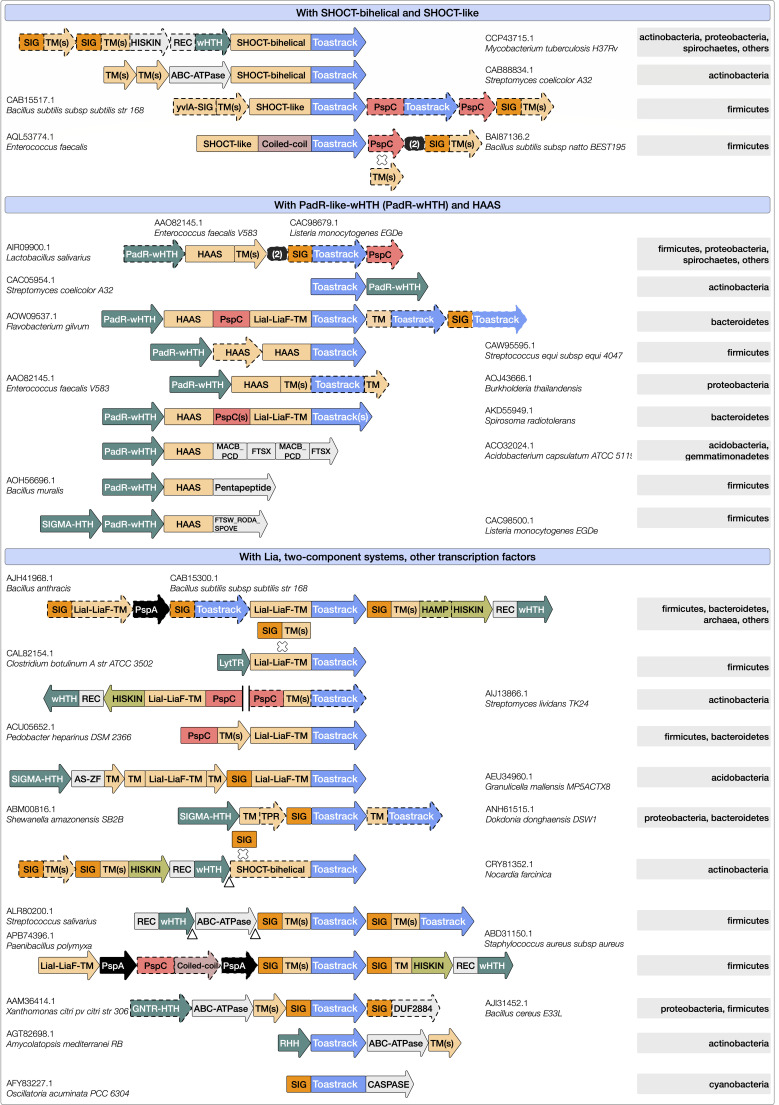
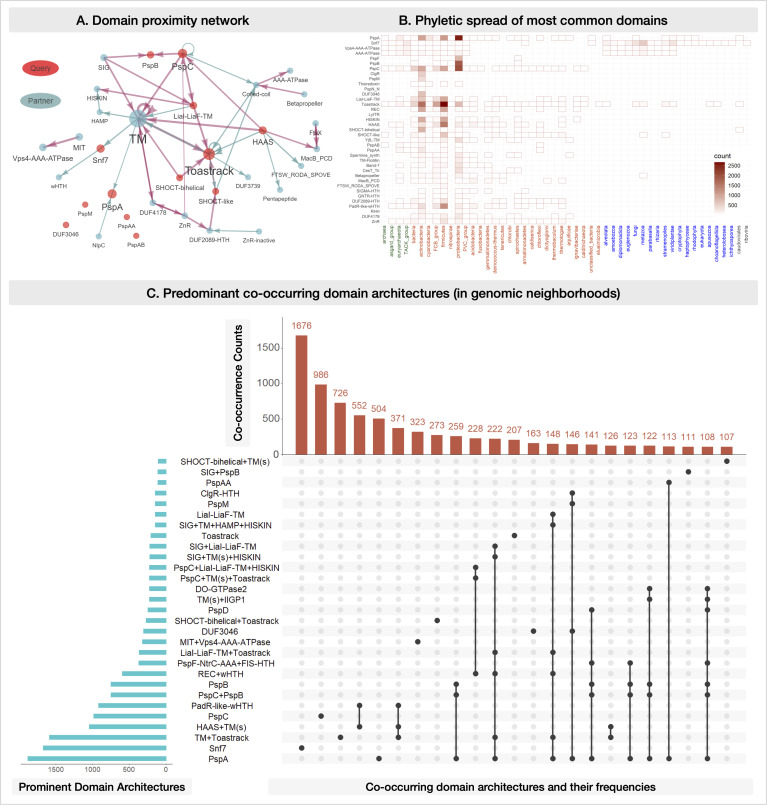
Bacterial phage shock protein (PSP) systems stabilize the bacterial cell membrane and protect against envelope stress. These systems have been associated with virulence, but despite their critical roles, PSP components are not well characterized outside proteobacteria. Using comparative genomics and protein sequence-structure-function analyses, we systematically identified and analyzed PSP homologs, phyletic patterns, domain architectures, and gene neighborhoods. This approach underscored the evolutionary significance of the system, revealing that its core protein PspA (Snf7 in ESCRT outside bacteria) was present in the last universal common ancestor and that this ancestral functionality has since diversified into multiple novel, distinct PSP systems across life. Several novel partners of the PSP system were identified: (i) the Toastrack domain, likely facilitating assembly of sub-membrane stress-sensing and signaling complexes, (ii) the newly defined HTH-associated α-helical signaling domain-PadR-like transcriptional regulator pair system, and (iii) multiple independent associations with ATPase, CesT/Tir-like chaperone, and Band-7 domains in proteins thought to mediate sub-membrane dynamics. Our work also uncovered links between the PSP components and other domains, such as novel variants of SHOCT-like domains, suggesting roles in assembling membrane-associated complexes of proteins with disparate biochemical functions. Results are available at our interactive web app, https://jravilab.org/psp.IMPORTANCEPhage shock proteins (PSP) are virulence-associated, cell membrane stress-protective systems. They have mostly been characterized in Proteobacteria and Firmicutes. We now show that a minimal PSP system was present in the last universal common ancestor that evolved and diversified into newly identified functional contexts. Recognizing the conservation and evolution of PSP systems across bacterial phyla contributes to our understanding of stress response mechanisms in prokaryotes. Moreover, the newly discovered PSP modularity will likely prompt new studies of lineage-specific cell envelope structures, lifestyles, and adaptation mechanisms. Finally, our results validate the use of domain architecture and genetic context for discovery in comparative genomics.

Keywords: PSP; comparative genomics; domain architectures; envelope stress response; genomic contexts and neighborhoods; molecular evolution; phage shock protein response; phylogeny.


Conflict of interest statement

The authors declare no conflict of interest.

Figures

Fig 1
Fig 1
The phyletic spread of classical PSP members across all major lineages. (A) The three classical PSP systems in E. coli (pspF||pspABC), M. tuberculosis (clgRpspAMN), and B. subtilis (liaIHGFSR) are shown. Proteins across three bacterial PSP systems are labeled, and colors uniformly (across all figures that show domain architectures) indicate the nature of the protein; black, PspA homolog (e.g., PspA and LiaH); teal, transcription factor/response regulator (e.g., PspF, LiaR, MprA, and ClgR) along with partner histidine kinases in olive green (e.g., LiaS, MprB part of two-component systems LiaRS, and MprAB); orange/yellow, transmembrane protein (e.g., PspB, PspC, LiaF, LiaI, and PspM) embedded in the dashed blue membrane. Arrows represent interaction or activation, or inhibitory feedback in the case of LiaF and LiaS. A simple operon map is shown for each system at the bottom but is expanded upon in panel B. (B) Domain architectures of the classical PSP operons in E. coli, M. tuberculosis, and B. subtilis. Domains are denoted by rectangular segments inside the block arrow representing each protein labeled below the arrow (e.g., the protein LiaH contains only the PspA domain). The direction of the arrow indicates the direction of transcription. See Results for new domain definitions. (C) Phyletic spreads of PSP proteins. Sunburst plots are shown to indicate the lineage distributions (as a fraction of the total number of homologs recorded across lineages) for the homologs of “classical” domains/protein families of interest: PspA, Snf7, PspB, PspC, PspM, PspN (and DUF3046), LiaI-LiaF-TM, and Toastrack. In each plot corresponding to a particular protein, the inner ring corresponds to the proportion of its homologs present in superkingdoms/domains of life, Bacteria, Archaea, and Eukaryota. The outer ring depicts the distribution of the homologs among key phyla. Interactive sunburst plots for each of the PSP proteins are available in the web app. The colors for each lineage (outer and inner rings) are shown separately for panel C.
Fig 2
Fig 2
PspA/Snf7 homologs across the tree of life. Phylogenetic tree of PspA homologs across the tree of life. The phylogenetic tree was constructed using FastTree and visualized with FigTree (parallel RAxML-NG-generated PspA tree with confidence values is shown in Fig. S2) from a multiple sequence alignment (using kalign3) of representative PspA homologs across all major superkingdoms and phyla (see Materials and Methods; web app). The primary take home from the tree is not the hundreds of leaves/labels but the key lineages that are labeled next to distinct clusters of similar PspA proteins; leaf colors match the lineage labels to highlight this import. The insets show the 3D structures for PspA (4WHE) and Snf7 (5FD7) from the Protein Data Bank. The tree leaves are labeled by lineage, species, and accession numbers. A text-searchable, scaled vector graphics version of this tree is available through the web app under the Phylogeny tab (leaf labels with aforementioned lineage, species, and accession can query this high-resolution downloadable PDF/SVG version of the tree). Representatives for PspA/Snf7 homologs are also available in Table S3. As a gene tree, most homologs do cluster among evolutionarily similar species, though evidence of widespread horizontal gene transfer is also evident. Two clusters of eukaryotic genes appear, such as Snf7 in Eukaryota and Asgardarchaeota groups, mirroring recent research suggesting eukaryotic life arose from this clade, and Vipp1 among Eukaryota and Cyanobacteria group, again reflecting the shared origin of the protein in plants from Cyanobacteria.
Fig 3
Fig 3
PspA domain architectures and genomic contexts. The first row contains domain architectures of the most prevalent homologs of PspA (as in Fig. 1A; indicated in black throughout). The remaining rows show the predominant genomic contexts of PspA homologs across multiple bacterial and archaeal lineages (identified by neighborhood searches ± seven genes flanking each homolog; see Materials and Methods). Representative neighborhoods with archetypal lineages and archetypal example proteins (with accession numbers and species) are shown. The PspA contexts are grouped by neighboring domains such as PspF, PspB/PspC; PspAA, PspAB; ClgR, PspM/PspN, thioredoxin (Fig. S1); chaperones such as band-7 proteins like flotillin, CesT_Tir, TPM_phosphatase, ZnR, SpermGS-ATPgrasp, and spermine synthase (Table S2); two-component systems such as the Lia system and Toastrack, and other novel genomic contexts; and cyanobacterial variations. Key: rectangles, domains; arrowheads, the direction of transcription; domains enclosed by dotted lines, absent in the genomic contexts in certain species; white cross, substitution with protein(s) mentioned just below; white triangle, insertion with one or more proteins; “||,” indicates a change in the direction of transcription; small black boxes, domain repeats co-occurring within a protein/context. Archetypal accession numbers and species are provided mostly on the left. Archetypal lineages are indicated in gray on the right for each of the domain architectures and genomic contexts. Different domains are indicated by the same color scheme as in Fig. 1. Also, similar domains are given similar hues. For example, membrane proteins are in different shades of orange (SIG, predicted signal peptide, dark orange; PspC, orange; other transmembrane domain, light orange); transcription factors/regulators (including HTH, helix-turn-helix domain) are in teal; DUFs, domains of unknown function, and other domains are in gray. Further details of the domain architectures and gene neighborhoods shown are described in the text and Table S3, and the full list of PspA homologs, their domain architectures, genomic contexts, and lineages are shown in the web app (under the “Data,” “Domain architectures,” and “Genomic contexts” tabs).
Fig 4
Fig 4
Lineage spread of PspA-free domain architectures. The domain architectures of the most prevalent homologs of PspA partner domains (frequency of occurrence >50 across lineages), including classical (Toastrack, LiaI-LiaF-TM, PspBC, PspMN, DUF3046) and other novel neighbors (PspAA, PspAB, HAAS, SHOCT-bi-helical, SHOCT-like, AAA+-ATPase domains) are illustrated on the left. Broad distributions of domains across the tree of life are indicated in Fig. 1C. The phyletic spread of the underlying domain architectures is shown here along with their relative frequencies as a stacked barplot for all superkingdoms/domains of life (sub-lineages or phyla are sorted; e.g., all bacterial lineages appear together). Further details of the domain architectures of all PspA partner domain homologs and their phyletic spreads are shown in the web app, with representatives shown in Table S4.
Fig 5
Fig 5
The genomic contexts housing all PSP cognate partner domain homologs. The genomic contexts and key lineage memberships are presented using the same schematic as in Fig. 3. The focus is on PSP partner domains such as Toastrack (blue), PspC, LiaI-LiaF-TM, HAAS, SHOCT-bi-helical (in shades of orange since they are transmembrane domains), and the various genomic neighborhoods with SHOCT-like proteins, transcription regulators (e.g., PadR-wHTH, SIGMA-HTH, GNTR-HTH), and two-component systems (Table S2). Further details of the genomic contexts of all PspA-free partner domain homologs and their phyletic spreads are in the web app, and representatives indicated in the figure are shown in Table S4.
Fig 6
Fig 6
PSP consolidated. (A) Domain proximity network. The network captures co-occurring domains, motifs, and features, such as transmembrane helices and signal peptides (SIG), within the top 97% of the homologs of all the “query” Psp members and their key partner domains (after sorting by decreasing frequency of occurrence). The size of the nodes (domains) and the width of edges (co-occurrence of domains within a protein) are proportional to the frequency of their occurrence across homologs. The query domains (original proteins/domains of interest; Table S1) and other commonly co-occurring domains (Table S2) are red or grayish teal. Note: a few connections may be absent in the displayed network due to low occurrence (fewer than the threshold), e.g., PspA and PspAA, betapropeller, and AAA ATPase. The full network, and the domain-centric ones, can be accessed on the web app. (B) Phyletic spread of the most common domains. The heatmap shows the presence/absence of homologs of PspA and partner domains across lineages. The color gradient represents the number of homologs identified within each lineage (e.g., the darkest shade indicates the highest number of homologs in a particular lineage, white indicates the lowest count, and the absence of a shaded box represents a lack of available data). Rows: PSP members and their most frequent partners are queried against all sequenced and completed genomes across bacteria, Eukaryota, and Archaea. Columns: the major archaeal (green), bacterial (orange), eukaryotic (blue), and viral (gray) lineages with representative sequenced genomes are considered. Details of all homologs across the tree of life, their domain architectures, genomic contexts, and their lineage distributions are shown in the web app (representatives in Tables S3 and S4). (C) Predominant co-occurring domain architectures in genomic neighborhoods. UpSet plot of the most common neighboring proteins (genomic contexts >100 occurrences are shown) among all Psp homologs. Blue histogram: distribution of the predominant domain architectures. Dots and connections: combinations in which these domain architectures come together in the genomic neighborhoods. Red histogram: frequency of occurrences of genomic neighborhoods comprising specific combinations of the predominant domain architectures. Phyletic spreads and UpSet plots of the domain architectures and genomic contexts for the homologs of all PSP member proteins are available in the web app.

Similar articles

Cited by

References

    1. van den Brink-van der Laan E, Antoinette Killian J, de Kruijff B. 2004. Nonbilayer lipids affect peripheral and integral membrane proteins via changes in the lateral pressure profile. Biochimica et Biophysica Acta (BBA) - Biomembranes 1666:275–288. doi: 10.1016/j.bbamem.2004.06.010 - DOI - PubMed
    1. Kobayashi R, Suzuki T, Yoshida M. 2007. Escherichia coli phage-shock protein A (PspA) binds to membrane phospholipids and repairs proton leakage of the damaged membranes. Mol Microbiol 66:100–109. doi: 10.1111/j.1365-2958.2007.05893.x - DOI - PubMed
    1. Jordan S, Hutchings MI, Mascher T. 2008. Cell envelope stress response in Gram-positive bacteria. FEMS Microbiol Rev 32:107–146. doi: 10.1111/j.1574-6976.2007.00091.x - DOI - PubMed
    1. Raivio TL. 2005. Envelope stress responses and gram-negative bacterial pathogenesis. Mol Microbiol 56:1119–1128. doi: 10.1111/j.1365-2958.2005.04625.x - DOI - PubMed
    1. Rowley G, Spector M, Kormanec J, Roberts M. 2006. Pushing the envelope: extracytoplasmic stress responses in bacterial pathogens. Nat Rev Microbiol 4:383–394. doi: 10.1038/nrmicro1394 - DOI - PubMed

MeSH terms

LinkOut - more resources