. 2024 Jul 1;213(1):40-51.
doi: 10.4049/jimmunol.2300843.

Replication Stress in Activated Human NK Cells Induces Sensitivity to Apoptosis

Affiliations

Replication Stress in Activated Human NK Cells Induces Sensitivity to Apoptosis

Nicole C Guilz et al. J Immunol. .

Abstract

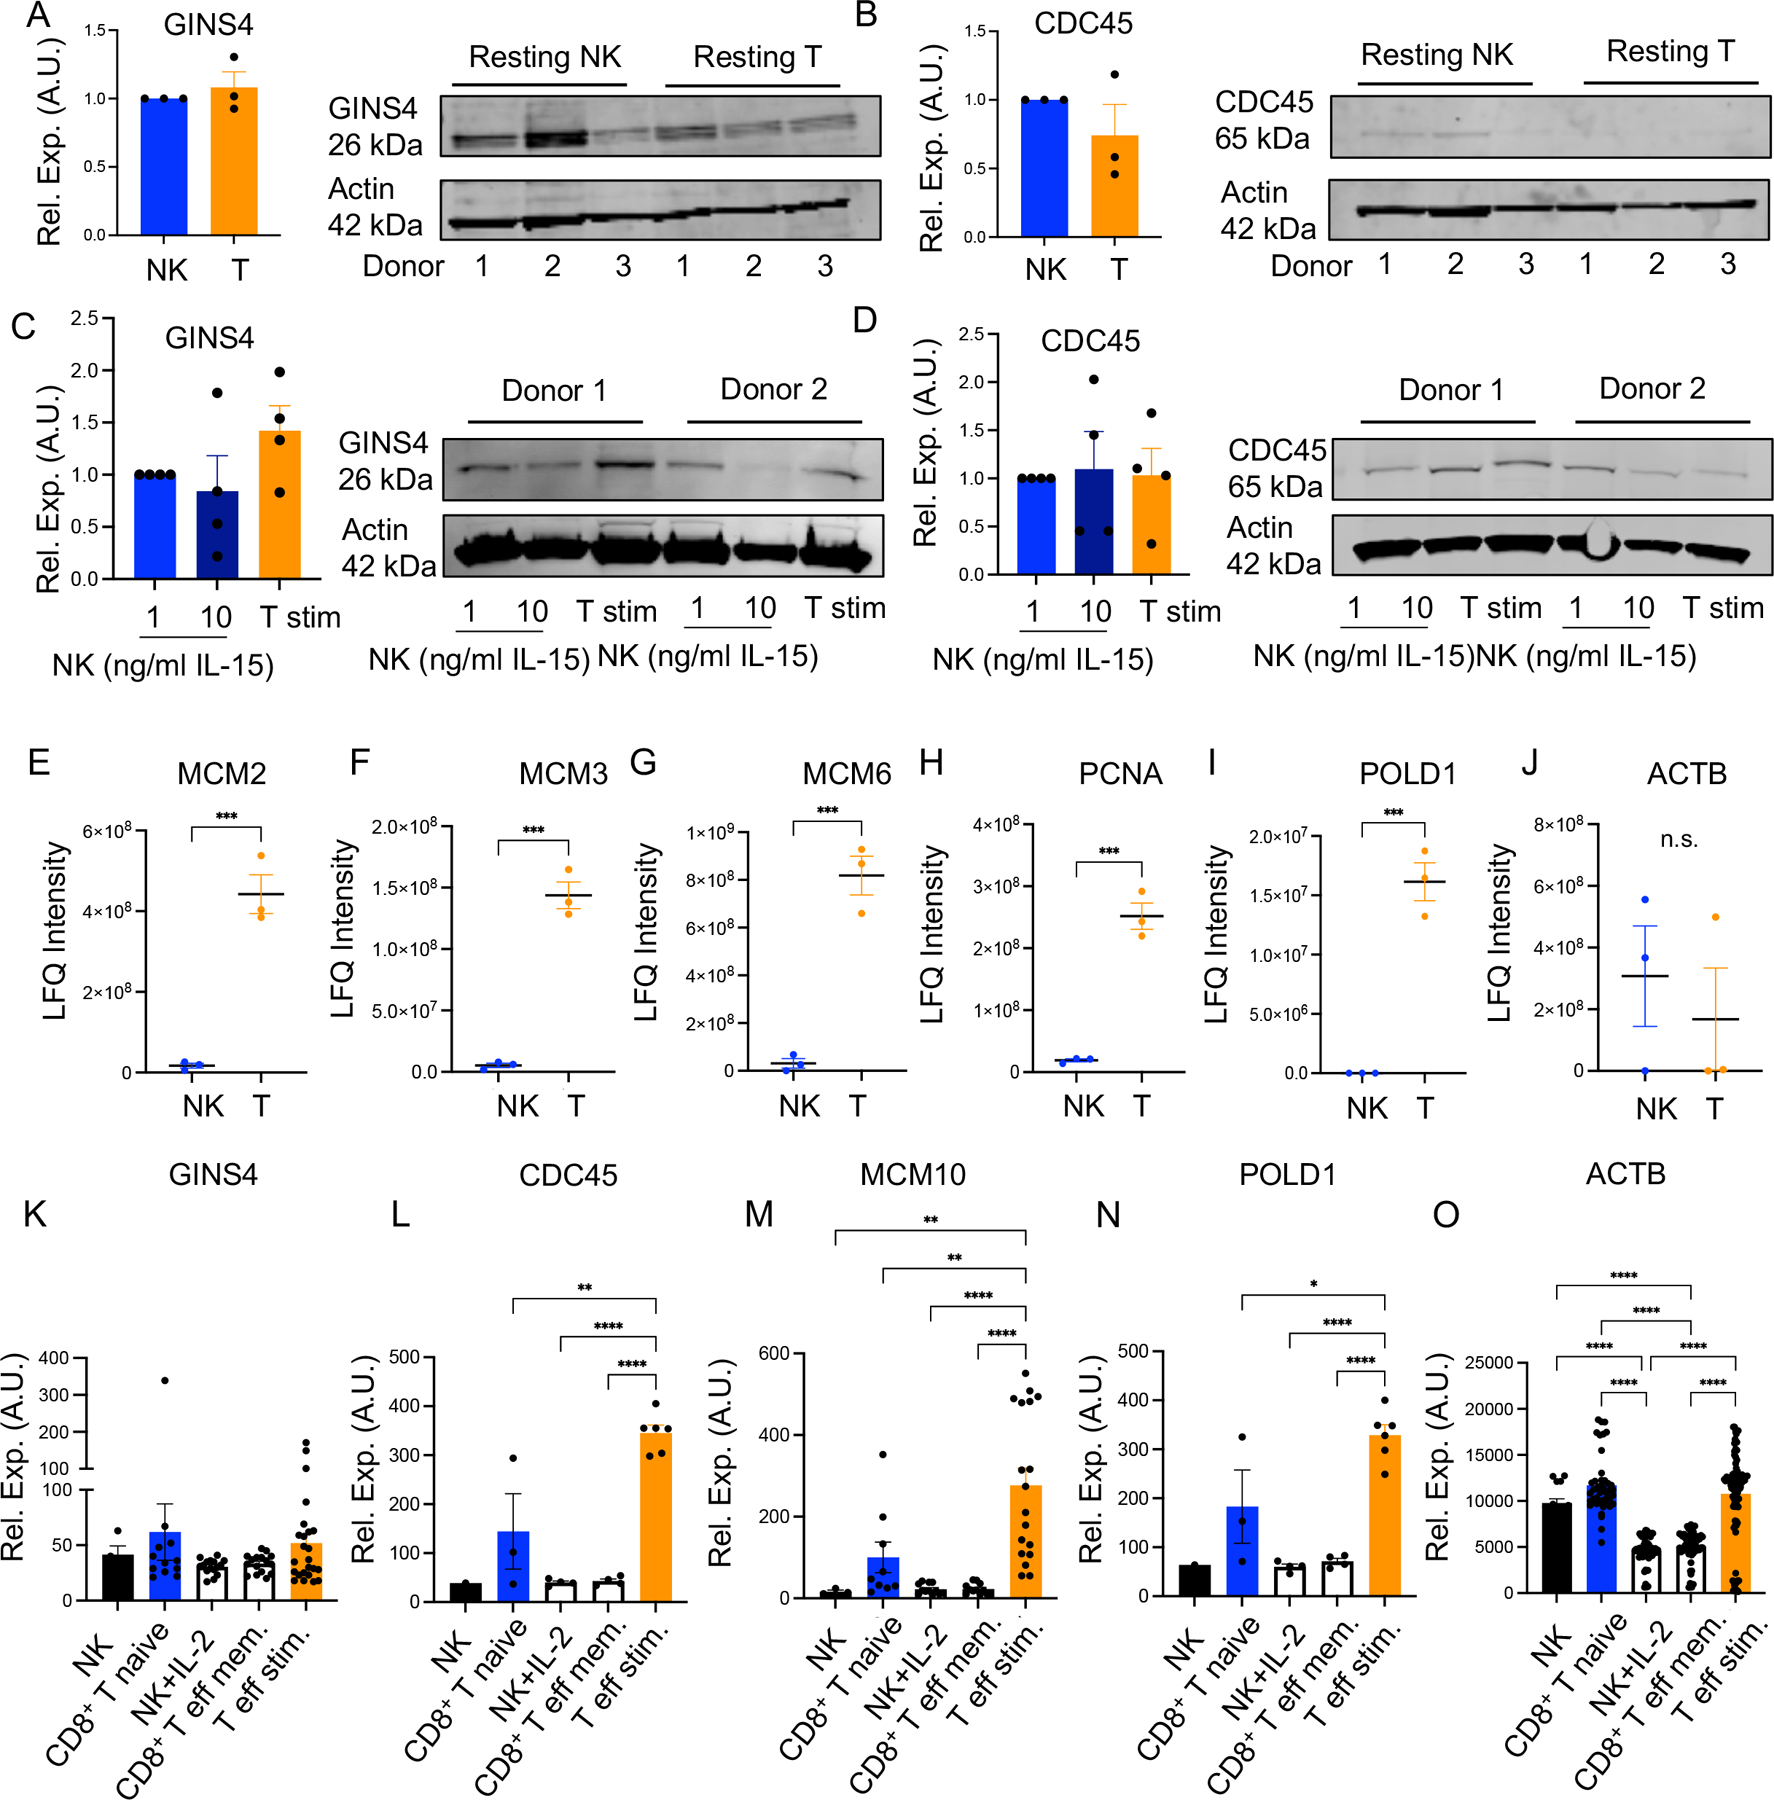
NK cells are innate immune effectors that kill virally infected or malignant cells. NK cell deficiency (NKD) occurs when NK cell development or function is impaired and variants in MCM4, GINS1, MCM10, and GINS4 result in NKD. Although NK cells are strongly impacted by mutational deficiencies in helicase proteins, the mechanisms underlying this specific susceptibility are poorly understood. In this study, we induced replication stress in activated NK cells or T cells by chemical and genetic methods. We found that the CD56bright subset of NK cells accumulates more DNA damage and replication stress during activation than do CD56dim NK cells or T cells. Aphidicolin treatment increases apoptosis of CD56bright NK cells through increased pan-caspase expression and decreases perforin expression in surviving cells. These findings show that sensitivity to replication stress affects NK cell survival and function and contributes to NKD.


Conflict of interest statement

Conflict-of-interest disclosure

The authors have no competing financial interests to declare.

Figures

Figure 1.
Figure 1.. NK cell activation leads to cell proliferation, cell cycle progression, and DNA damage.
A) Schematic of the PBMC stimulation protocol for negative control conditions (top), CIML NK cell activation (middle), and T cell activation (bottom). Negative controls received no stimulation for T cell experiments in Figures 1E–F, 20 U/mL IL-2 for NK cell experiments for Figures 1B–D. CIML activated NK cells received IL-15, IL-12, and IL-18 overnight stimulation followed by low-dose IL-2 for 1–3 days in the presence or absence of aphidicolin. T cells received 30 U/mL IL-2 stimulation with anti-CD3 and anti-CD28 beads for 1–3 days in the presence or absence of aphidicolin. (B) Percentage of CD56+CD3 NK cells found in S phase by flow cytometric cell cycle analysis of BrdU and 7-AAD staining following activation with CIML cytokines. n=4 healthy donors for no prime control and CIML conditions, representative plot shown on right. (C) Percentage of proliferated NK cells based on CFSE staining by flow cytometry following activation with CIML cytokines. n= 8 (no prime) and 9 (CIML) healthy donors; representative plot shown on right. (D) Mean fluorescence intensity of γH2AX of CD56+CD3 NK cells measured by flow cytometry. γH2AX MFI was gated based on CD56+CD3 NK cells. n=4 healthy donors for CIML and no prime conditions, representative plot shown on right. Unpaired Student’s T test was performed on data in Fig. 1B–D. (E) Percentage of CD3+ T cells which have diluted CFSE dye in response to no stimulation, CIML activation, or T cell stimulation. n=4 healthy donors. One-way ANOVA with multiple comparisons was performed. (F) γH2AX analysis by flow cytometry in CD3+ T cells activated with CIML cytokines or T cell stimulation. n=4 healthy donors compared by unpaired Student’s T test. Representative plots are shown on the right. Cells are gated based on unstained controls. Data shown are mean±SEM for all plots.
Figure 2.
Figure 2.. Aphidicolin treatment impairs replication fork progression in NK cells and T cells.
A) Percent 7-Aminoactinomycin D (7-AAD) positive cells following low dose IL-2, CIML activation (NK cells), or T cell activation with or without aphidicolin treatment. Two-way ANOVA analysis was performed with multiple comparisons. n=4 biological replicates. (B) Fork speed (kilobases per minute) of DNA replication from enriched stimulated NK cells or T cells from a DNA fiber analysis assay. Cells were incubated for two hours with 0.25 μM aphidicolin following overnight cytokine stimulation for enriched NK cells or continuous anti-CD3 -CD28 beads with 30 U/mL IL-2 for T cells. Cells from n=2 healthy donors were pooled to make the DNA fiber slides. n=34 fibers NK 0μM Aph, n=36 fibers NK 0.25μM, n=52 fibers T 0μM, n=52 fibers T 0.25μM. One-way ANOVA with multiple comparisons was performed. (C) Percentage of γH2AX+ cells in NK and T cell subsets with or without low dose aphidicolin following activation with low dose IL-2 or CIML activation (NK cells) or T cell activation. n=4 biological replicates. (D) Percentage of BrdU+ cells without DNase treatment (exposed ssDNA) measured by flow cytometry. n=4 biological replicates. Two-way ANOVA analysis with multiple comparisons was performed for Fig. 2C, D. (E) Example flow plots with BrdU+ gating strategy based on BrdU fluorescence minus one (FMO) control with DNA content on the X-axis. (F) pRPA (Thr21) positive cells in NK and T cell subsets with or without low dose aphidicolin following activation with low dose IL-2 or CIML activation (NK cells) or T cell activation. Cells are gated based on fluorescence minus one (FMO) or no stain controls. Two-way ANOVA analysis with multiple comparisons was conducted, n=4 biological replicates. (G) Representative confocal microscopy images from CIML activated NK cells (top) and activated T cells (bottom). (H) Quantification of γH2AX or pRPA (Thr21) foci. Unpaired Student’s T test was conducted for statistical significance. Data shown are pooled from two healthy donors. n= 75 activated NK cells and n= 77 activated T cells with γH2AX foci. n= 76 activated NK cells and n= 80 activated T cells with pRPA foci. Data are shown as mean±SEM.
Figure 3.
Figure 3.. Replication stress leads to apoptosis of activated NK cells.
A) Percent pP53 (Ser15) positive cells in NK and T cell subsets with or without low dose aphidicolin following activation with low dose IL-2 or CIML activation (NK cells) or T cell activation. n=4 biological replicates. (B) Fluorescence intensity of pan-caspase dye was measured for CD56+ NK cells and CD3+ T cells. n=4 biological replicates. (C) Proteomic analysis of the log2(LFQ intensity) of selected pro-apoptotic proteins from isolated NK cell and T cells. n=3 biological replicates. (D) and (E) Flow cytometry of pro-apoptotic markers was conducted on n=3 healthy donors. (F) Percent Autophagy Red positive cells were calculated for each NK and T cell subset. n=4 healthy donors. Two-way ANOVA with multiple comparisons was performed for Fig. 3A–C, E, F. Experiments for Fig. 3 were incubated with aphidicolin for only 1 day. All other figures include data that were incubated for three days.
Figure 4.
Figure 4.. Differential expression of CMG complex members in NK and T cells.
A) and (B) Western blot of resting T cells or NK cells from 3 healthy donors blotted for GINS4, CDC45 and actin (for normalization). Protein was normalized first to actin for each lane then normalized to NK cells. Student’s T test did not find statistical significance between NK and T cells. (C) and (D). Western blotting of activated NK cells (IL-15) and T cells (CD3/CD28 IL-2) from four healthy donors was conducted using the same antibodies and analysis as resting samples. No statistical significance was detected by one-way ANOVA with multiple comparisons. (E-J) Proteomic LFQ intensity data was plotted for selected MCM proteins and cell cycle proteins. One-tailed T tests were performed. n=3 biological repeats. (K-O) Relative expression in arbitrary units (AU) for RNA abundance of helicase proteins and replication genes was analyzed from datasets available on BioGPS (46). One-way ANOVA with multiple comparisons was used to test for differences, except in CDC45 (Fig 4L) and POLD1 (Fig 4N) where the NK cell condition was removed due to n=1. In (K), n=4 NK cells, n=12 NK cells + IL-2, n=16 CD8 T cell naïve, n=16 CD8 T eff memory, n=24 T eff stimulated. In (L), n=1 NK cells, n=3 NK cells + IL-2, n=4 CD8 T cell naïve, n=4 CD8 T eff memory, n=6 T eff stimulated. In (M), n=3 NK cells, n=9 NK cells + IL-2, n=12 CD8 T cell naïve, n=12 CD8 T eff memory, n=18 T eff stimulated. In (N), n=1 NK cell, n=3 NK cells + IL-2, n=4 CD8 T cell naïve, n=4 CD8 T eff memory, n=6 T eff stimulated. In (O), n=15 NK cells, n=45 NK cells + IL-2, n=60 CD8 T cell naïve, n=60 CD8 T eff memory, n=90 T eff stimulated.
Figure 5.
Figure 5.. Replication stress impairs the cytotoxic capacity of primary human NK cells.
Intracellular granzyme B (A) and granzyme A (B) detected in CD56dim and CD56bright cells by flow cytometry. One-way ANOVA with multiple comparisons. n=4 healthy donors. (C) Intracellular perforin was measured in NK cells from four healthy donors gated on CD56dim and CD56bright cells. One-way ANOVA with multiple comparisons was performed. n=4 healthy donors. (D) Intracellular IFN-γ in CD56bright cells, including a fluorescence minus one (FMO) negative control. No statistical differences were calculated by one-way ANOVA. n=4 healthy donors. Below bar graphs are example histograms showing unstained control (black dashed line), stimulated control (blue line), and 0.25 μM aphidicolin (orange line) conditions for Fig 1A–D. (E) 51Cr release assay to evaluate NK cell cytotoxic function against K562 target cells. Shown is the mean of n=10 healthy donors, each performed in triplicate. Cells were enriched prior to the assay as described in the Methods section. Data shown are mean±SEM. Mann-Whitney tests demonstrated statistical significance of p<0.05 for all effector: target ratios except 1.25:1 and 0.31:1.
Figure 6.
Figure 6.. MCM10 knockdown leads to increased NK cell apoptosis.
A) Validation of MCM10 knockdown was conducted by Western blotting using anti-MCM10 and anti-actin antibodies and quantified using actin as a loading control. n=3 technical replicates. (B) Relative percent PI positive cells were analyzed by flow cytometry using unstained controls. Representative histograms are shown. n=4 technical replicates. (C) Representative cell cycle graphs with gating strategy based on scramble shRNA (left) and quantification of the frequency of cells in S phase or early S phase (right). n=5 technical repeats. (D) Representative images from confocal microscopy of MCM10-KD or scramble (control) shRNA YTS cells with DAPI staining and antibodies against phospho-RPA and γH2AX. Nuclear area quantification of knockdown cells compared to controls. n=294 and n=205 scramble and MCM10 KD cells, respectively, pooled from n=2 experimental repeats. (E) Number of foci of phospho-RPA and γH2AX compared to scramble shRNA controls. n=294 scramble cells analyzed and n=205 MCM10 KD cells analyzed for phospho-RPA. n=141 and n=77 cells analyzed for scramble and MCM10 KD respectively for γH2AX foci. (F) Relative percent caspase positive cells using fluorescence minus one (FMO) controls. n=4 technical replicates. (G) and (H) Relative fluorescence intensity measured by intracellular flow cytometry for granzyme B and perforin. n=3 technical replicates. Representative histograms are shown. Student’s T test was used to determine statistical significance for Figures A – H. No statistical significance was detected between MCM10-KD and controls in G or H. N.S. not significant. Scramble, scramble shRNA YTS cells; MCM10, MCM10-KD YTS cells.

References

    1. Poli A, Michel T, Theresine M, Andres E, Hentges F, and Zimmer J. 2009. CD56bright natural killer (NK) cells: an important NK cell subset. Immunology 126: 458–465. - PMC - PubMed
    1. Cooper MA, Fehniger TA, and Caligiuri MA. 2001. The biology of human natural killer-cell subsets. Trends Immunol 22: 633–640. - PubMed
    1. Mujal AM, Delconte RB, and Sun JC. 2021. Natural Killer Cells: From Innate to Adaptive Features. Annu Rev Immunol 39: 417–447. - PubMed
    1. Cerwenka A, and Lanier LL. 2016. Natural killer cell memory in infection, inflammation and cancer. Nat Rev Immunol 16: 112–123. - PubMed
    1. Kamimura Y, and Lanier LL. 2015. Homeostatic control of memory cell progenitors in the natural killer cell lineage. Cell Rep 10: 280–291. - PMC - PubMed

Publication types

LinkOut - more resources