. 2024 May 1;8(5):384-396.
doi: 10.4049/immunohorizons.2300076.

Sialic Acid-Siglec-E Interactions Regulate the Response of Neonatal Macrophages to Group B Streptococcus

Affiliations

Sialic Acid-Siglec-E Interactions Regulate the Response of Neonatal Macrophages to Group B Streptococcus

Sean J Lund et al. Immunohorizons. .

Abstract

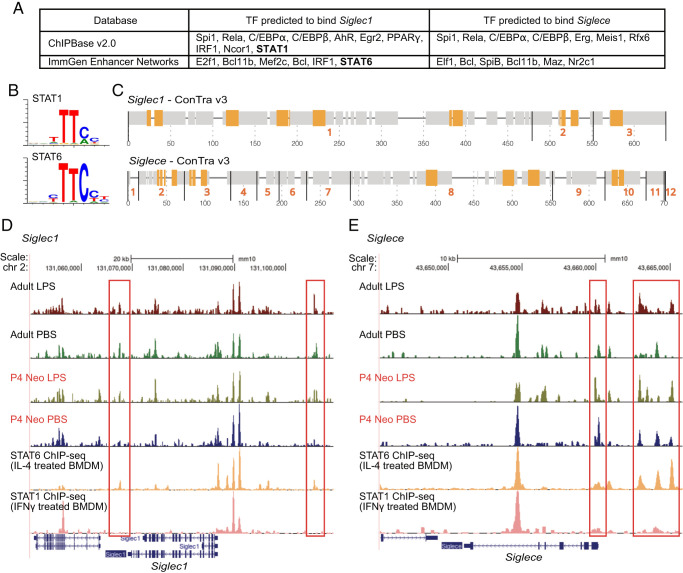
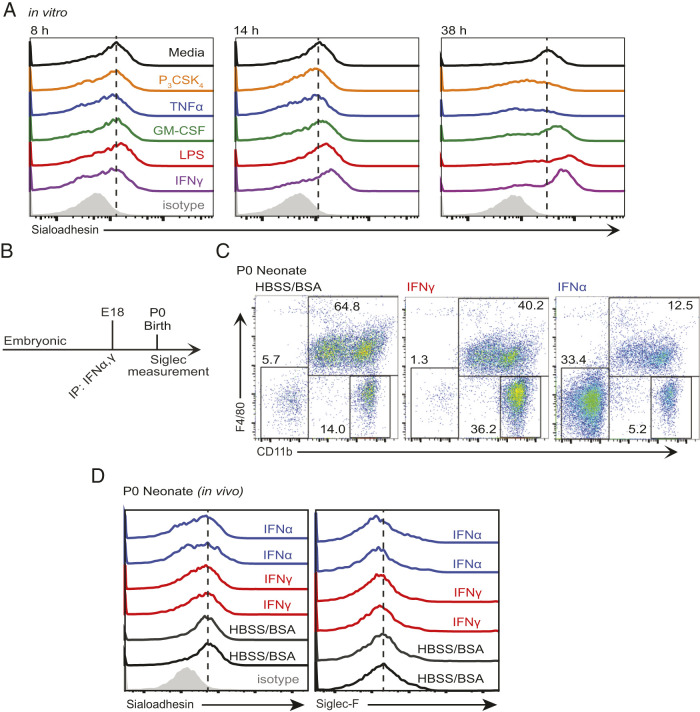
The mammalian Siglec receptor sialoadhesin (Siglec1, CD169) confers innate immunity against the encapsulated pathogen group B Streptococcus (GBS). Newborn lung macrophages have lower expression levels of sialoadhesin at birth compared with the postnatal period, increasing their susceptibility to GBS infection. In this study, we investigate the mechanisms regulating sialoadhesin expression in the newborn mouse lung. In both neonatal and adult mice, GBS lung infection reduced Siglec1 expression, potentially delaying acquisition of immunity in neonates. Suppression of Siglec1 expression required interactions between sialic acid on the GBS capsule and the inhibitory host receptor Siglec-E. The Siglec1 gene contains multiple STAT binding motifs, which could regulate expression of sialoadhesin downstream of innate immune signals. Although GBS infection reduced STAT1 expression in the lungs of wild-type newborn mice, we observed increased numbers of STAT1+ cells in Siglece-/- lungs. To test if innate immune activation could increase sialoadhesin at birth, we first demonstrated that treatment of neonatal lung macrophages ex vivo with inflammatory activators increased sialoadhesin expression. However, overcoming the low sialoadhesin expression at birth using in vivo prenatal exposures or treatments with inflammatory stimuli were not successful. The suppression of sialoadhesin expression by GBS-Siglec-E engagement may therefore contribute to disease pathogenesis in newborns and represent a challenging but potentially appealing therapeutic opportunity to augment immunity at birth.


Conflict of interest statement

The authors have no financial conflicts of interest.

Figures

FIGURE 1.
FIGURE 1.
GBS infection reduces Siglec1 expression. Neonatal (A and B) or adult (C and D) C57BL/6 mice were infected with GBS, and whole-lung RNA was isolated 0.5, 2, 6, 12, or 24 h following infection. Expression of Siglec1 (the gene encoding sialoadhesin; A and C) and Siglece (encoding Siglec-E; B and D) was measured by real-time PCR and compared with Gapdh expression. Values were normalized to control, uninfected RNA samples and plotted using the 2−ΔΔCT calculation. *p <0.05, **p <0.01 using an unpaired, two-tailed t test. Each data point represents an individual infected or uninfected mouse.
FIGURE 2.
FIGURE 2.
Inhibition of sialoadhesin expression following GBS infection requires Siglec-E and GBS capsular sialic acid. (A) Neonatal WT or Siglece−/− mice were infected with GBS. Twenty-four hours later, total lung macrophages from infected (GBS; dashed lines) and control mice (Ctrl; administered sterile HBSS, solid lines) were analyzed by FACS, measuring sialoadhesin (left panels) and Siglec-E (right panels) expression. Isotype control plots for each Ab are shown in gray. Representative histogram plots from three independent experiments are shown. (B and C) Siglec1 (left panels) and Siglece (right panels) mRNA expression in neonatal (B) or adult (C) mice infected with either WT or ΔneuA GBS measured by real-time PCR. Data are represented as fold change compared with uninfected control animals using Gapdh for normalization. Samples were obtained and analyzed 0.5, 6, and 24 h following infection. (D) Il1b mRNA expression in neonatal (left panel) and adult (right panel) C57BL/6 mice infected with either WT or ΔneuA GBS. Lung samples were obtained and analyzed 0.5, 6, and 24 h following infection. Il1b expression was measured by real-time PCR. *p <0.05 using unpaired two-tailed t test in comparing samples indicated by horizontal bars.
FIGURE 3.
FIGURE 3.
Predicted STAT binding within murine Siglec1 and Siglece promoters. (A) Table showing the top results of transcription factors (TFs) predicted to bind the promoter regions of Siglec1 and Siglece from the ChIPBase version 2.0 and ImmGen Enhancer Networks databases. (B) Comparison of the similar sequences predicted to bind STAT1 and STAT6 from JASPAR CORE. (C) Predicted STAT6 binding sites in the murine Siglec1 and Siglece promoter regions (ConTra version 3). Conserved sequence regions are identified within black lines and labeled with orange numerals. Predicted STAT6 binding sequences identified with orange bars. (D and E). ATAC-seq and ChIP-seq data (15–17) showing open chromatin and STAT binding in alveolar macrophages (ATAC-seq) and BMDMs (ChIP-seq). For the ATAC-seq datasets, alveolar macrophages were isolated from adult and PND4 C57BL/6 mice administered either intranasal PBS or LPS (0.1 μg/g body weight) 2 h prior to isolation and cell sorting. ChIP-seq data were obtained from mouse BMDMs treated with either IL-4 (STAT6) or IFNγ (STAT1) for 1 h prior to fixation. Peaks were aligned within the UCSC Genome Browser. OCRs and STAT binding peaks are shown for Siglec1 (D) and Siglece (E).
FIGURE 4.
FIGURE 4.
STAT6 was not required for Siglec expression. (A) Stat1 (left) and Stat6 (right) mRNA expression in adult (black squares, n = 3), PND7 (blue squares, n = 3), and PND1 (red squares, n = 4) lungs measured by real-time PCR and represented as fold change compared with WT using Gapdh for normalization. (B and C) Flow cytometric analysis of sialoadhesin, Siglec-E, and Siglec-F cell surface expression in WT (black) and Stat6−/− adult alveolar macrophages. FACS histograms shown in (B), MFI plotted in (C). n = 3 for each genotype. (D) Siglece, Siglec1, Ifng, and Ifnb mRNA expression measured in adult WT and Stat6−/− lungs by real-time PCR and represented as fold change compared with WT using Gapdh for normalization. n = 3 for each genotype.
FIGURE 5.
FIGURE 5.
STAT1 expression in WT and Siglece−/− lungs following GBS infection. Lungs from adult (A–F) and neonatal (G–L) mice were fixed, sectioned, and immunostained for the macrophage marker CD68 (green) and STAT1 (red). DRAQ5 was used as a nuclear stain and shown in blue. All samples were obtained 24 h postinfection with GBS (B, E, H and K) or sterile saline (A, D, G and J). STAT1 expression was quantified by measuring total anti-STAT1 fluorescence intensity and normalizing to the DRAQ5 nuclear stain fluorescence intensity in each image for normalization (C, F, I and L). (A–C) Adult WT (C57BL/6) mice. (D–F) Adult Siglece−/− mice. (G–I) Neonatal (PND0) WT (C57BL/6) mice. (J–L) Neonatal Siglece−/− mice. Optical sections were acquired by laser scanning confocal microscopy using a 40× objective, and three-dimensional merged images are shown. Each image is representative of multiple images obtained in three independent experiments. ****p <0.0001, n = 30–75 images for each condition.
FIGURE 6.
FIGURE 6.
Regulation of sialoadhesin expression by inflammatory mediators. (A) Total cell suspensions from PND2 C57BL/6 lungs were cultured for 8 h, 14 h, or 38 h in the presence of Pam3CSK4 (300 ng/ml), TNFα (10 ng/ml), GM-CSF (10 ng/ml), LPS (250 ng/ml), or IFNγ (10 ng/ml). Sialoadhesin expression was measured in CD45+/F4/80+/CD11b+ macrophages by FACS, and histogram data are shown. Dashed line represents peak sialoadhesin expression frequency in control samples for comparison across treatments. Histogram for isotype control shown in gray. Representative histograms from three independent experiments are shown. (B) Diagram of the timeline used for in vivo experiments. Timed pregnant C57BL/6 mice were injected with i.p. IFNα or IFNγ (dosage) or HBSS (control) on embryonic day 18. Following delivery, lung immune cell populations and sialoadhesin expression were measured by flow cytometry. (C) IFNα increased the percentage of CD45+/CD11bHI/F4/80 neutrophils, whereas IFNγ increased the percentage of CD45+/CD11b/F4/80 cells, likely representing lymphocytes. Representative data from three independent experiments are shown. (D) Prenatal IFN injection did not increase sialoadhesin or Siglec-F expression as measured by FACS in PND0 CD45+/F4/80+/CD11b+ lung macrophages. Histograms from two of three independent experiments are shown.
FIGURE 7.
FIGURE 7.
Prenatal administration of rosiglitazone was not able to increase neonatal macrophage sialoadhesin expression. (A) Lung macrophages from PND4 mice exposed to vehicle control or 0.1 mg rosiglitazone were analyzed by FACS. Rosiglitazone increased the percentage of F4/80HI macrophages, consistent with stimulation of macrophage differentiation. Data shown are representative of three independent experiments. (B) Expression of sialoadhesin and Siglec-F in CD45+/F4/80+/CD11b+ lung macrophages obtained from PND1 neonatal mice exposed on embryonic day 18 to vehicle control or rosiglitazone (either 0.1 mg or 0.5 mg) was measured by FACS. Each histogram represents an independent experiment out of three separate replicates. Background staining using an isotype control Ab shown in gray. Dashed line represents peak intensity in vehicle control samples. (C) Expression of sialoadhesin and Siglec-F in CD45+/F4/80+/CD11b+ lung macrophages obtained from PND4 neonatal mice exposed to vehicle control or rosiglitazone (either 0.1 mg or 0.5 mg on E18) was measured by FACS. Each histogram represents an independent experiment out of three separate replicates. Background staining using an isotype control Ab shown in gray. Dashed line represents peak intensity in vehicle control samples.

References

    1. Nanduri, S. A., Petit S., Smelser C., Apostol M., Alden N. B., Harrison L. H., Lynfield R., Vagnone P. S., Burzlaff K., Spina N. L., et al. . 2019. Epidemiology of invasive early-onset and late-onset group B streptococcal disease in the United States, 2006 to 2015: multistate laboratory and population-based surveillance. JAMA Pediatr. 173: 224–233. - PMC - PubMed
    1. Armistead, B., Oler E., Adams Waldorf K., Rajagopal L.. 2019. The double life of group B streptococcus: asymptomatic colonizer and potent pathogen. J. Mol. Biol. 431: 2914–2931. - PMC - PubMed
    1. Francois Watkins, L. K., McGee L., Schrag S. J., Beall B., Jain J. H., Pondo T., Farley M. M., Harrison L. H., Zansky S. M., Baumbach J., et al. . 2019. Epidemiology of invasive group B streptococcal infections among nonpregnant adults in the United States, 2008-2016. JAMA Intern. Med. 179: 479–488. - PMC - PubMed
    1. Invernizzi, R., Lloyd C. M., Molyneaux P. L.. 2020. Respiratory microbiome and epithelial interactions shape immunity in the lungs. Immunology 160: 171–182. - PMC - PubMed
    1. Joshi, N., Walter J. M., Misharin A. V.. 2018. Alveolar macrophages. Cell. Immunol. 330: 86–90. - PubMed

Publication types

MeSH terms