

Assessing petroleum contamination in parts of the Niger Delta based on a sub-catchment delineated field assessment
- PMID: 38809286
- PMCID: PMC11136865
- DOI: 10.1007/s10661-024-12743-7
Assessing petroleum contamination in parts of the Niger Delta based on a sub-catchment delineated field assessment
Abstract
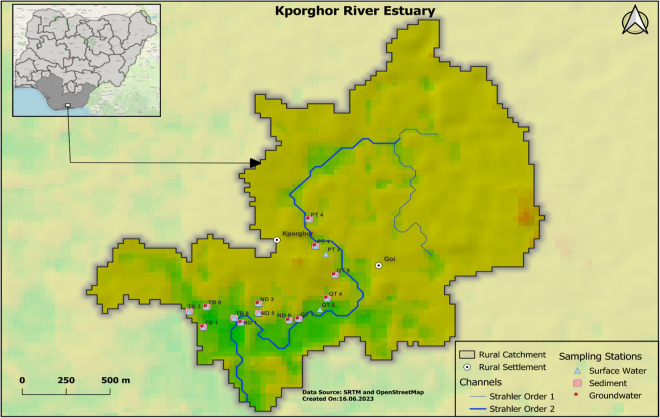
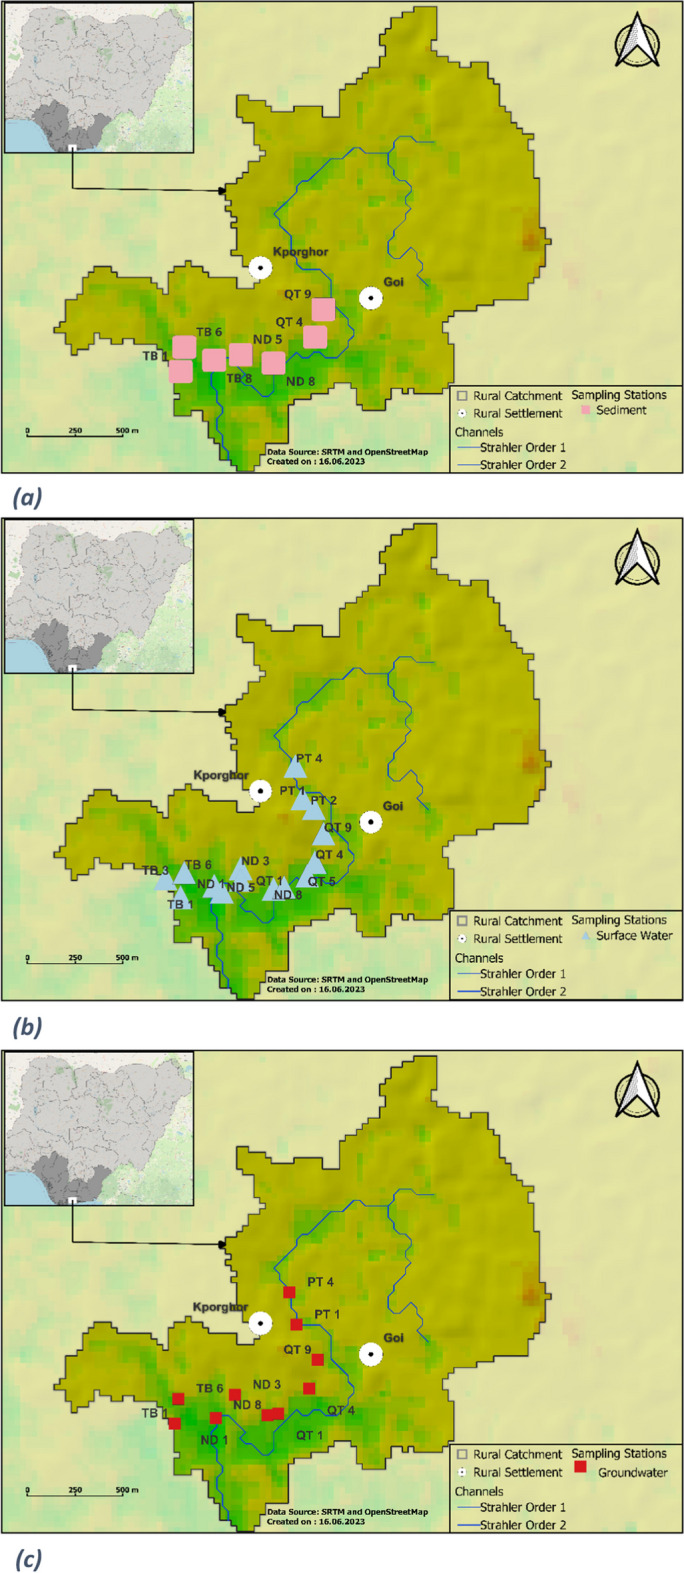
The Niger Delta in Nigeria is a complex and heavily contaminated area with over 150,000 interconnected contaminated sites. This intricate issue is compounded by the region's strong hydrological processes and high-energy environment, necessitating a science-based approach for effective contamination assessment and management. This study introduces the concept of sub-catchment contamination assessment and management, providing an overarching perspective rather than addressing each site individually. A description of the sub-catchment delineation process using the digital elevation model data from an impacted area within the Delta is provided. Additionally, the contamination status from the delineated sub-catchment is reported. Sediment, surface water and groundwater samples from the sub-catchment were analyzed for total petroleum hydrocarbons (TPH) and polycyclic aromatic hydrocarbons (PAHs), respectively. Surface sediment TPH concentrations ranged from 129 to 20,600 mg/kg, with subsurface (2-m depth) concentrations from 15.5 to 729 mg/kg. PAHs in surface and subsurface sediment reached 9.55 mg/kg and 0.46 mg/kg, respectively. Surface water exhibited TPH concentrations from 10 to 620 mg/L, while PAHs ranged from below detection limits to 1 mg/L. Groundwater TPH concentrations spanned 3 to 473 mg/L, with total PAHs varying from below detection limits to 0.28 mg/L. These elevated TPH and PAH levels indicate extensive petroleum contamination in the investigated sediment and water environment. Along with severe impacts on large areas of mangroves and wetlands, comparison of TPH and PAH concentrations with sediment and water quality criteria found 54 to 100% of stations demonstrated exceedances, suggesting adverse biological effects on aquatic and sediment biota are likely occurring.
Keywords: Environmental remediation; Hydrological analysis; Niger Delta; Petroleum contamination; Sub-catchment assessment.
© 2024. The Author(s).
Conflict of interest statement
The authors declare no competing interests.
Figures


Similar articles
-
Sediment quality benchmarks for assessing oil-related impacts to the deep-sea benthos.Integr Environ Assess Manag. 2017 Sep;13(5):840-851. doi: 10.1002/ieam.1898. Epub 2017 Mar 11. Integr Environ Assess Manag. 2017. PMID: 28121064
-
Comparison and origins of polycyclic aromatic hydrocarbons (PAHs) in the entrance and the exit of the Turkish Straits System (TSS).Mar Pollut Bull. 2018 Nov;136:33-37. doi: 10.1016/j.marpolbul.2018.08.066. Epub 2018 Sep 5. Mar Pollut Bull. 2018. PMID: 30509814
-
Core sediments and oil chemistry from contaminated mangroves in eastern Niger Delta, Ogoniland, Nigeria.Mar Pollut Bull. 2021 Oct;171:112714. doi: 10.1016/j.marpolbul.2021.112714. Epub 2021 Jul 29. Mar Pollut Bull. 2021. PMID: 34333305
-
Polycyclic aromatic hydrocarbons during the 21st Century in Southern Gulf of Mexico, a prominent petroleum area: A review.Mar Pollut Bull. 2025 Jan;210:117343. doi: 10.1016/j.marpolbul.2024.117343. Epub 2024 Dec 2. Mar Pollut Bull. 2025. PMID: 39622106 Review.
-
Petroleum hydrocarbon pollution in sediments from the Gulf and Omani waters: Status and review.Mar Pollut Bull. 2021 Dec;173(Pt A):112913. doi: 10.1016/j.marpolbul.2021.112913. Epub 2021 Sep 15. Mar Pollut Bull. 2021. PMID: 34534928 Review.
References
-
- Abbas AO, Brack W. Polycyclic aromatic hydrocarbons in Niger Delta soil: Contamination sources and profiles. International Journal of Environmental Science & Technology. 2006;2:343–352. doi: 10.1007/BF03325895. - DOI
-
- Adejuwon JO. Rainfall seasonality in the Niger Delta belt, Nigeria. Journal of Geography and Regional Planning. 2012;5(2):51.
-
- Adekola O, Mitchell G. The Niger Delta wetlands: Threats to ecosystem services, their importance to dependent communities and possible management measures. International Journal of Biodiversity Science, Ecosystem Services & Management. 2011;7(1):50–68. doi: 10.1080/21513732.2011.603138. - DOI
-
- Adeniji AO, Okoh OO, Okoh AI. Analytical methods for the determination of the distribution of total petroleum hydrocarbons in the water and sediment of aquatic systems: A review. Journal of Chemistry. 2017;2017:1–13. doi: 10.1155/2017/5178937. - DOI
MeSH terms
Substances
LinkOut - more resources
Full Text Sources
Medical
