. 2024 May 28;16(10):9023-9046.
doi: 10.18632/aging.205854. Epub 2024 May 28.

Jingfang granules protects against intracerebral hemorrhage by inhibiting neuroinflammation and protecting blood-brain barrier damage

Affiliations

Jingfang granules protects against intracerebral hemorrhage by inhibiting neuroinflammation and protecting blood-brain barrier damage

Yanling Li et al. Aging (Albany NY). .

Abstract

Intracerebral hemorrhage (ICH) can induce intensive oxidative stress, neuroinflammation, and brain cell apoptosis. However, conventional methods for ICH treatment have many disadvantages. There is an urgent need for alternative, effective therapies with minimal side effects. Pharmacodynamics experiment, molecular docking, network pharmacology, and metabolomics were adopted to investigate the treatment and its mechanism of Jingfang Granules (JFG) in ICH. In this study, we investigated the therapeutic effects of JFG on ICH using behavioral, brain water content and Magnetic resonance imaging experiments. However, the key active component and targets of JFG remain unknown. Here we verified that JFG was beneficial to improve brain injury after ICH. A network pharmacology analysis revealed that the anti-inflammatory effect of JFG is predominantly mediated by its activation of the phosphatidylinositol 3-kinase (PI3K)/AKT pathway through Luteolin, (+)-Anomalin and Phaseol and their targeting of AKT1, tumor necrosis factorα (TNF-α), and interleukin-1β (IL-1β). Molecular docking analyses revealed an average affinity of -8.633 kcal/mol, indicating a binding strength of less than -5 kcal/mol. Metabolomic analysis showed that JFG exerted its therapeutic effect on ICH by regulating metabolic pathways, such as the metabolism of taurine and hypotaurine, biosynthesis of valine, leucine, and isoleucine. In conclusion, we demonstrated that JFG attenuated neuroinflammation and BBB injury subsequent to ICH by activating the PI3K/Akt signaling pathway.

Keywords: intracerebral hemorrhage; jingfang granules; metabolomics; network pharmacology; neuroinflammation.


Conflict of interest statement

CONFLICTS OF INTEREST: The authors declare that the research was conducted in the absence of any commercial or financial relationships that could be construed as a potential conflict of interest.

Figures

Figure 1
Figure 1
Schematic model of the mechanism of JFG functions on ICH.
Figure 2
Figure 2
JFG attenuated neurological deficits. At 1, 3, 7, and 14 days post ICH induction, JFG treatment resulted in significant reduction of neurological deficits. (A) Schematic model of the mechanism of JFG functions on ICH. (B) Representative bar chart illustrating outcomes of the BBT analysis. (C) Representative bar graph showing the results of EBST assay. Values are presented as means ± S.D. ***P < 0.001; **P < 0.01; *P < 0.05, compared with Model group; ###P < 0.001; ##P < 0.01; #P < 0.05, compared with the Sham group. (n = 6, 1,3,7,14 days).
Figure 3
Figure 3
(A, B) T2-weighted MRI imaging of rats with ICH. (A) T2 weighted imaging was used to observe intracerebral hemorrhage areas (The red dotted line indicates the size of the hematoma). (B) intracerebral hemorrhage volume. (C) Representative bar graphs showing the area of hematoma (left panel) and the volume (right panel). Values are presented as means ± S.D. ***P < 0.001; **P < 0.01; *P < 0.05, compared with Model group; ###P < 0.001; ##P < 0.01; #P < 0.05, compared with the Sham group. (n = 6, 3 days).
Figure 4
Figure 4
JFG may alleviate damage to the BBB and swelling of the brain caused by ICH. (A) Represents the surface view of EB extravasation at 3days after ICH in each group. (B) Representative bar chart demonstrating the condensed findings of the extravasation of EB dye on day 3 post-ICH. (C) Representative bar graph showing the statistical results of the brain water content using the wet/dry weigh method on 3 day after ICH. Values are presented as means ± S.D. ***P < 0.001; **P < 0.01; *P < 0.05, compared with Model group; ###P < 0.001; ##P < 0.01; #P < 0.05, compared with the Sham group. (n=6,1,3,7,14days).
Figure 5
Figure 5
JFG decreased the migration of activated microglia into the perihematomal tissue after ICH. (A) Representative images showing the staining of Iba-1 tissues from indicated group of rats. Scale bar: 100 μm (B) Bar graph represents the summarized results of the fluorescent intensity. Values are presented as means ± S.D. ***P < 0.001; **P < 0.01; *P < 0.05, compared with the Model group; ###P < 0.001; ##P < 0.01; #P < 0.05, compared with the Sham group. (n = 6, 3 days).
Figure 6
Figure 6
Network of “JFG-Ingredient-Target”. Circle represent 11 herbs in JFG, triangles represent active components, diamonds represent target genes, A, B, C, D represent the common ingredients of 11 medicinal materials in JFG. Notopterygium incisum Ting ex H. T. Chang (Qianghuo, QH), Aurantii Fructus (Zhiqiao, ZQ), Poria cocos (Fuling, FL), Saposhnikovia divaricata (Turcz.) Schischk. (Umbelliferae) Schischk. (Fangfeng, FF), Platycodon grandiflorus (Jacq.) A.DC. (Jiegeng, JG), Heracleum hemsleyanum Diels (Duhuo, DH), Peucedanum praeruptorum Dunn (Qianhu, qH), Glycyrrhiza uralensis Fisch. (Gancao, GC), Radix Bupleuri (Chaihu, CH), Ligusticum chuanxiong Hort. (Chuanxiong, CQ), Nepeta cataria L. (Jingjie, JJ).
Figure 7
Figure 7
Network pharmacology prediction of JFG treatment for stroke. (A) The intersection of JFG targets and disease targets. (B) PPI analysis of JFG and stroke intersection targets. (C) GO enrichment analysis. (D) KEGG enrichment analysis.
Figure 8
Figure 8
Molecular docking results. (A) Binding energy values in molecular docking. (B) AKT1 docked with Phaseol. (C) TNF-α docked with (+)-Anomalin. (D) IL-1B docked with luteolin.
Figure 9
Figure 9
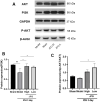
Verification of the protein expression in the tissues from differentially treated rats. (A) Representative blots showing the expression of PI3K, p-AKT, and AKT in the tissues from indicated groups of rats. (B, C) The bar graphs represent the summarized results of the protein expression of PI3K (B) and the ratio of p-Akt/Akt. Values are presented a means ± S.D. ***P < 0.001; **P < 0.01; *P < 0.05, compared with the Model group; ###P < 0.001; ##P < 0.01; #P < 0.05, compared with the Sham group. (n = 6, 3 days).
Figure 10
Figure 10
Verification of the protein expression in the tissues from differentially treated rats. (A) Representative blots showing the expression of TNF-α, IL-1β, and MMP9 in the tissues from indicated groups of rats. (BD) The bar graphs represent the summarized results of the protein expression of TNF-α (B), IL-1β (C), MMP9 (D), and the NO content in serum (E). Values are presented a means ± S.D. ***P < 0.001; **P < 0.01; *P < 0.05, compared with the Model group; ###P < 0.001; ##P < 0.01; #P < 0.05, compared with the Sham group; @@P < 0.01; @P < 0.05, compared with the JFG-H group. (n = 6, 3 days).
Figure 11
Figure 11
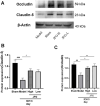
Verification of the protein expression in the tissues from differentially treated rats. (A) Representative blots showing the expression of Claudin-5 and Occludin in the tissues from indicated groups of rats. (B, C) The bar graphs represent the summarized results of the protein expression of Claudin-5 (B) and Occluding (C). Values are presented a means ± S.D. ***P < 0.001; **P < 0.01; *P < 0.05, compared with the Model group; ###P < 0.001; ##P < 0.01; #P < 0.05, compared with the Sham group. (n = 6, 3 days).
Figure 12
Figure 12
Multivariate statistical analysis of metabolites. (A) Represents the Score scatter plot of the PCA model; (B) Represents 3D Score scatter plot of the PCA model. (C, D) Represent the score scatter plots of the OPLS-DA model for the Comparisons between the Sham group and ICH group or the ICH + JFG group and the Model group (D). (E, F) Represent permutation plot tests of the OPLS-DA model for the comparisons between the Sham group and the Model group or the ICH + JFG group and the Model group (F).
Figure 13
Figure 13
Metabolite comprehensive analysis. (A) Representative Pie chart showing the metabolite classification and proportion. (B) The Heatmap showing the results of the hierarchical clustering analysis for all groups. (C, D) Significantly up-regulated metabolites are represented in red, while those significantly down-regulated are represented in blue, unchanged metabolites are shown in gray. The comparisons between ICH and control groups (C) or ICH + JFG and ICH groups (D) are showed. (E, F) The first 15 most up- or down-regulated metabolites are displayed. The comparisons between ICH and control groups (E) or ICH + JFG and ICH groups (F) are showed.
Figure 14
Figure 14
Comprehensive analysis of metabolic pathways. Each bubble in the bubble map represents a metabolic pathway. (A, B) The comparisons between ICH and Sham groups (A) or ICH + JFG and ICH groups (B) are showed. (C) Represents the metabolic pathways found by metabolomics analysis.

Similar articles

Cited by

References

    1. Wang Y, Jing J, Meng X, Pan Y, Wang Y, Zhao X, Lin J, Li W, Jiang Y, Li Z, Zhang X, Yang X, Ji R, et al.. The Third China National Stroke Registry (CNSR-III) for patients with acute ischaemic stroke or transient ischaemic attack: design, rationale and baseline patient characteristics. Stroke Vasc Neurol. 2019; 4:158–64. 10.1136/svn-2019-000242 - DOI - PMC - PubMed
    1. Katan M, Luft A. Global Burden of Stroke. Semin Neurol. 2018; 38:208–11. 10.1055/s-0038-1649503 - DOI - PubMed
    1. Wan Y, Holste KG, Hua Y, Keep RF, Xi G. Brain edema formation and therapy after intracerebral hemorrhage. Neurobiol Dis. 2023; 176:105948. 10.1016/j.nbd.2022.105948 - DOI - PMC - PubMed
    1. Qi Z. Role and mechanism of IL-23 / IL-17 axis in secondary inflammatory injury after intracerebral hemorrhage, Third Military Medical University. 2017.
    1. Hostettler IC, Seiffge DJ, Werring DJ. Intracerebral hemorrhage: an update on diagnosis and treatment. Expert Rev Neurother. 2019; 19:679–94. 10.1080/14737175.2019.1623671 - DOI - PubMed

Publication types

MeSH terms

Substances