. 2024 Jun 12;72(23):13039-13053.
doi: 10.1021/acs.jafc.3c09132. Epub 2024 May 29.

Elevated PINK1/Parkin-Dependent Mitophagy and Boosted Mitochondrial Function Mediate Protection of HepG2 Cells from Excess Palmitic Acid by Hesperetin

Affiliations

Elevated PINK1/Parkin-Dependent Mitophagy and Boosted Mitochondrial Function Mediate Protection of HepG2 Cells from Excess Palmitic Acid by Hesperetin

Wan Li et al. J Agric Food Chem. .

Abstract

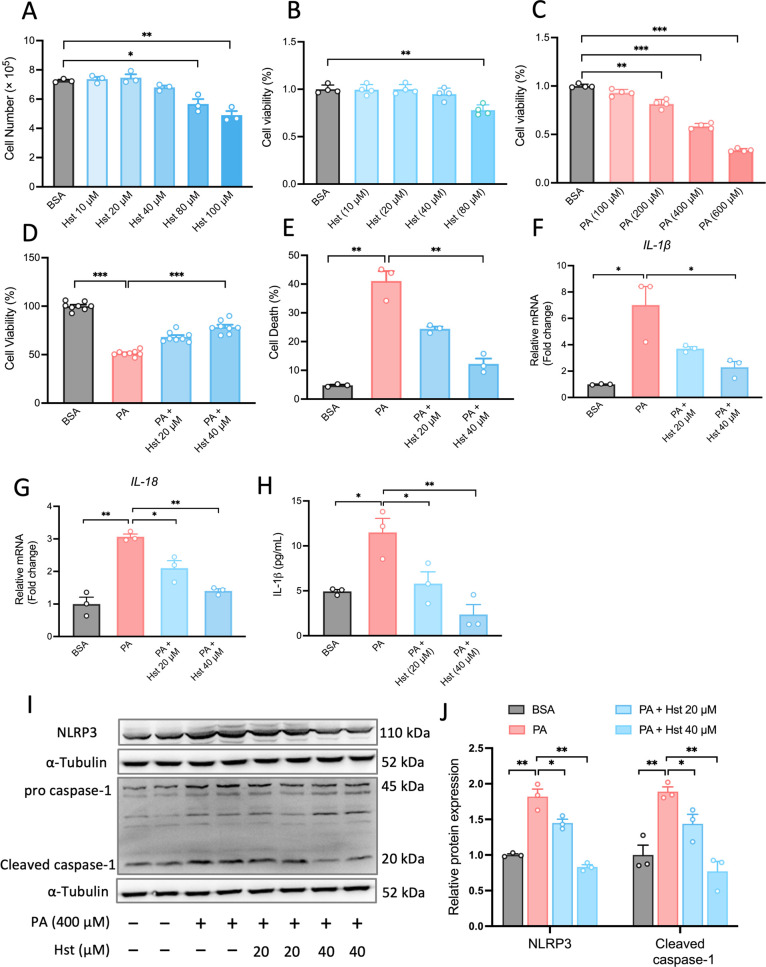
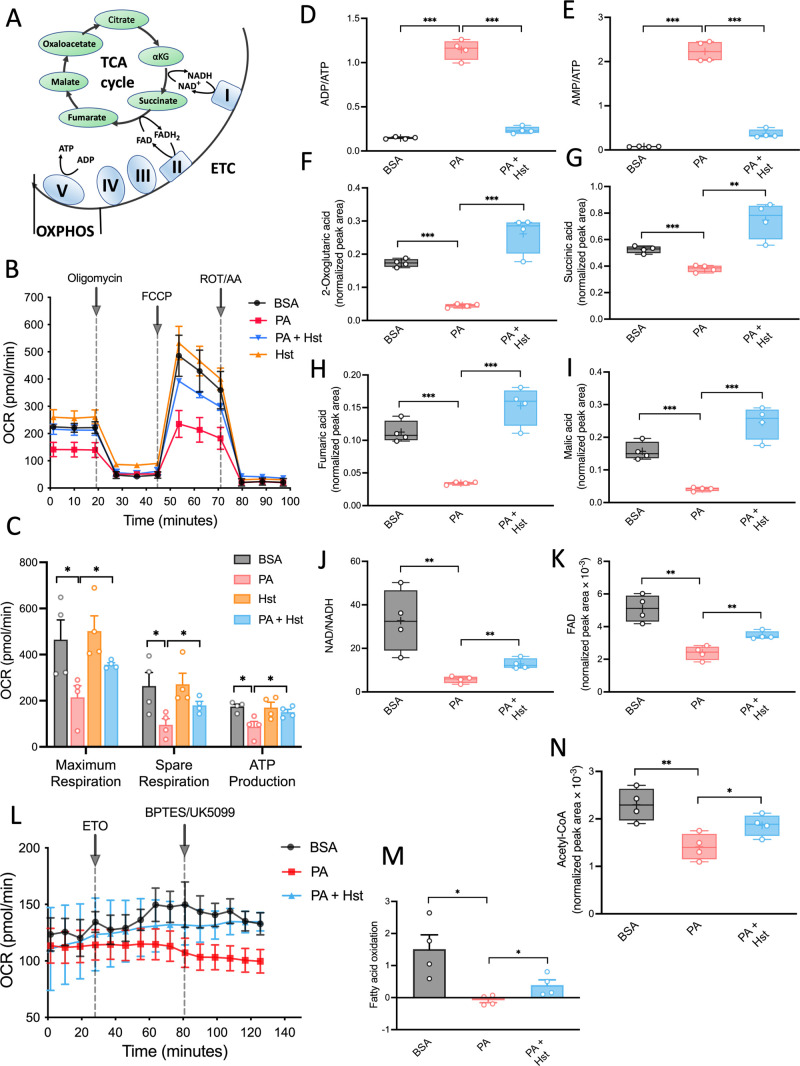
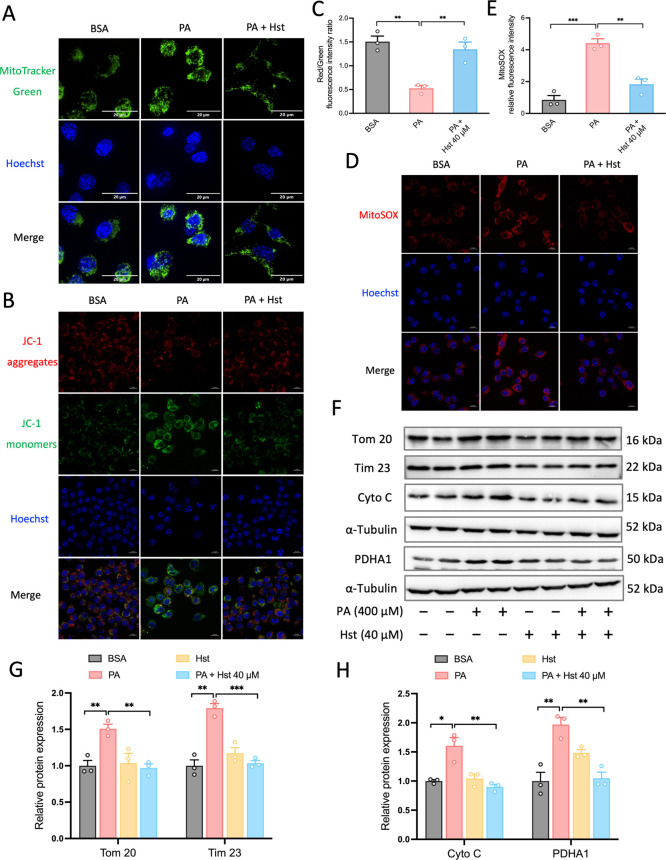
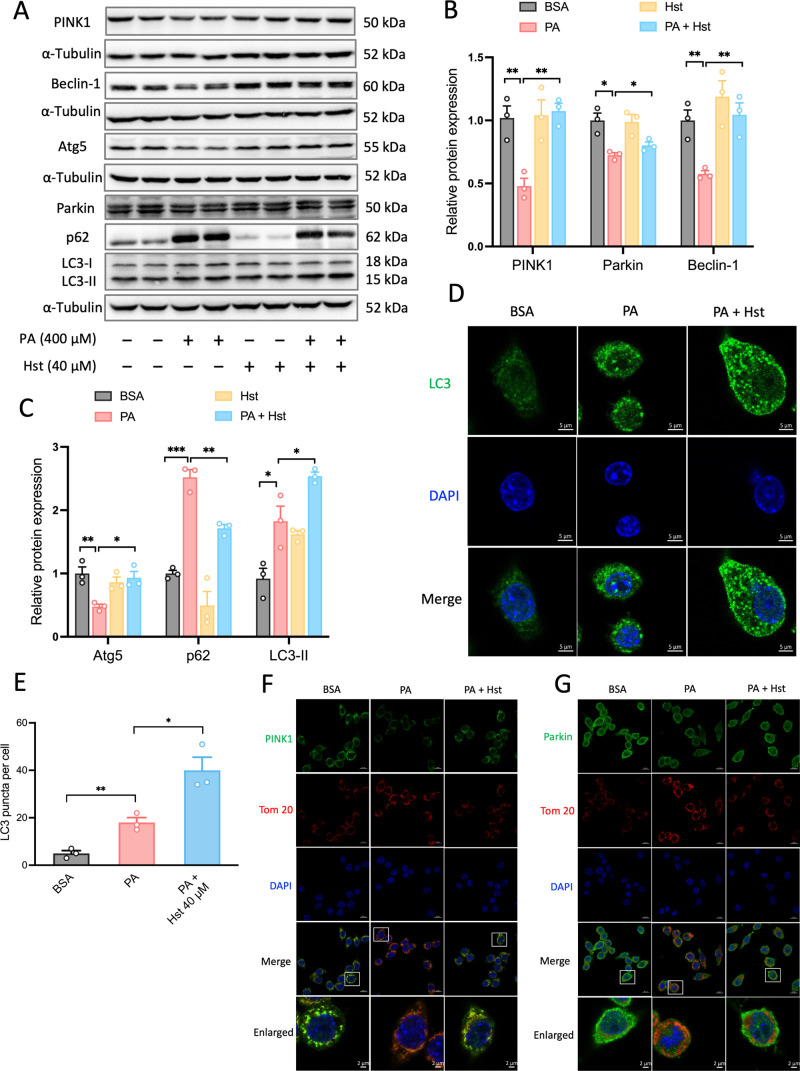
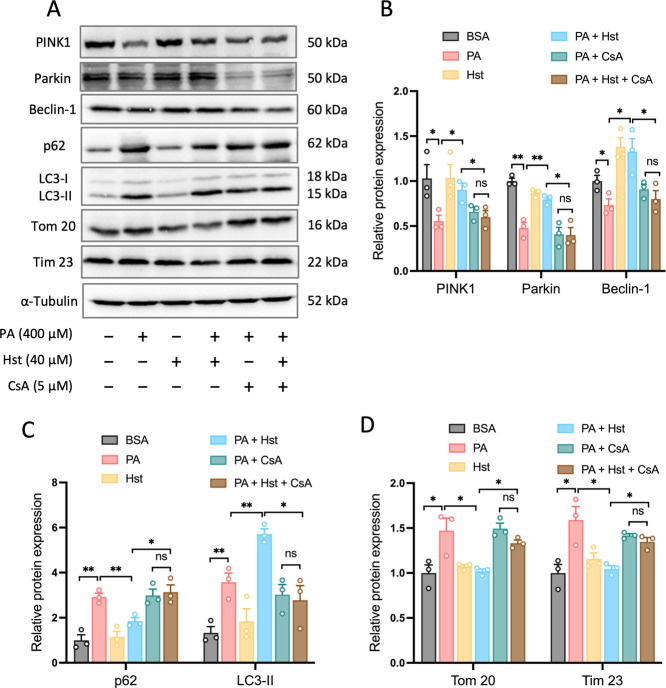
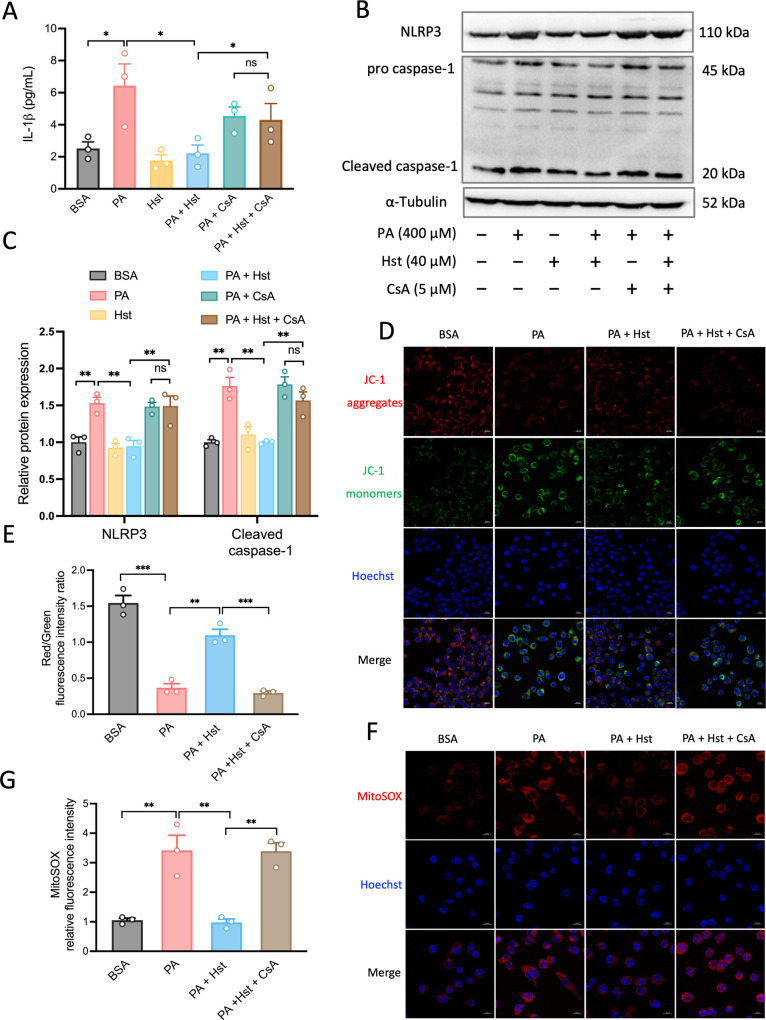
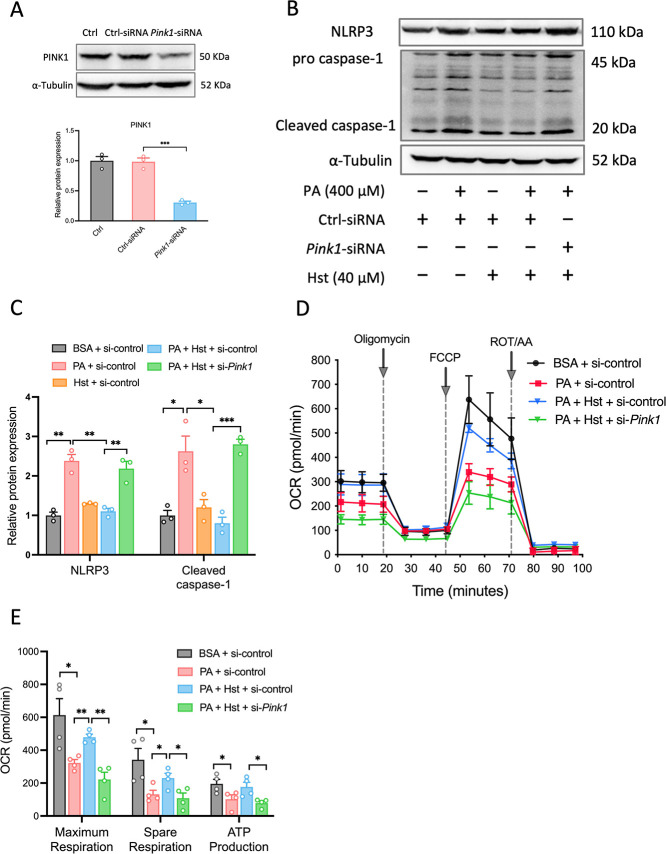
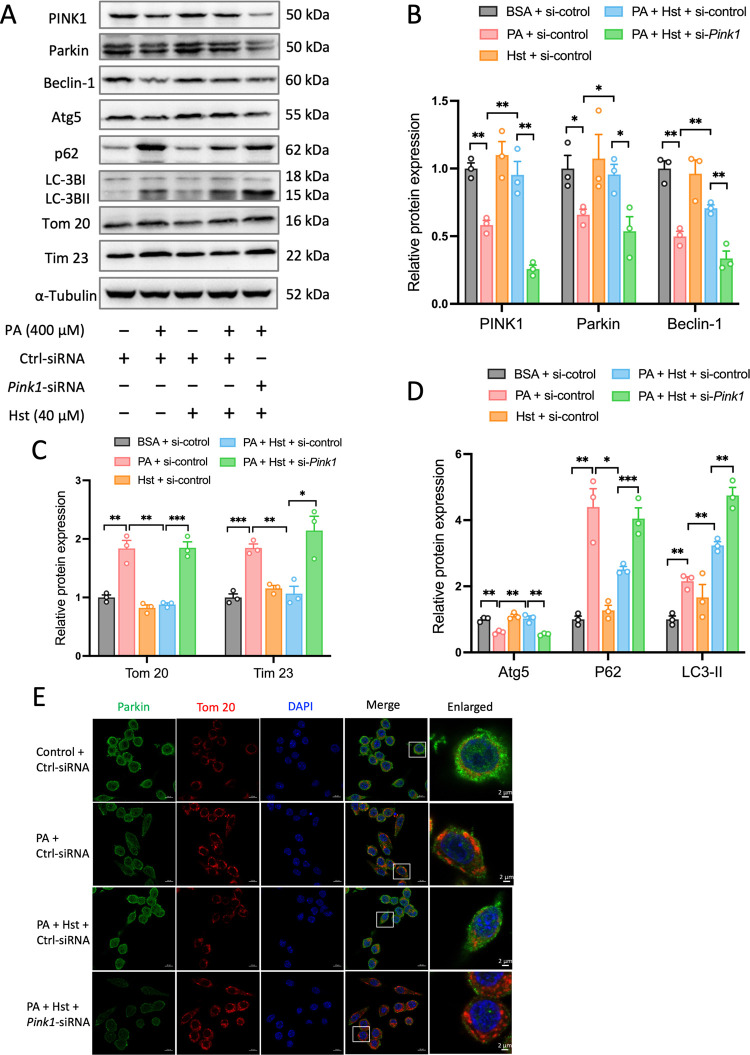
Deregulation of mitochondrial functions in hepatocytes contributes to many liver diseases, such as nonalcoholic fatty liver disease (NAFLD). Lately, it was referred to as MAFLD (metabolism-associated fatty liver disease). Hesperetin (Hst), a bioactive flavonoid constituent of citrus fruit, has been proven to attenuate NAFLD. However, a potential connection between its preventive activities and the modulation of mitochondrial functions remains unclear. Here, our results showed that Hst alleviates palmitic acid (PA)-triggered NLRP3 inflammasome activation and cell death by inhibition of mitochondrial impairment in HepG2 cells. Hst reinstates fatty acid oxidation (FAO) rates measured by seahorse extracellular flux analyzer and intracellular acetyl-CoA levels as well as intracellular tricarboxylic acid cycle metabolites levels including NADH and FADH2 reduced by PA exposure. In addition, Hst protects HepG2 cells against PA-induced abnormal energetic profile, ATP generation reduction, overproduction of mitochondrial reactive oxygen species, and collapsed mitochondrial membrane potential. Furthermore, Hst improves the protein expression involved in PINK1/Parkin-mediated mitophagy. Our results demonstrate that it restores PA-impaired mitochondrial function and sustains cellular homeostasis due to the elevation of PINK1/Parkin-mediated mitophagy and the subsequent disposal of dysfunctional mitochondria. These results provide therapeutic potential for Hst utilization as an effective intervention against fatty liver disease.

Keywords: PINK1/Parkin-mediated mitophagy degradation; TCA cycle and fatty acid oxidation; hesperetin; metabolomics; mitochondrial dysfunction.


Conflict of interest statement

The authors declare no competing financial interest.

Figures

Figure 1
Figure 1
Hesperetin (Hst) attenuated palmitic acid (PA)-induced NLRP3 inflammasome activation in HepG2 cells. (A) Cells treated with Hst at indicated concentrations of 10, 20, 40, 80, and 100 μM for 24 h, the number of viable cells in HepG2 cells. (B,C) Cell viability of HepG2 cells incubated with Hst (10, 20, 40, and 80 μM), or PA (100, 200, 400, and 600 μM), respectively, for 24 h. HepG2 cells pretreated with or without Hst at concentrations of 20 and 40 μM for 4 h and then exposed to PA (400 μM) for 24 h. (D) Cell viability, (E) cell death, mRNA expression of (F) IL-1β and (G) IL-18 measured by qPCR and (H) IL-1β secretion assessed by ELISA. (I) Representative immunoblotting and (J) quantification of NLRP3 and caspase-1 proteins. α-Tubulin was used as a loading control. Data are presented as mean ± SEM of n ≥ 3 independent experiments. *p < 0.05, **p < 0.01, ***p < 0.001 (unpaired two-tailed student’s t test).
Figure 2
Figure 2
Hesperetin (Hst) elevated palmitic acid (PA)-induced abnormal mitochondrial metabolism in HepG2 cells. Cells were preincubated with Hst (40 μM) for 4 h and then exposed to PA (400 μM) for 24 h. (A) Schematics of the TCA cycle and OXPHOS. (B) Oxygen consumption (OCR) and (C) individual parameters for maximum respiration, spare respiration, and ATP production. (D,E) Ratio of ADP/ATP and AMP/ATP. (F–K) Intercellular levels of metabolites from the TCA cycle. MS peak areas were normalized to internal standards and corresponding pellet protein concentration. (L,M) Fatty acid dependency of OXPHOS was measured by a Seahorse Excellular Flux Analyzer. (N) Intercellular levels of acetyl-CoA. MS peak areas were normalized to internal standards and corresponding pellet protein concentration. Data are presented as mean ± SEM of n = 4 independent experiments. *p < 0.05, **p < 0.01, ***p < 0.001 (unpaired two-tailed student’s t test).
Figure 3
Figure 3
Hesperetin (Hst) reduced palmitic acid (PA)-elicited mitochondrial dysfunction and damaged mitochondria accumulation in HepG2 cells. Cells were pretreated with or without Hst at a concentration of 40 μM for 4 h prior to stimulation with PA (400 μM) for 24 h. (A) Cells were stained with MitoTracker Green and images were taken by spinning disk confocal microscopy. Nuclei were counterstained with Hoechst 33342 (blue). (B) Representative images and (C) quantification of mitochondrial membrane potential and mitochondrial ROS (D,E). (F) Representative immunoblotting and (G,H) quantification of the indicated mitochondrial proteins. α-Tubulin was used as a loading control. Nuclei were counterstained with Hoechst 33342 (blue). Data are presented as mean ± SEM of n = 3 independent experiments. *p < 0.05, **p < 0.01, ***p < 0.001 (unpaired two-tailed student’s t test). Scale bars are 20 μm in (A), 10 μm in (B,D).
Figure 4
Figure 4
Hesperetin (Hst) restored palmitic acid (PA)-impaired mitophagy-mediated degradation in HepG2 cells. Cells were preincubated with Hst for 4 h at a concentration of 40 μM and then treated with or without PA (400 μM). (A) Representative immunoblotting and (B,C) quantification of the indicated proteins. α-Tubulin was used as a loading control. Cells were immunostained for LC3 (green). (D) Representative images and (E) quantification of the numbers of punctate LC3+ structures per cell. Representative immunostained images of (F) Tom 20 and PINK1, (G) Tom 20 and Parkin in HepG2 cells. Nuclei were counterstained with DAPI (blue). Data are presented as mean ± SEM of n = 3 independent experiments. *p < 0.05, **p < 0.01, ***p < 0.001 (unpaired two-tailed student’s t test). Scale bars are 5 μm in (D), and 10 μm in (F,G).
Figure 5
Figure 5
Treatment with cyclosporin (CsA) decreased Hesperetin (Hst)-induced PINK1-driven mitophagy in palmitic acid (PA)-stimulated HepG2 cells. Cells were pretreated with or without CsA (5 μM) for 4 h in the absence or presence of 40 μM Hst before the addition of PA (400 μM). (A) Representative immunoblotting and (B–D) quantification of the indicated proteins. Data are presented as mean ± SEM of n = 3 independent experiments. *p < 0.05, **p < 0.01, ***p < 0.001 (unpaired two-tailed student’s t test).
Figure 6
Figure 6
Inhibition of mitophagy by cyclosporin (CsA) blunted the protective effect of Hesperetin (Hst) against palmitic (PA)-triggered NLRP3 inflammasome activation and mitochondrial dysfunction in HepG2 cells. Cells were pretreated with or without CsA (5 μM) for 4 h in the absence or presence of 40 μM of Hst before addition of PA (400 μM). (A) IL-1β production determined by ELISA assay. (B) Representative immunoblots and (C) quantification of NLRP3 and caspase-1. α-Tubulin was used as a loading control. Cells were loaded with JC-1 (mitochondrial membrane potential fluorescent probe, 2 μM) or with mitoSOX (red, mitochondrial ROS indicator, 1 μM), and analyzed by confocal microscope. Representative images and quantification of (D,E) mitochondrial membrane potential and (F,G) mitochondrial ROS. Nuclei were counterstained with Hoechst 33342 (blue). Data are presented as mean ± SEM of n = 3 independent experiments. *p < 0.05, **p < 0.01, ***p < 0.001 (unpaired two-tailed student’s t test). Scale bars are 10 μm.
Figure 7
Figure 7
Suppression of NLRP3 inflammasome activation and mitochondrial dysfunction by Hesperetin (Hst) is mediated by PINK1 in HepG2 cells. Cells were transduced with control-siRNA or Pink1-siRNA, and then pretreated with or without 40 μM Hst for 4 h in the presence or absence of 400 μM palmitic acid (PA). (A) Representative immunoblotting and quantification of PINK1 protein expression. (B) Representative immunoblotting and (C) quantification of NLRP3 inflammasome. (D) Oxygen consumption (OCR) and (E) individual parameters for maximum respiration, spare respiration, and ATP production. Data are presented as mean ± SEM of n ≥ 3 independent experiments. *p < 0.05, **p < 0.01, ***p < 0.001 (unpaired two-tailed student’s t test).
Figure 8
Figure 8
PINK1-directed mitophagy involved preventive effects of Hesperetin (Hst) in palmitic acid (PA)-treated HepG2 cells. Cells were transduced with control-siRNA or Pink1-siRNA, and then preincubated with or without 40 μM Hst for 4 h prior to exposure to 400 μM of PA. (A) Representative immunoblotting and (B–D) quantification of indicated proteins. Representative immunostained images of (E) Parkin and Tom 20 in HepG2 cells. Nuclei were counterstained with DAPI (blue). Data are presented as mean ± SEM of n = 3 independent experiments. *p < 0.05, **p < 0.01, ***p < 0.001 (unpaired two-tailed student’s t test). Scale bars, 10 μm.

References

    1. Rinella M. E.; Sanyal A. J. Management of NAFLD: a stage-based approach. Nature reviews Gastroenterology & hepatology 2016, 13 (4), 196–205. 10.1038/nrgastro.2016.3. - DOI - PubMed
    1. Mundi M. S.; Velapati S.; Patel J.; Kellogg T. A.; Abu Dayyeh B. K.; Hurt R. T. Evolution of NAFLD and its management. Nutrition in Clinical Practice 2020, 35 (1), 72–84. 10.1002/ncp.10449. - DOI - PubMed
    1. Byrne C. D.; Targher G. NAFLD: a multisystem disease. Journal of hepatology 2015, 62 (1), S47–S64. 10.1016/j.jhep.2014.12.012. - DOI - PubMed
    1. Friedman S. L.; Neuschwander-Tetri B. A.; Rinella M.; Sanyal A. J. Mechanisms of NAFLD development and therapeutic strategies. Nature medicine 2018, 24 (7), 908–922. 10.1038/s41591-018-0104-9. - DOI - PMC - PubMed
    1. Chen Z.; Tian R.; She Z.; Cai J.; Li H. Role of oxidative stress in the pathogenesis of nonalcoholic fatty liver disease. Free Radical Biol. Med. 2020, 152, 116–141. 10.1016/j.freeradbiomed.2020.02.025. - DOI - PubMed

MeSH terms