. 2024 Jul 1;35(7):ar100.
doi: 10.1091/mbc.E24-01-0013. Epub 2024 May 29.

Fluorescent protein tags affect the condensation properties of a phase-separating viral protein

Affiliations

Fluorescent protein tags affect the condensation properties of a phase-separating viral protein

Russell J R Barkley et al. Mol Biol Cell. .

Abstract

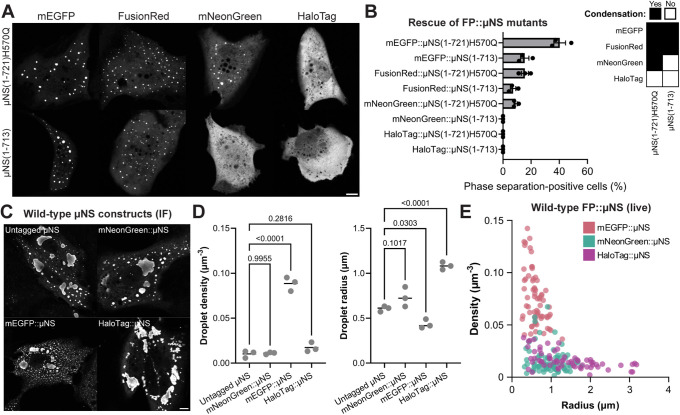
Fluorescent protein (FP) tags are extensively used to visualize and characterize the properties of biomolecular condensates despite a lack of investigation into the effects of these tags on phase separation. Here, we characterized the dynamic properties of µNS, a viral protein hypothesized to undergo phase separation and the main component of mammalian orthoreovirus viral factories. Our interest in the sequence determinants and nucleation process of µNS phase separation led us to compare the size and density of condensates formed by FP::µNS to the untagged protein. We found an FP-dependent increase in droplet size and density, which suggests that FP tags can promote µNS condensation. To further assess the effect of FP tags on µNS droplet formation, we fused FP tags to µNS mutants to show that the tags could variably induce phase separation of otherwise noncondensing proteins. By comparing fluorescent constructs with untagged µNS, we identified mNeonGreen as the least artifactual FP tag that minimally perturbed µNS condensation. These results show that FP tags can promote phase separation and that some tags are more suitable for visualizing and characterizing biomolecular condensates with minimal experimental artifacts.


Conflict of interest statement

Conflicts of interests: The authors declare no financial conflict of interest.

Figures

FIGURE 1:
FIGURE 1:
moxGFP::µNS VFLS are morphologically spherical. (A) ColabFold predicted structure of ReoV µNS (T1L, top). The model was sequentially colored from blue (N-terminus) to red (C-terminus). Residues 1, 472, and 721 were annotated. Structural disorder prediction scores (bottom) from PONDR-FIT and IUPred3 indicate that µNS is likely to be highly ordered, mostly lacking IDRs. Coiled coil domains predicted by MARCOIL were indicated in gold bands. (B) Representative immunofluorescence images of ReoV (T1L) infection with or without microtubule depolymerization, and transfected cells expressing untagged or moxGFP-tagged µNS after 24 h. Infected cells were treated with 10 µM nocodazole to disrupt microtubules, or an equal volume of DMSO as a vehicle control at 1 h postinfection. Bar, 10 µm. (C) The circularity and roundness of µNS VFLS and filamentous or globular MRV (T1L) viral factories. Measurements were constrained to particles with >1 µm area. Confocal microscopy images as shown in B were analyzed and the global mean for all replicates (N = 38–60 per sample) was plotted from three independent experiments. NCZ = nocodazole. (D) Maximum-intensity projection of a representative CV-1 cell expressing moxGFP::µNS(1-721) at 24 h post-transfection, acquired by LLSM. (E) Corresponding x-z (top) and x-y (bottom) cross-sectional slices from D show the spherical nature of inclusion bodies in isotropic resolution. Bar, 2 µm. (F) 3D measurements of inclusion body volume and sphericity from the image represented in D indicate highly spherical VFLS, even among large inclusion bodies.
FIGURE 2:
FIGURE 2:
moxGFP::µNS inclusions undergo fusion and fission with liquid-like characteristics. (A) Representative frames of moxGFP::µNS VFLS coalescence events from spinning disk confocal microscopy time-lapse videos of live transfected cells at 24 h post-transfection. 100X objective fields were captured at a 100 ms acquisition rate. Bar, 1 µm. (B) Example plot of the measured shape aspect ratio of two fusing moxGFP::µNS inclusions at similar length scales. Two VFLS make contact and the aspect ratio is ∼2, then after a short delay, it exponentially decayed to an A.R. of ∼1. (C) Inverse capillary velocity (ICV) plot of ReoV µNS. moxGFP::µNS(1-721) (N = 75) (in blue) and moxGFP::µNS(472-721) (N = 29) (in yellow) fusion events were observed with one outlier excluded from the analysis (see statistics and reproducibility). The ICV was determined from the slope of a simple linear regression fit to the data, which is 5.814 s/µm, 95% CI [3.044, 8.583] for moxGFP::µNS(1-721) and 4.6 s/µm, 95% CI [−0.2344, 9.435] for moxGFP::µNS(472-721). 95% CI bands are shown. moxGFP::µNS(1-721) is significantly nonzero (p < 0.0001) while moxGFP::µNS(472-721) is insignificant (p = 0.0613). The slopes of the linear regressions do not significantly differ (p = 0.6157). (D) Example of a rupturing liquid bridge observed during droplet fission. The ROI shows bridge formation, rupture, and retraction in roughly 1 s. Bar, 1 µm.
FIGURE 3:
FIGURE 3:
µNS inclusion bodies are liquid compartments exhibiting slow diffusion rates. (A) Laser-scanning confocal microscope imaging of photoconverted Dendra2::µNS droplets fusing after selective 405 nm photoconversion (“PC”) demonstrated isotropic diffusion, redistributing the construct homogeneously. Example images of live cells were captured using a Zeiss LSM880 confocal microscope at 22–26 h post-transfection. Timestamps display minutes and seconds. (B) Schematic of MP-FRAP acquisition. A focused 920 nm beam parked in a condensate is rapidly modulated by Pockels Cell actuation, enabling diffusive fluorescence recovery monitoring in a two-photon excitation spot at micron and microsecond resolution. SR-430 photon counter traces are displayed and fit to a model of diffusive recovery in custom-written MP-FRAP software. The example trace (from acquisition highlighted in Supplemental Figure S3) normalized fluorescence recovery and fitting results are displayed. The unitless quantity F/F0 is the sum of photon counts per time bin, normalized to the prebleach mean. β is the unitless bleach depth parameter, D is the diffusion coefficient in μm²/s, and the immobile fraction is unitless. (C) Summary of Levenberg-Marquardt fitting results of moxGFP::μNS(1-721) (N = 67) and moxGFP::μNS(472-721) (N = 8) traces acquired 20–26 h after transfection. Statistics performed by Conover-Iman rank test with Holm-Bonferroni correction after rejection of null hypothesis in Kruskal–Wallis H-test.
FIGURE 4:
FIGURE 4:
Droplet nucleation and growth kinetics show the first 471 residues of µNS are important for nucleation. (A) The radius and density of moxGFP::µNS droplets were quantified at 6, 12, and 24 h post-transfection in live cells. The mean number of droplets per µm3 (middle) and their mean radius (left) in each independent experiment were plotted with a connecting line through the grand means. moxGFP::µNS(1-721) nucleated a higher density of droplets at 6 h post-transfection (right). An unpaired two-tailed t test yielded a statistically significant difference (p < 0.0001) between the two samples. N = 55 cells were analyzed for moxGFP::µNS(1-721) (in blue) and N = 50 cells for moxGFP::µNS(472-721) (in yellow). (B) Representative frames of the emergence of nascent moxGFP::µNS puncta were recorded using multi-area time-lapse imaging. Bar, 20 µm. (C) Droplet density and growth were measured over the first hour of phase separation in N = 48 moxGFP::µNS(1-721) - (in blue) and N = 66 moxGFP::µNS(472-721) - (in yellow) transfected cells over three independent experiments. All measurements were fit with a simple linear regression with 95% CI bands. Droplet growth (left) and nucleation (right) rates statistically differed (ANCOVA, p < 0.0001). L.O.D. = limit of detection. (D) The relative fluorescence mean gray value (MGV) (a proxy for Csat) was measured one frame before moxGFP::µNS diffraction-limited puncta spontaneously emerged. MGV measurements from background-subtracted images were standardized by the median MGV of moxGFP::µNS(1-721) for N = 18 cells per sample. An unpaired two-tailed t test reached statistical significance (p < 0.0001).
FIGURE 5:
FIGURE 5:
N-terminal FP tags enhance the droplet density of µNS inclusions. (A) moxGFP::µNS-expressing cells were fixed with 4% PFA at 24 h post-transfection. Images were collected of live cells before fixation (live), 10 min after fixation (fixed), and with the laser intensity increased by a factor of 5 (fixed +) in the EGFP channel. The same cells were relocated after immunofluorescence (IF) staining and imaged in the Alexa Fluor 647 channel (stained). Droplet densities were quantified in cells transiently expressing moxGFP::µNS(1-721) (N = 19) or moxGFP::µNS(472-721) (N = 19) over three independent experiments. For each sample, values were made relative to the droplet density of each cell before fixation, then the mean for each experiment was plotted. An ordinary two-way ANOVA indicated a statistical difference between conditions (p = 0.0004) but not constructs (p = 0.5851), nor is there an interaction (p = 0.5718). We applied Dunnett’s test to compare the droplet density of each condition to that of live cells. Bar, 10 µm. (B) Fixation does not affect FusionRed::µNS(1-721) and Dendra2::µNS(1-721) droplet density in transfected CV-1 cells at 24 h post-transfection. The mean droplet density was quantified in live cells before and after the addition of 4% PFA for 10 min over three independent experiments and reached statistical insignificance by ordinary two-way ANOVA (p > 0.05). The laser power was increased after fixation for Dendra2::µNS(1-721)-transfected samples, but not FusionRed::µNS(1-721)-transfected samples because fluorescence reduction was not observed. (C) The moxGFP tag, but not Dendra2 or FusionRed tags, enhanced µNS(1-721) droplet density. IF images of samples expressing untagged µNS or FP::µNS constructs were fixed at 24 h post-transfection and the mean droplet density in three independent experiments was quantified. An ordinary two-way ordinary ANOVA was applied with Dunnett’s test comparing the droplet density of each FP::µNS fusion to that of untagged µNS. Representative IF images are shown on the right. Bar, 10 µm. (D) Quantification of FP::µNS(1-721) droplet density in live cells with three different FP tags. Transfected cells (N = 20–29) expressing moxGFP::µNS(1-721), Dendra2::µNS(1-721) or FusionRed::µNS(1-721) were randomly sampled at 24 h post-transfection to measure droplet densities. Not all samples were normally distributed, so the median for each experiment is reported with a line at the mean, and an ordinary one-way ANOVA (p = 0.0002) with Tukey’s correction for multiple comparisons was applied.
FIGURE 6:
FIGURE 6:
FP tags rescue condensation of µNS mutant constructs that do not phase separate. (A) Untagged µNS mutants harboring the H570Q substitution or C-terminal deletion of residues 714-721 were diffusely distributed in cells. Representative widefield microscopy IF images of CV-1 cells at 24 h post-transfection that were fixed and stained with µNS antiserum were imaged in the Alexa Fluor 594 channel. Bar, 10 µm. (B) Dendra2 and moxGFP tags rescued condensation of µNS mutants. Representative confocal microscopy images of live cells transiently expressing the annotated construct were captured at 22–26 h post-transfection. Bar, 10 µm. (C) FP::µNS mutant constructs formed puncta that exhibited characteristics of phase separation. Time, seconds. Bar, 2 µm. (D) Phase separation–positive cells were scored in the transfected cell population based on the unambiguous presence of one or two phases. (E) The percentage of fluorescent signal in the dense phase (punctate percentage) was quantified in N = ∼60 phase-separated cells and the grand mean (X-axis) was plotted with respect to the mean estimation of the population proportion of phase sepration–positive cells (Y-axis) from D. (F) The radius (X-axis) and density (Y-axis) of droplets were also quantified and the grand mean of three independent experiments was plotted.
FIGURE 7:
FIGURE 7:
mNeonGreen::µNS and untagged µNS inclusions have a similar size and density. (A) Representative images are shown from three independent experiments of live cells expressing GFP-like proteins or HaloTag fused to µNS(1-721)H570Q or µNS(1-713) at 24 h post-transfection. Scale bar, 10 µm. (B) Estimation of the population proportion of phase separation–positive cells from three independent experiments, with a line at the mean and SEM error bars. (C) Representative immunofluorescence images show transfected cells expressing wild-type FP::µNS or untagged µNS that were stained with chicken µNS antiserum (1:1000 dilution) and Alexa Fluor 594 secondary antibodies (1:800 dilution) at 24 h post-transfection. Scale bar, 10 µm. (D) The average droplet density (left) and radius (right) of inclusions per cell per experiment were measured and plotted with a line at the mean. Over three independent experiments, images of cells transfected with wild-type untagged µNS (N = 85), mNeonGreen::µNS (N = 94), mEGFP::µNS (N = 81), or HaloTag::µNS (N = 81), as shown in C, were processed in Fiji. The mean droplet density and radius were calculated per cell and the median from each experiment was plotted. A one-way ANOVA with Dunnett’s test was applied with p values shown. (E) Live cells transiently expressing wild-type mEGFP::µNS (N = 69), mNeonGreen::µNS (N = 76), or HaloTag::µNS (N = 66) were imaged over three independent experiments at 24 h post-transfection and the mean droplet density and radius for each cell is shown.

References

    1. Aarts DGAL, Schmidt M, Lekkerkerker HNW (2004). Direct visual observation of thermal capillary waves. Science 304, 847–850. - PubMed
    1. Alberti S, Gladfelter A, Mittag T (2019). Considerations and challenges in studying liquid-liquid phase separation and biomolecular condensates. Cell 176, 419–434. - PMC - PubMed
    1. Alberto B-N, Menaya-Vargas R, Benavente J, Martinez-Costas J (2010). Avian reovirus μNS protein forms homo-oligomeric inclusions in a microtubule-independent fashion, which involves specific regions of its C-terminal domain. J Virol 84, 4289–4301. - PMC - PubMed
    1. Alenquer M, Vale-Costa S, Etibor TA, Ferreira F, Sousa AL, Amorim MJ (2019). Influenza A virus ribonucleoproteins form liquid organelles at endoplasmic reticulum exit sites. Nat Commun 10, 1629. - PMC - PubMed
    1. Arnold MM, Murray KE, Nibert ML (2008). Formation of the factory matrix is an important, though not a sufficient function of nonstructural protein μNS during reovirus infection. Virology 375, 412–423. - PMC - PubMed

MeSH terms

LinkOut - more resources