. 2024 Jun 4;121(23):e2316364121.
doi: 10.1073/pnas.2316364121. Epub 2024 May 29.

Preictal dysfunctions of inhibitory interneurons paradoxically lead to their rebound hyperactivity and to low-voltage-fast onset seizures in Dravet syndrome

Affiliations

Preictal dysfunctions of inhibitory interneurons paradoxically lead to their rebound hyperactivity and to low-voltage-fast onset seizures in Dravet syndrome

Fabrizio Capitano et al. Proc Natl Acad Sci U S A. .

Abstract

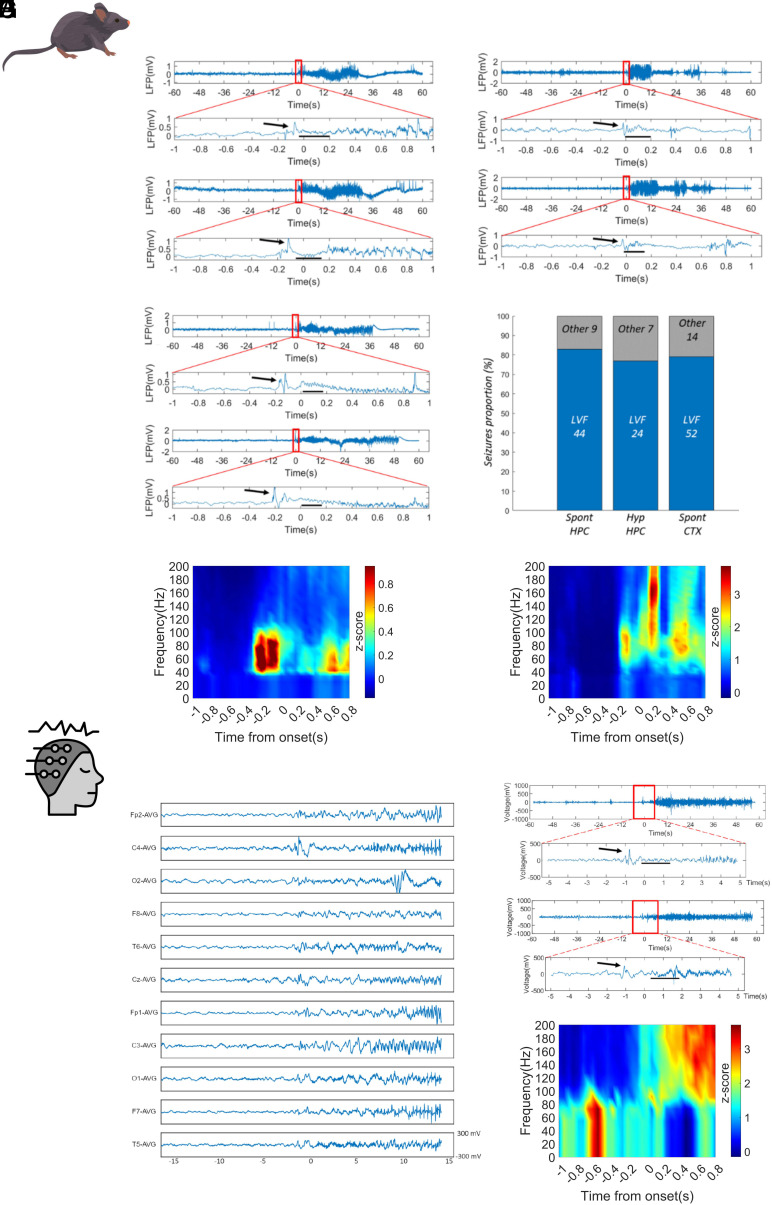
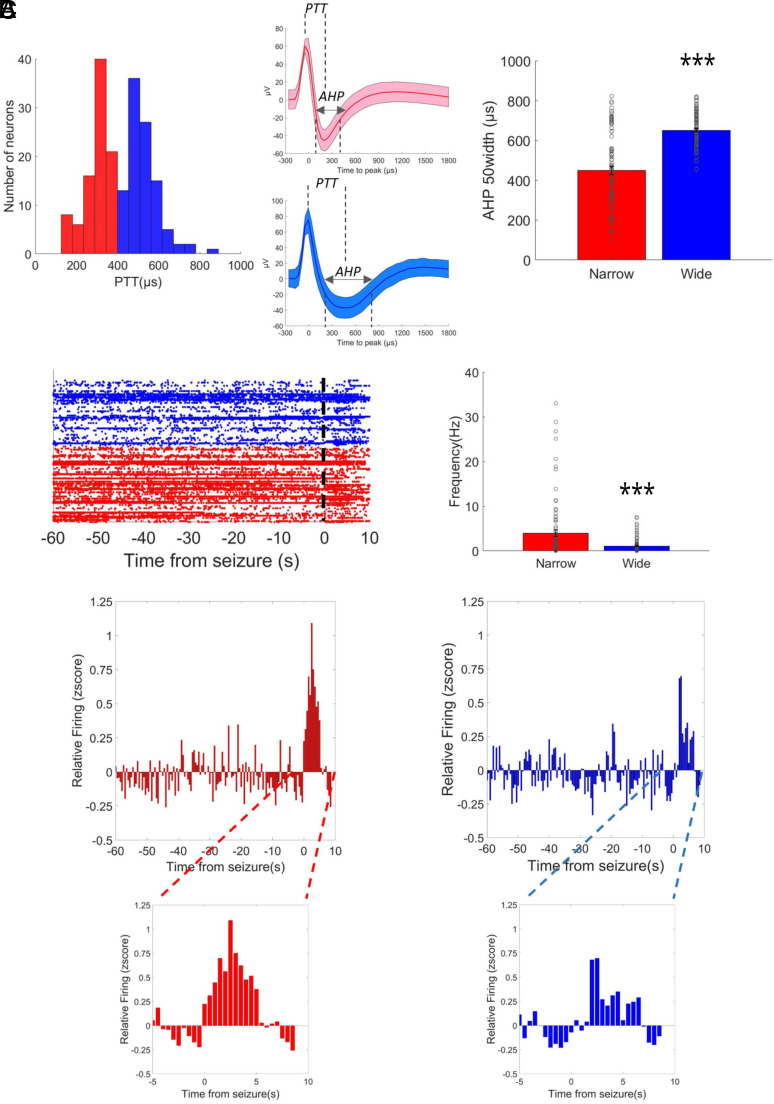
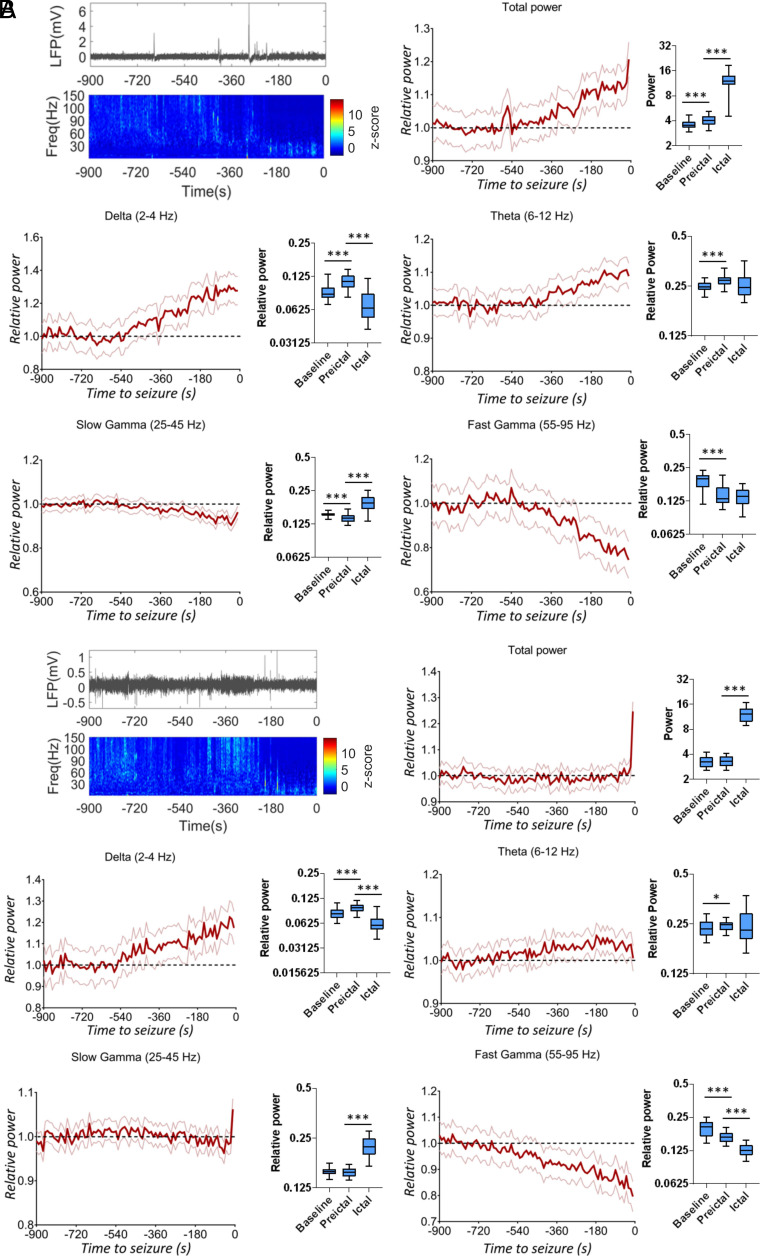
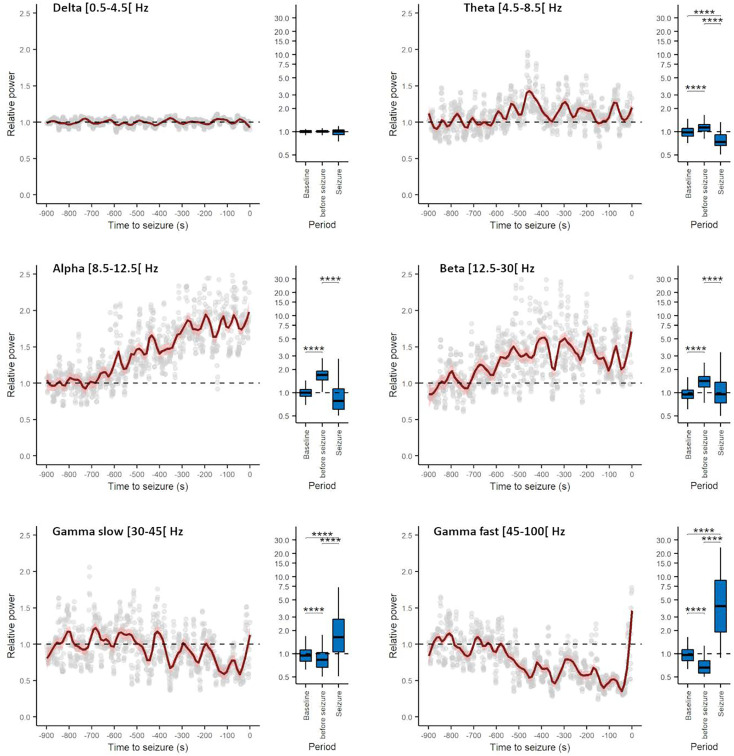
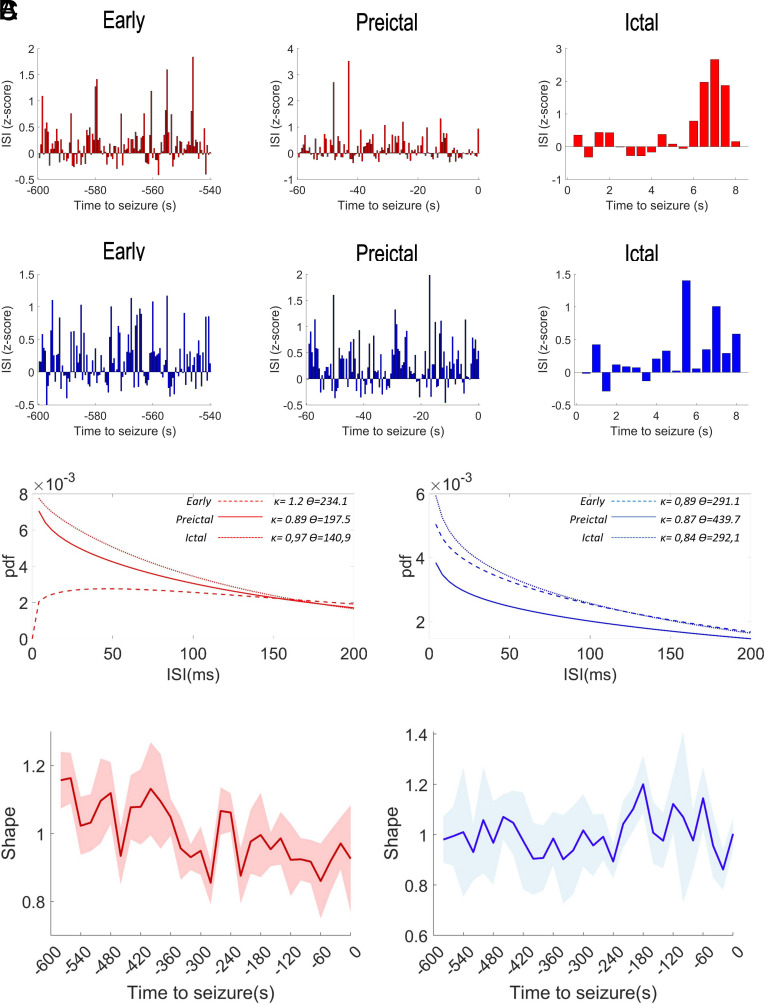
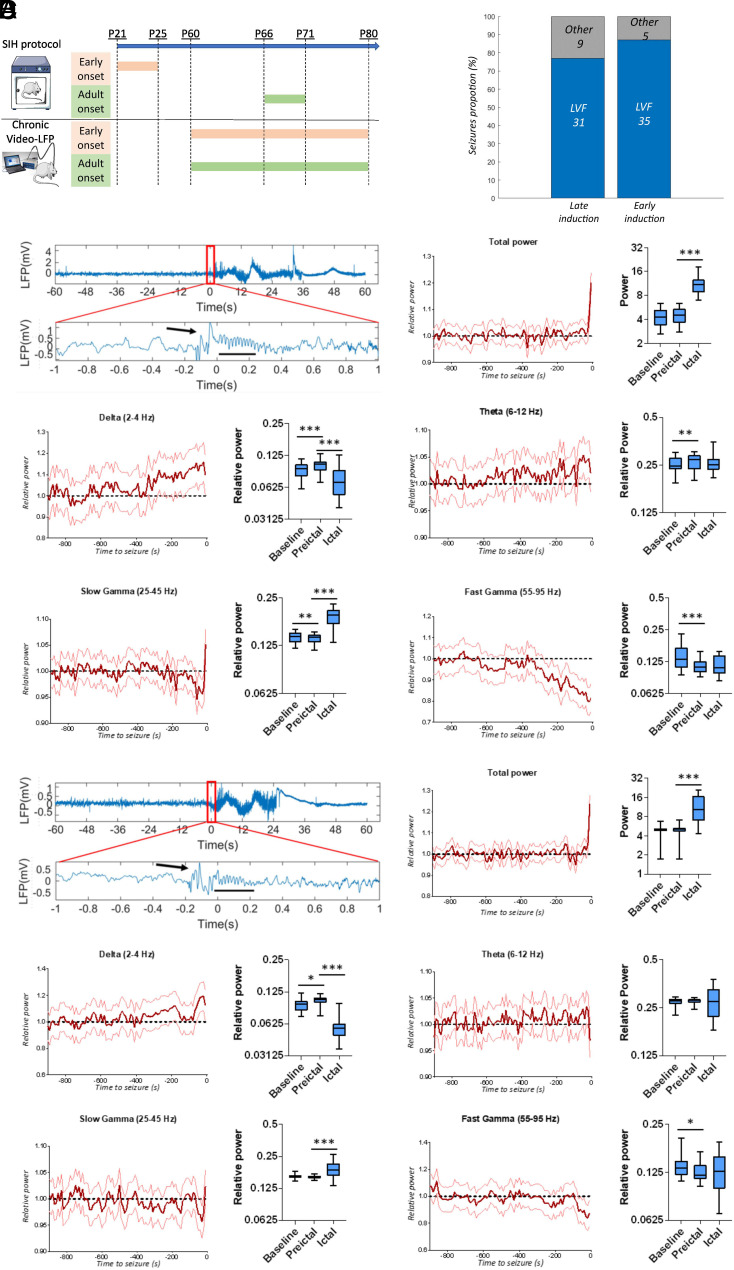
Epilepsies have numerous specific mechanisms. The understanding of neural dynamics leading to seizures is important for disclosing pathological mechanisms and developing therapeutic approaches. We investigated electrographic activities and neural dynamics leading to convulsive seizures in patients and mouse models of Dravet syndrome (DS), a developmental and epileptic encephalopathy in which hypoexcitability of GABAergic neurons is considered to be the main dysfunction. We analyzed EEGs from DS patients carrying a SCN1A pathogenic variant, as well as epidural electrocorticograms, hippocampal local field potentials, and hippocampal single-unit neuronal activities in Scn1a+/- and Scn1aRH/+ DS mice. Strikingly, most seizures had low-voltage-fast onset in both patients and mice, which is thought to be generated by hyperactivity of GABAergic interneurons, the opposite of the main pathological mechanism of DS. Analyzing single-unit recordings, we observed that temporal disorganization of the firing of putative interneurons in the period immediately before the seizure (preictal) precedes the increase of their activity at seizure onset, together with the entire neuronal network. Moreover, we found early signatures of the preictal period in the spectral features of hippocampal and cortical field potential of Scn1a mice and of patients' EEG, which are consistent with the dysfunctions that we observed in single neurons and that allowed seizure prediction. Therefore, the perturbed preictal activity of interneurons leads to their hyperactivity at the onset of generalized seizures, which have low-voltage-fast features that are similar to those observed in other epilepsies and are triggered by hyperactivity of GABAergic neurons. Preictal spectral features may be used as predictive seizure biomarkers.

Keywords: GABA; epilepsy; excitability; seizure prediction; sodium channels.


Conflict of interest statement

Competing interests statement:The authors declare no competing interest.

Figures

Fig. 1.
Fig. 1.
Seizures have LVF onset in Dravet mice and patients. Representative traces of hippocampus LFP recorded during spontaneous seizures (A) or hyperthermic seizures (B) with LVF onset recorded in two different groups Scn1a+/− mice. The black arrows indicate the “sentinel” spike. The black dashes underline the LVF oscillations. The signal around the onset was manually checked and the specific onset point placed at the beginning of abnormal activities. In the case of low-voltage fast pattern, representing the majority of the observed onsets, this was placed after the sentinel spike, at the beginning of LVF activity. (C) Electrocorticogram (ECoG) recorded on the parietal cortex of Scn1a+/− mice during spontaneous seizures, which showed properties that were similar to those of hippocampal LFP. (D) Bar-chart plot displaying the proportion of seizures with LVF onset in the LFP signal recorded in the hippocampus during spontaneous seizures (Spont HPC) or hyperthermia-induced seizures (Hyp HPC) and in the ECoG signal during spontaneous seizures (Spont CTX). (E) Average spectrogram of spontaneous (Left) and hyperthermic (Right) LVF onset seizures showing the low-voltage fast activity localized in the gamma band. N = 44 spontaneous and N = 24 hyperthermic seizures. The color code represents the power z-scored along each frequency bin to better visualize changes over time. (F) Example of seizure onset on the 11-channel EEG of a 10.8-y-old boy with Dravet syndrome and LVF seizure onset pattern (a sentinel spike followed by a low-voltage fast activity) (individual n = 3). (G) Upper panel; trace recorded in one of EEG channels (C4) illustrating the onset of a LVF seizure in a 5.5-y-old boy with Dravet syndrome (individual n = 2). Lower panel; trace recorded in one of EEG channels (C4) illustrating the onset of a LVF seizure in a 9.1-y-old boy with Dravet syndrome (individual n = 6). A zoom on the 12 s around the onset of the seizure (red rectangle) is provided for both traces. The black arrows indicate the “sentinel” spike; the black segments highlight the LVF oscillations. (H) Average EEG spectrogram of LVF onset seizures showing the low-voltage fast activity that is localized in the gamma band. N = 6 seizures.
Fig. 2.
Fig. 2.
Dynamics of single neuronal units in LVF seizures of Dravet mice. (A) Identification of putative neuronal subpopulations by action potential shape. The spike duration was evaluated by peak-to-trough duration (PTT) and shows a bimodal shape, consistent with the presence of sharp spiking (red) and widely spiking (blue) neurons. In the middle, two examples of sharp spiking and widely spiking neurons are shown. The line represents the average action potential shape, and the shaded area represents the SD. The analysis of the after-hyperpolarization (AHP) duration and of the average firing frequency revealed a significant difference between the two populations. (B) Representation of the neuronal activity of the two putative neuronal populations. The analysis of average firing frequency revealed a higher activity of sharply spiking neurons. (C) Quantification of neuronal activity in the preictal period and at onset of seizures. The Insets on the bottom show for each subpopulation the activity zoomed around the seizure’s onset. N = 72 narrow spiking and N = 70 wide spiking neurons. ***P < 0.001.
Fig. 3.
Fig. 3.
Seizures are preceded by early modifications of LFP spectral properties in mice. (A) Representative hippocampal LFP recording in the preictal period with its corresponding spectrogram and quantification of mean spectral power decomposed in different frequency bands (the 95% CI for the different time points is displayed), showing an increase for slow rhythms and theta oscillations and a decrease for fast oscillations (mixed model repeated measures ANOVA, P < 0.0001 for delta, theta, slow gamma, and fast gamma bands; n = 54 seizures recorded in N = 6 mice). (B) Preictal representative cortical ECoG recording with the corresponding spectrogram and spectral decomposition, which showed features that were similar to those of hippocampal LFP recordings (mixed model repeated measures ANOVA, P < 0.0001 for delta, theta, slow gamma, and fast gamma bands; n = 70 seizures in N = 9 mice). The average power in the baseline, preictal, and ictal period was compared by a mixed-effects ANOVA followed by a Tukey’s post hoc test for pair-wise multiple comparison. *P < 0.05, **P < 0.01, ***P < 0.001.
Fig. 4.
Fig. 4.
Generalized convulsive seizures are preceded by early changes in the spectral properties of all EEG channels in individuals with Dravet syndrome, as in mice LFP and ECoG. Evolution of the average relative power spectrum in the different EEG bands (number of channels = 46, number of seizure = 3, number of individuals = 3). The fast Fourier transform of the signal was computed and the power quantified from 900 s before seizure onset to 200 s after seizure onset over nonoverlapping 10 s windows in delta (0.5 to 4.5 Hz), theta (4.5 to 8.5 Hz), alpha (8.5 to 12.5 Hz), beta (12.5 to 30 Hz), slow gamma (30 to 45 Hz), and fast gamma (45 to 100 Hz) bands. The spectral power of different frequency bands was normalized on the average between 900 and 700 s before the seizures (considered interictal period). Three of the seizures included in Fig. 1H were not included here because their interictal period was not present in the recordings or not clearly identifiable (multiple seizures in the same patient). The time-series plots show a 900 s window before seizure onset. The normalized power spectra between the interictal period, the 200 s prior to seizure onset, and the 200 s after seizure onset (displayed in the box-chart plots) was compared using Kruskal–Wallis ANOVA on ranks followed by post hoc Dunn’s test for pairwise multiple comparisons. *P < 0.05, **P < 0.01, ***P < 0.001, ****P < 0.0001.
Fig. 5.
Fig. 5.
Seizures are preceded by early modifications in the firing dynamics of putative inhibitory neurons. (A) Quantification of the ISI, displayed s binned time series in 1-min windows 10 min before the spontaneous seizures (early) or immediately before the spontaneous seizures (preictal) and in an 8-s window after the seizure onset, for sharply spiking neurons (red, Upper panels) and widely spiking neurons (blue, Lower panels). (B) Gamma distribution fitting of the probability density function (pdf) of the ISI (in the form pdf = f(x) = [1/Г(κ) ϴκ] x(κ−1) e(−x/ϴ); where Г(κ) is the gamma function) for the three windows displayed in A for sharply spiking neurons (Left) and widely spiking neurons (Right). The κ and ϴ values, respectively, represent the shape and the scale of the gamma distributions (35, 36), and are the means of the parameters obtained fitting the ISI distributions of the single neurons. (C) Sharply spiking neurons (in red on the Left) show a significant and progressive reduction of gamma distribution shape in the preictal period, whereas we did not find any modifications of the firing dynamics of widely spiking neurons in the same period (in blue on the Left). The solid lines are the time series of the mean values for the bins and the shaded areas represent the 95% CI.
Fig. 6.
Fig. 6.
Properties of the seizure’s onset and of the preictal LFP do not depend on the specific mutation or on the natural history. (A) Experimental protocol for triggering a DS-like phenotype in asymptomatic Scn1aRH/+ mice: We exposed Scn1aRH/+ mice to daily single short seizures induced by hyperthermia during a 5-d period (SIH protocol) either at P21 or in adulthood (P66), and we chronically recorded the hippocampal LFP in both groups starting at P60. The longitudinal recording of mice induced in adulthood allowed the quantification of seizures also before, during, and immediately after the SIH protocol. This confirmed that spontaneous seizures are almost absent before the SIH protocol (only one mouse out of seven displayed few spontaneous seizures), revealed that spontaneous seizures appeared in all mice between the third and the fifth day of the SIH protocol, and showed that they were still present even several weeks after the SIH protocol. These findings extend our published results (17), showing that an SIH protocol of 5 d is sufficient to trigger a severe phenotype and that the protocol is effective also in adulthood. On average, Scn1aRH/+ mice that underwent the SIH protocol at P21 displayed 0.4 spontaneous seizures/day in the period P71–P80, frequency that is similar to that of adult Scn1a+/− mice (0.45 spontaneous seizures/day, ANOVA for genotype effect F(1,18) = 1.62, P = 0.24). Conversely, in the same recording period, we found a higher frequency of spontaneous seizures in Scn1aRH/+ mice that underwent the SIH protocol more recently (i.e., in adulthood) (0.61 seizures/day, ANOVA for age effect P = 0.048). (B) Quantification of the proportion of LVF seizures in the two groups or Scn1aRH/+ mice. (C) Representative seizure with LVF onset (displayed with an enlarged time scale in the Middle panel) recorded in Scn1aRH/+ mice that underwent the SIH protocol in adulthood followed by a quantification of LFP’s mean spectral power in the preictal period decomposed in different frequency bands, which showed a decrease of slow and fast gamma bands’ power and an increase of delta and theta bands’ power (mixed model repeated measures ANOVA; P < 0.0001 for all the mentioned bands; 40 seizures recorded in six mice). (D) Same plots as in C, but for Scn1aRH/+ mice that underwent the SIH protocol at P21. Quantification of LFP’s mean spectral power in the preictal period showed, as for the other group of Scn1aRH/+ mice, a decrease of slow and fast gamma bands’ power and an increase of delta and theta bands’ power (mixed model repeated measures ANOVA; P < 0.0001 for all the mentioned bands; 40 seizures recorded in six mice). The average power in the baseline, preictal, and ictal period was compared by a mixed-effects model analysis followed by a Tukey’s post hoc test for pair-wise multiple comparison. *P < 0.05, **P < 0.01, ***P < 0.001.

Similar articles

Cited by

References

    1. Guerrini R., et al. , Developmental and epileptic encephalopathies: From genetic heterogeneity to phenotypic continuum. Physiol. Rev. 103, 433–513 (2023). - PMC - PubMed
    1. Scheffer I. E., et al. , ILAE classification of the epilepsies: Position paper of the ILAE Commission for Classification and Terminology. Epilepsia 58, 512–521 (2017). - PMC - PubMed
    1. Dravet C., Dravet syndrome history. Dev. Med. Child. Neurol. 53, 1–6 (2011). - PubMed
    1. Guerrini R., Cross H., Nabbout R., Dalla Bernardina B., Dravet syndrome and other sodium channel-related encephalopathies. Epilepsia 60, S1 (2019). - PubMed
    1. Zuberi S. M., et al. , ILAE classification and definition of epilepsy syndromes with onset in neonates and infants: Position statement by the ILAE Task Force on Nosology and Definitions. Epilepsia 63, 1349–1397 (2022). - PubMed

Substances

LinkOut - more resources